
Ask how much do prop firm traders make and you will meet two very different answers. Marketing pages quote large monthly figures, while the people who run the accounts mostly stay quiet.
This guide answers how much do prop firm traders make by explaining the drivers rather than quoting a headline. It stays firm-neutral, it names the arithmetic behind every payout, and it says plainly that most participants never reach one.
Why Public Income Figures Stay Scarce
Reliable income data barely exists for this industry. No regulator collects it, and no firm faces a duty to publish audited results for its traders.
So the numbers you find come from three weak sources: marketing pages, screenshots on social media, and the occasional voluntary disclosure. None of those carries the weight of an audited return.
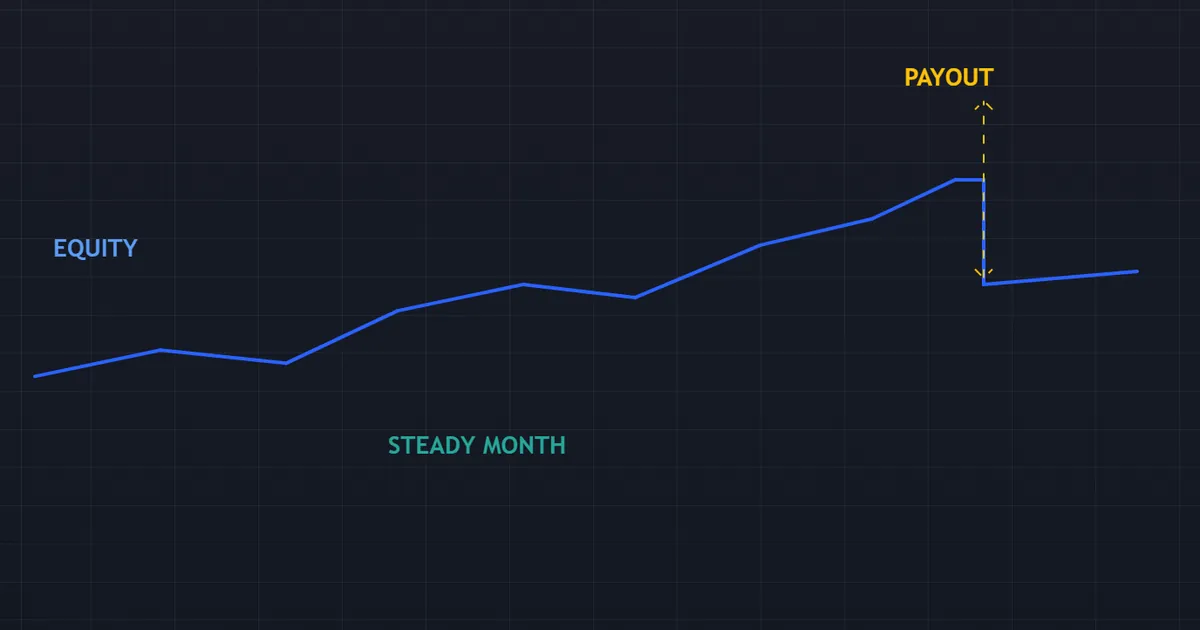
The chart above shows the shape of an ordinary good month. Equity grinds upward, a payout point arrives, and the account steps back down.
Notice how modest that path looks. A steady curve rarely photographs well, so the pictures that travel furthest are the wild ones. That gap between the typical and the visible drives most of the confusion.
Two Jobs Share One Name
Part of the muddle comes from the words. A bank prop desk hires salaried traders, and a retail funded program does not.
So salary data from the first world gets quoted at the second. Because a desk trader draws a wage and a bonus, those figures look nothing like a payout share. Check which model a number describes, or the whole comparison falls apart.
Self-Reported and Unaudited
Almost every figure in this space describes itself. A trader posts a dashboard, or a firm publishes a total it chose to release.
So treat each one as a claim rather than a measurement. Because nobody checks the working, a screenshot proves only that a screenshot exists. Ask who verified the figure, and the trail usually ends immediately.
Survivorship Shapes What You See
The traders who post results are the ones who did well. Everybody else deletes the app and says nothing.
That filter bends the picture badly. Because failures leave no trace, a feed of good months describes the survivors rather than the population. So any average you build from social media sits far above reality.
Why Firms Stay Quiet
A firm has little reason to share the full picture. Good news travels well, while the rest of the data sells nothing.
So firms tend to publish totals rather than rates. A large sum paid out across all traders sounds strong, yet it hides how few people shared it. Ask for the share of accounts that got paid, and the mood in the room changes.
Definitions Differ Between Programs
Even honest figures rarely compare cleanly. One program counts gross profit, another counts the trader’s share, and a third counts total payments sent across all customers.
So two numbers can describe the same activity and still disagree by a wide margin. Read the definition before you read the digits. Without it, a large total tells you nothing about one trader’s month.
How Much Do Prop Firm Traders Make in Practice
Strip away the noise, and a payout comes from a short chain of variables. Learn the chain, and you can price any claim you meet in seconds.
Nothing in this chain promises an outcome. It simply shows which levers move the figure, and which ones you actually control.
The Three Drivers
Every payout figure reduces to these inputs, then repeats over time.
- Account size. The capital the firm allocates to you sets the scale of everything else.
- Percentage return. Your profit for the period, measured against that capital.
- Profit split. Your agreed share of the profit, commonly eighty percent and sometimes ninety.
- Payout frequency. How often the program lets you convert profit into a payment.
- Survival. How many cycles you last before a rule breach resets you to zero.
The last item outranks the rest, though it never appears in marketing. Because one breach removes the account, a trader who survives ten cycles beats a trader who doubles a figure once.
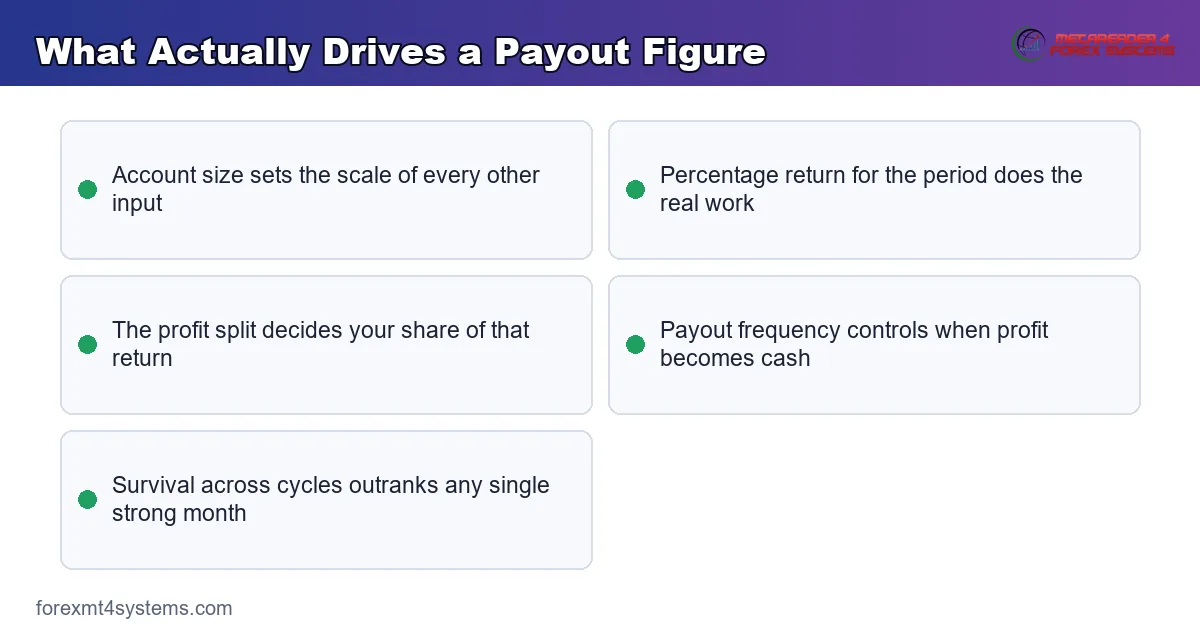
The keypoints graphic above gathers the same drivers in one panel. Read them together, since any single input tells you very little on its own.
Why Percentage Return Does the Work
Account size feels like the exciting variable, yet return does the real lifting. A large account with a flat month pays nothing at all.
So your skill shows up as a percentage, not as a balance. Because that percentage travels with you between programs, it is the only number worth tracking closely. Build it patiently, and larger capital follows through a scaling plan.
What Counts as a Realistic Monthly Return
Professional money managers rarely compound at double-digit monthly rates for long. Retail traders face the same market and the same costs.
So a low single-digit monthly percentage represents solid work, not underperformance. Because the drawdown rules punish volatility, a calm one or two percent survives far better than a swinging ten. So the modest path usually earns more over a year.
Hours Do Not Set the Pay
A day job pays by the hour, and a funded account does not. You can sit at the screen all week and earn nothing.
So more screen time often hurts. Because a rule breach ends the account, extra trades add risk without adding pay. So the best funded traders trade less than most people guess, then wait for their setup.
What the Published Numbers Actually Say
A handful of figures have reached the trade press, and they deserve careful reading. None of them supports the headline claims you meet in advertising.
Each figure below carries its source. Where a number lacks one, this guide leaves it out rather than dressing up a guess.
How Far Traders Get, By Reported Data
The trade publication Finance Magnates reported figures shared by a prop-trading technology provider covering roughly three hundred thousand accounts. In that dataset, about seven percent of accounts reached a payout at all.
The same reporting put the average payout near four percent of the funded account size. Later coverage from the same publication carried one firm founder’s estimate that only one or two percent of participants ever reach a payment. So the reported picture describes a narrow funnel, not a career path.
What a Small Payout Tells You
Look again at the reported four percent average from that dataset. On a fifty thousand dollar plan, four percent means about two thousand dollars.
Then set the entry fee beside it. A fee of one or two hundred dollars buys a shot at that sum, and most shots miss. So the model works like a paid trial with a small prize, not like a job offer.
How to Read Any Figure You Meet
Ask four questions of every number. Who produced it, over what population, across what period, and did anyone independent check it?
So a figure without answers goes in the bin. Because this industry rewards attention-grabbing claims, the burden of proof sits with the person quoting the number. Apply that test, and most income claims collapse quickly.
A Worked Illustration, Step by Step
Arithmetic beats argument, so walk one clean case. This example illustrates the mechanics and predicts nothing about your own results.
Picture a fifty thousand dollar funded account with an eighty-twenty split. You finish the month up two percent, which comes to one thousand dollars of profit, so your share works out at eight hundred dollars.
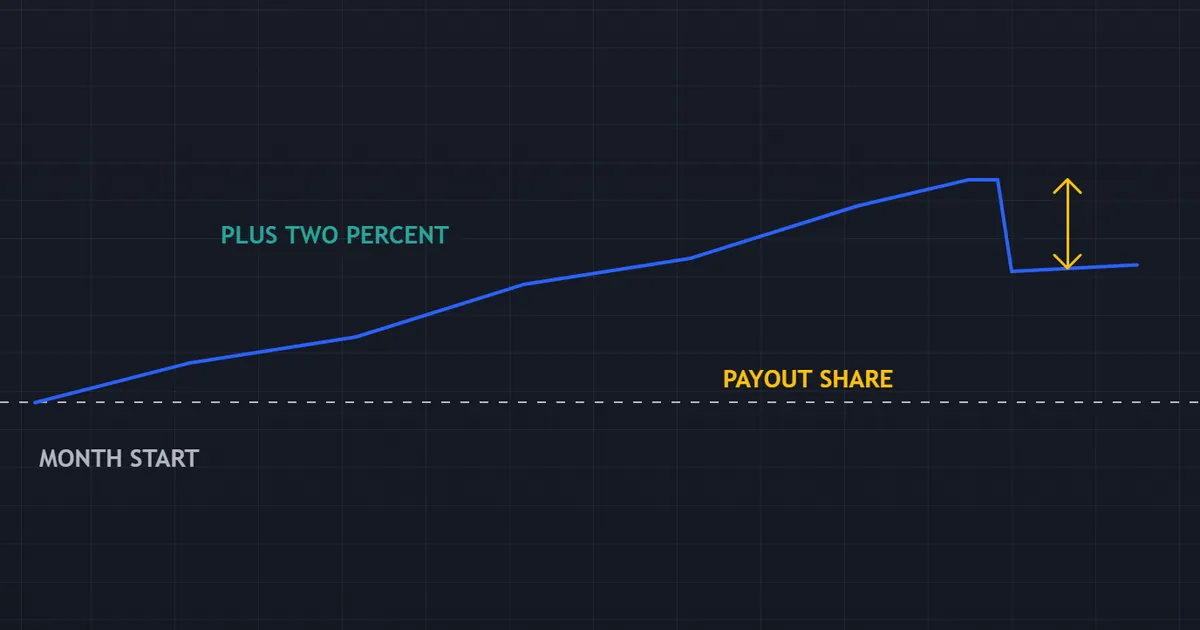
Repeat that month twelve times, and the gross figure looks like ninety-six hundred dollars. Now notice every assumption hiding inside that sentence.
You assumed twelve profitable months in a row, no breach, no consistency hold, and no change to the terms. Each of those assumptions carries a real chance of failure, and they multiply rather than add. So the honest version of the arithmetic ends with a wide range that includes zero.
The Same Month at a Larger Size
Change the capital, and the figure scales directly. A one hundred thousand dollar account earning the same two percent produces two thousand dollars of profit, so an eighty percent share comes to sixteen hundred.
So size multiplies whatever your percentage already achieves. Because it multiplies losses too, a bigger account tightens every rule in absolute terms. To size positions against a program’s loss limits, our free prop firm position size calculator does the arithmetic for you.
Costs, Fees and Tax Come Off
The gross figure above ignores several real deductions. Spreads and commissions reduce the profit before the split, and evaluation fees came out of your pocket earlier.
Then tax lands on whatever reaches you. Because a payout usually arrives as contract income rather than a wage, no employer withholds anything on your behalf. So set money aside as each payment clears, and talk to a local accountant early.
A Losing Month in the Same Model
Now run the month the other way. You end down one percent, so there is no profit and no payout at all.
The split does not help here, since a share of nothing stays nothing. So a red month pays zero, and a bad one can end the account outright. That is the part the twelve-month sum always leaves out.
What a Steady Year Might Look Like
Drop the fantasy year, then sketch a plain one. Assume some good months, some flat months, and one or two red ones.
That mix is what a real record looks like. So the yearly total lands well below twelve times your best month, and the range around it stays wide.
Good Months, Flat Months, Red Months
Say four months clear two percent, five months land near zero, and three months lose a little. The gross gain for the year sits in the low single digits.
Then take your share and pay the costs. So the yearly figure shrinks again, and it rests on you keeping the account alive the whole way. Because one breach wipes the slate, the sketch above still flatters most outcomes.
Why the Range Matters More Than the Middle
A single average figure hides the shape of the risk. Two traders with the same average can have very different years.
So think in ranges, not in point numbers. Because the low end of the range is zero for most people, any plan built on the middle will break. So plan for the low end, and treat the rest as upside.
Download the complete indicator database
Put these concepts on your charts. One email unlocks the full library of 1,380+ indicators with compiled MT4 and MT5 files, plus my TradingView scripts. No paywall, no spam, unsubscribe any time.
Get free access to my indicator database
One email unlocks 1,380+ free MT4, MT5 and TradingView indicators — the complete library. No single-tool download; you get the whole database.
Why Most Participants Never Reach a Payout
The funnel narrows three times, and each stage removes a large share of entrants. Understanding the stages explains the income question better than any figure could.
So think of the path as a series of filters. Because they compound, the group that reaches a repeated payment ends up very small.
The Evaluation Filter
Most people who buy an evaluation never pass it. A profit target sits beside a drawdown limit, and the limit usually wins.
Where firms disclose anything, their own unaudited pass rates cluster in the single digits and low teens. So the first filter alone removes the large majority of entrants. Our guide to the percentage of traders who pass prop firm challenges covers the evidence in detail.
The Funded-Stage Filter
Passing changes the pressure rather than removing it. A funded account carries the same drawdown floor, and now the trader feels a pull toward faster gains.
So many funded accounts close before the first payment clears. Because a trailing floor tightens as equity grows, a giveback can end an account that looked comfortably ahead. That filter removes much of the group that survived stage one.
The Repeat-Payout Filter
One payout proves very little on its own. A single good month can arrive by luck, and the following month decides whether a process exists.
So the group that collects payment after payment shrinks again. Because durable results demand both skill and restraint, that final group represents a small slice of everyone who started. Treat membership in it as a possibility rather than a plan.
Common Income Mistakes and Fixes
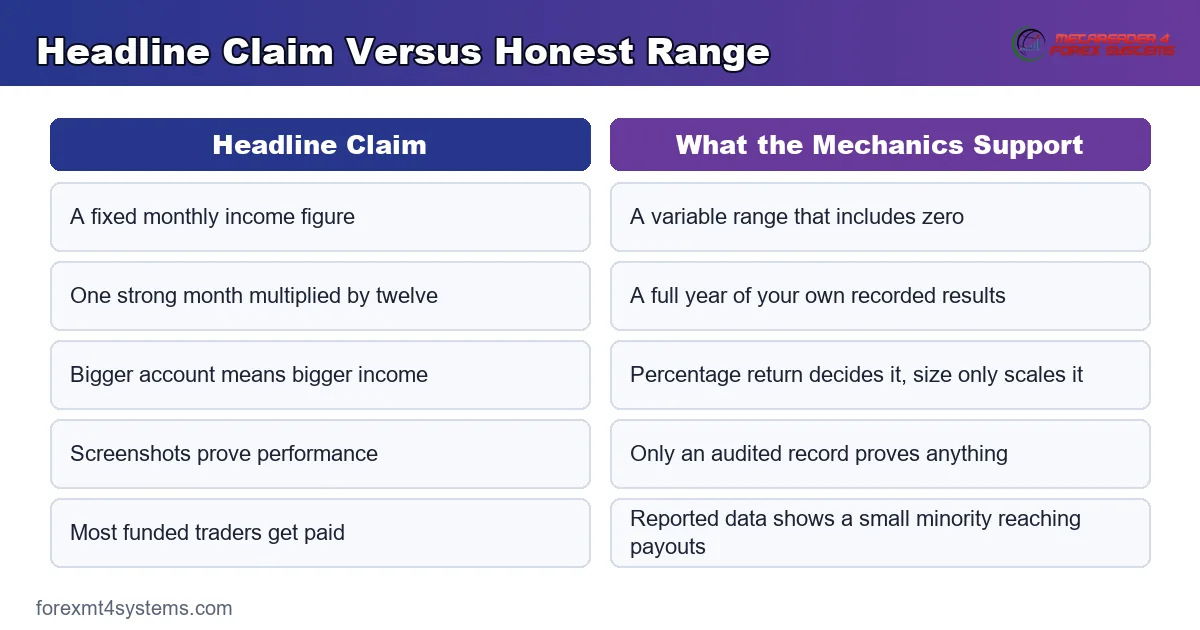
The arithmetic misleads people in predictable ways. The comparison graphic below sets a headline claim beside the range the mechanics actually support.
Annualising One Good Month
Multiplying a strong month by twelve produces a fantasy. Losing months arrive, and breaches reset the count to zero. So project from a full year of your own records, or project nothing at all.
Quitting a Job on a Projection
Some traders resign after a first payout. The next cycle then delivers a hold, a breach, or a flat month. So build six months of living costs outside trading before the income question even arises.
Chasing a Bigger Account Too Early
A larger account looks like the shortcut to a larger payment. It also enlarges every loss and tightens every limit in absolute terms. So raise your percentage return first, then let a scaling plan raise the capital.
Ignoring the Cost of Retries
Each failed evaluation costs another fee. Traders who rush through several attempts spend real money before earning any. So count those fees against your results, and slow down until your process holds.
Running Many Accounts at Once
Several accounts feel like diversification. In practice one strategy drives them all, so a single bad week breaches every one together. So scale deliberately, and treat correlated accounts as one position.
Believing Screenshots
A dashboard image proves nothing about a sustained record. Losing accounts never appear in anyone’s feed. So judge a claim by an audited track record, or discount it entirely.
Income Reality Quick Reference
Keep this short list handy whenever a figure catches your eye. Run through it before you build any plan around trading income.
- Account size, percentage return, profit split and frequency drive every payout.
- Survival across cycles matters more than any single strong month.
- Reported data shows only a small share of accounts ever reaching a payout.
- Public income figures are self-reported, unaudited and shaped by survivorship.
- Costs, evaluation fees and tax all reduce what finally reaches you.
- A low single-digit monthly percentage represents solid, durable work.
- Treat trading income as variable and uncertain, never as a wage.
Pitfalls and Edge Cases
A few wrinkles bend the clean arithmetic, so keep them in view. The chart below shows an account that breaches its floor before any payout arrives.
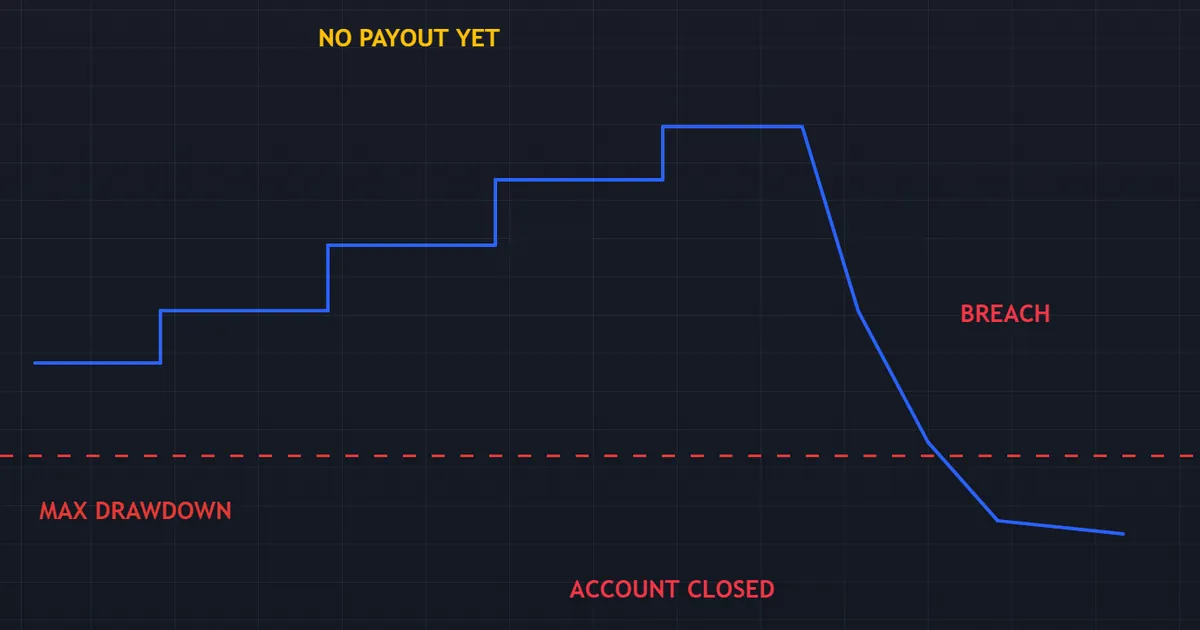
Picture the sequence from the trader’s side. Profit builds for several weeks, the first payout starts to look close, and then one oversized session pierces the floor. The projected income for that year becomes zero.
Consistency Rules Cap a Big Month
A single outsized day can hold a payment back at many programs. So a spectacular month sometimes pays less than a steady one. Read the consistency clause before you plan around a strong run.
Scaling Plans Move Slowly
Ladders usually ask for several profitable months per rung. So the path to large capital measures in quarters, not weeks. Because each rung also raises absolute risk, patience serves you twice over.
Compare a Payout to Your Own Capital
Set the payout beside what your own money could earn. A funded account hands you scale you could not buy, and it takes a share plus a rule set in return.
So the trade is scale for control. Because a personal account keeps every dollar of profit, a trader with real capital may prefer it. Weigh both routes on the same page before you pay a fee.
Program Terms and Solvency Change
Splits, thresholds and cycles get rewritten, sometimes without notice. Programs have also paused payments during stressed periods. So withdraw promptly, keep records, and avoid resting a plan on one provider.
Payout Timing Shifts Your Year
Profit and cash arrive on different dates. A gain made late in a cycle may pay out weeks later.
So your bank balance lags your trading. Because bills do not wait, that gap catches people who plan month by month. Keep a buffer, and the lag stops mattering.
Simulated Flow Changes the Picture
Many funded accounts run on simulated capital, with payments coming from firm revenue. So the money depends on the business rather than on market fills. That distinction belongs in any honest income calculation.
Related Concepts to Study Next
Income sits downstream of everything else in prop trading, so the neighbouring topics repay an hour of reading. Each one explains part of the funnel that decides whether a payment ever arrives.
Start with our breakdown of prop firm payouts, then read why traders fail prop firm challenges for the failure modes that reset the count. For the model itself, see what a funded trading account is, or browse the wider prop trading library. Because percentage return starts with sizing, pair it with our note on risk per trade, then model a steady month with our compounding calculator.
FAQ
How much do prop firm traders make on average?
No credible average exists, because nobody audits the population. Reported datasets suggest only a small minority of accounts ever reach a payout, and the payments that do land are often modest relative to the account size. So the honest answer describes a wide range that includes zero.
What decides the size of a payout?
Four inputs decide it: the account size, your percentage return for the period, the profit split, and how often the program lets you withdraw. Survival across cycles then multiplies or erases the result. Skill shows up in the percentage, not in the balance.
Can a funded account replace a salary?
Rarely, and never on a projection from one good month. Payouts depend on profit produced inside strict rules, and a single breach can end the account. So most people who try never reach a steady payment, which makes a job or a cash reserve essential.
Why are published income figures so unreliable?
They are self-reported, unaudited, and shaped by survivorship, since losing traders post nothing. Definitions also differ, so one program’s total payments and one trader’s monthly share get quoted side by side. Always ask who measured the figure and across which population.
Does a larger account mean a larger income?
Only when the percentage return holds up. A large account with a flat month pays nothing, and it enlarges every loss in absolute terms. So raise your return and your consistency first, then let a scaling plan raise the capital.
Is prop trading a dependable income?
No, and any page that says otherwise deserves suspicion. The model pays you a share of profit you produce inside rules that can close the account at any time, and reported data shows most participants never reach a payment. So treat it as uncertain, variable work rather than a wage, and size your life around that reality. Results are not guaranteed; past performance is not indicative of future results.
External references
- For background on this concept, see Rate of Return at Corporate Finance Institute.
- For broader market context, see Profit Sharing on Wikipedia.

About the author
Written by Dominic Walsh, a Forex trader and MT4/MT5 indicator, Expert Advisor and script developer. Every tool on forexmt4systems.com is tested on live charts before release and ships with ready-to-use compiled MT4 (.ex4) and MT5 (.ex5) files. Learn more about the trader and developer behind this site.
How we build, test and correct every tool: Editorial & Testing Policy. Trading carries risk; see the disclaimer.