
Market manipulation is any deliberate attempt to push a price away from where real supply and demand would set it. In forex, the best documented case is the 4pm London fix scandal, where regulators fined major banks for attempts to rig currency benchmarks. This guide covers what happened, how the fix works, and what we found when we measured the fix window on nine markets. In short, the fix bars are busier, mostly at month-end. But busy is not the same as rigged, and a retail chart cannot tell the two apart.
What market manipulation means in forex
The common thread is intent: someone trades or posts orders to move a price, not to buy or sell what they need. Typical forms include:
- Benchmark rigging: trading hard into the window that sets a reference rate, so the rate lands where a trader wants it.
- Collusion: traders at rival firms sharing client orders and agreeing on a plan.
- Spoofing: placing orders you mean to cancel, so others see demand that does not exist.
Spot forex adds a twist. It trades over the counter, with no single exchange and no single price. The FCA itself described spot FX as an unregulated market in 2014. So the UK fines targeted the banks’ failure to control their traders, while the US CFTC charged attempted manipulation of benchmark rates.
Retail traders use the word more loosely. A spike through a stop or a fast reversal after news often gets called manipulation online. ICT teaching even uses the word for one phase of its daily model, covered in our guide to accumulation, manipulation and distribution. That is a trading label, not a legal finding.
The 4pm London fix scandal
The WM/Reuters 4pm fix is a set of daily reference rates for currencies. Companies and funds use fixes to value assets and manage currency risk, as the FCA’s November 2014 press release on the FX fines explains. In 2014, the fix used trades on one electronic platform in a one-minute window, 30 seconds either side of 4pm London. That short window was the weak spot.
Then came the findings. On 12 November 2014, the FCA fined Citibank, HSBC, JPMorgan Chase, RBS and UBS a total of £1,114,918,000, about $1.7 billion. The same day, the CFTC’s order against the same five banks added over $1.4 billion in penalties. It found attempted manipulation of FX benchmark rates, including the 4pm fix. Next, on 20 May 2015, the Federal Reserve announced more than $1.8 billion in fines against six banking groups. Its release notes that the US Department of Justice brought criminal charges against five of them at the same time.
How fix manipulation worked
The incentive is simple. Say a fund asks its bank to buy euros at the fix, and the bank agrees to deal at whatever rate the fix prints. Now suppose the bank buys its euros earlier at lower prices, then pushes the rate up inside the window. It then sells to the client at the higher fix, and the client pays the difference.
One bank alone may lack the size to move the rate. That is where the chat rooms came in. According to the CFTC, traders used private chat rooms to share confidential client orders and to agree on trading plans. The Financial Stability Board’s 2014 report on FX benchmarks traced the problem to how trading clustered around the fixings. Its first recommendation: make the window wider than one minute, with five minutes as the median market suggestion.
None of this shows up in price alone. So our test measures something simpler: how busy the fix bars are compared with the bars around them.
range ratio = average range of the fix bars / average range of the nearby bars
We built the same ratio for tick volume. A value of 1.0 means the fix bars look like any other bar that afternoon.
Spoofing and stop hunts: the other claims
Spoofing means posting large orders you plan to cancel before they fill. US law has banned it in futures markets since the 2010 Dodd-Frank Act. Spotting it needs a full order book, though, and spot forex has no single book. MetaTrader 4 shows no order book at all.
Stop hunting is the claim retail traders make most often. In one version, large players push price through obvious highs and lows to fill orders against the stops resting there. Our page on stop hunting in forex covers that view. In the other version, the broker moves its own quotes to knock clients out. That claim deserves a real check, because a B-book broker takes the other side of client trades. Our guide to A-book versus B-book brokers explains the conflict. Still, a conflict of interest does not prove quote rigging.
We also tested the first version in a crude way. Across 23 pairs from June 2018 to August 2026, price traded above the previous day’s high and closed back below it 6,369 times. The next day closed lower only 48.0% of the time, about what chance gives. Planned stop hunts before a turn should show clearer follow-through.
How we tested the fix window
We measured the fix window on M15 history from MetaTrader 4, build 1471, on the Capital Point Trading server.
- Markets: EURUSD, GBPUSD, USDCAD, USDCHF, AUDCAD, NZDCAD, XAUUSD (gold), AUDUSD and USDJPY.
- Window: June 2025 to August 2026, set by each symbol’s history. GBPUSD starts on 30 September 2025, AUDUSD and USDJPY on 25 March 2026.
- Clock: London time, with British summer time applied.
- Month-end: the last weekday of each month.
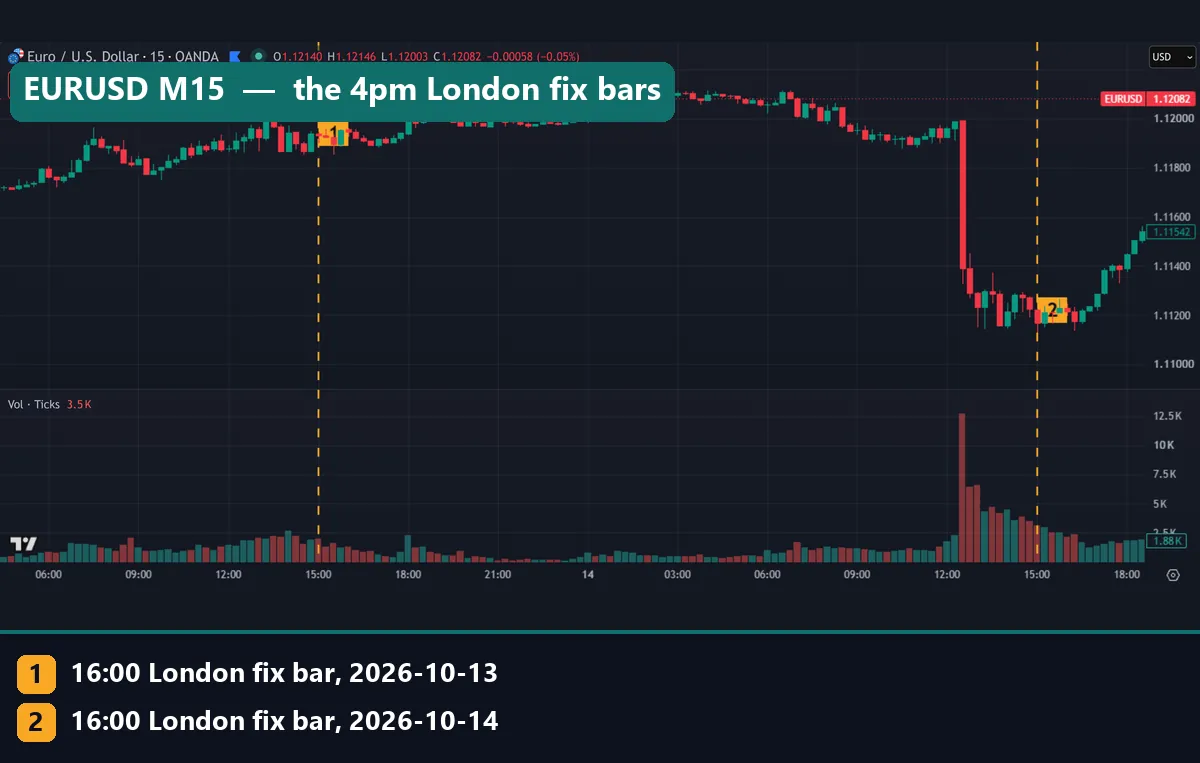
The chart examples come from the TradingView web chart with OANDA data on the 15-minute timeframe. We took them on 15 October 2026, and each shows 13 and 14 October 2026. The chart clock is UTC, so the 16:00 London fix bar sits at 15:00 while Britain keeps summer time. Our editorial testing policy explains how we test.
Our measurement settings
| Setting | Value |
|---|---|
| Fix bars | M15 bars starting 15:45 and 16:00 London (they span the whole fix window) |
| Nearby bars | The other M15 bars from 14:00 to 17:30 London |
| Range ratio | Average fix-bar range / average nearby-bar range |
| Volume ratio | The same, with tick volume |
| Month-end fix bars | 194 in total, 10 to 28 per symbol |
| Other-day fix bars | 4,170 in total, 190 to 608 per symbol |
Two bars per day means the 26 month-end bars on EURUSD cover 13 month-ends. AUDUSD and USDJPY have only five each, so treat their figures as rough. We placed no trades, so spread, swap and commission play no part.
Reading the fix on a chart
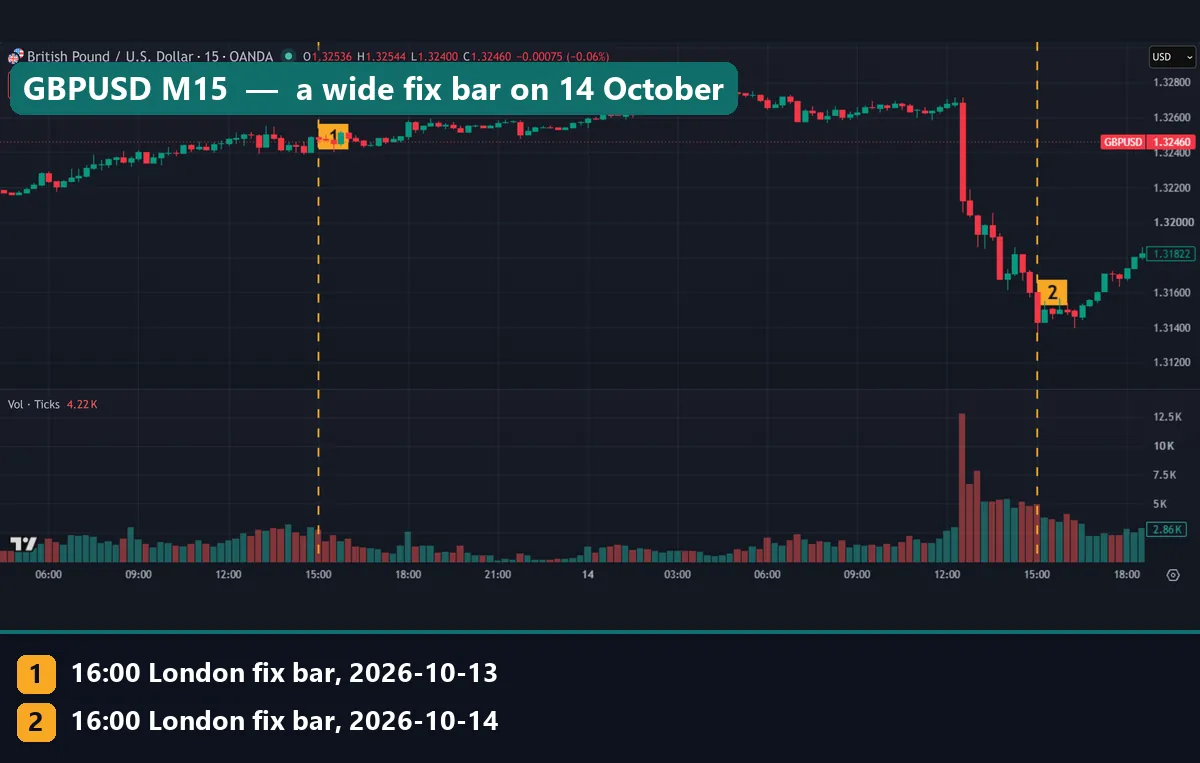
On our captures, the gold dashed lines mark the 16:00 London bar, with tick volume below. Marker 1 is 13 October and marker 2 is 14 October, both ordinary mid-month days. On GBPUSD, the 13 October fix bar barely stands out. On 14 October, the pair dropped hard from above 1.3260 at 12:30 UTC. The fix bar then printed a wide range near the afternoon low, around 1.3140, before a climb toward 1.3182.
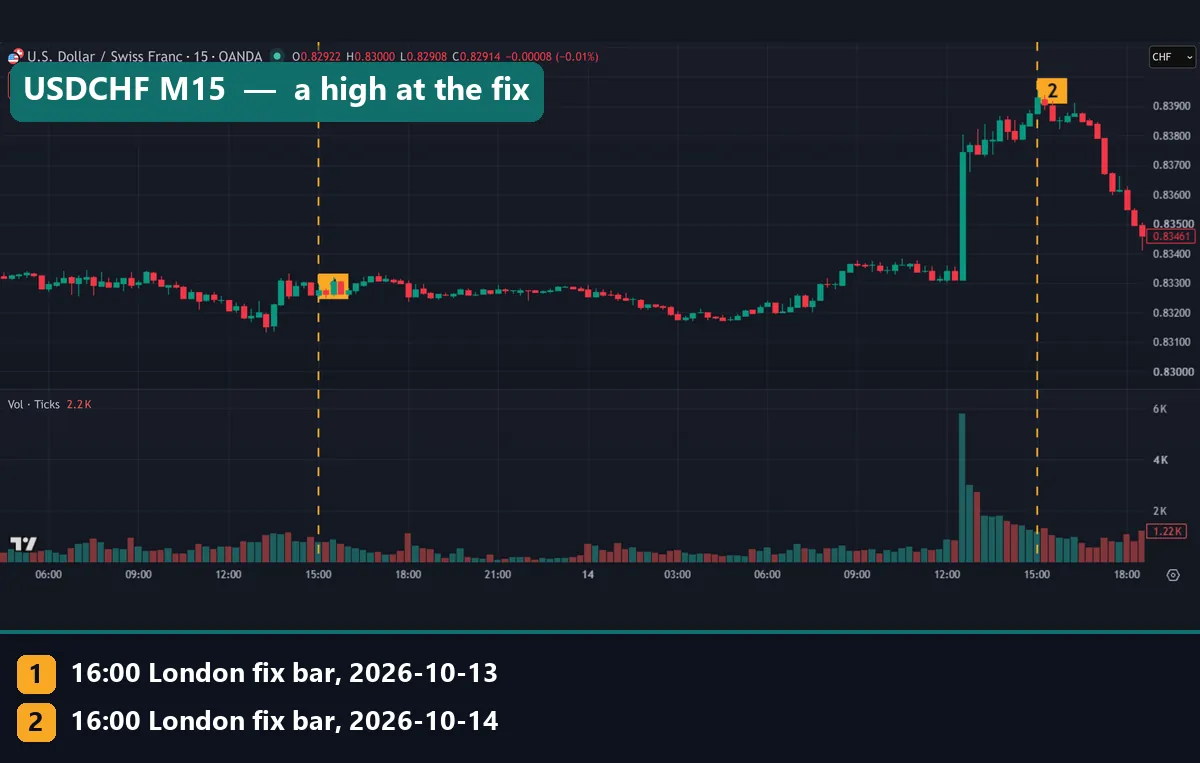
USDCHF tells the mirror story. On 14 October it jumped from about 0.8330 at 12:30 UTC, and the fix bar printed near the day’s high around 0.8390. After that, the pair slid to 0.8346. A chart like this tempts people to say someone “ran the fix”. However, the same picture fits a large hedge order that finished at 16:00. The chart cannot tell you which.
Worked example: the fix bars on 13 and 14 October
For each chart, we compared the 16:00 London bar’s range with the average range of the nearby bars that afternoon. A pip is 0.0001, or 0.01 for USDJPY, and gold is in dollars.
| Symbol | 13 Oct fix bar | Nearby average | Ratio | 14 Oct fix bar | Nearby average | Ratio |
|---|---|---|---|---|---|---|
| EURUSD | 4.5 pips | 7.4 pips | 0.61 | 9.5 pips | 10.1 pips | 0.94 |
| GBPUSD | 3.8 pips | 7.5 pips | 0.51 | 23.3 pips | 13.6 pips | 1.71 |
| USDCHF | 4.0 pips | 5.7 pips | 0.71 | 7.8 pips | 6.9 pips | 1.13 |
| USDJPY | 8.4 pips | 7.0 pips | 1.21 | 12.2 pips | 10.5 pips | 1.16 |
| AUDUSD | 3.4 pips | 4.1 pips | 0.83 | 7.7 pips | 8.5 pips | 0.91 |
| XAUUSD | $3.98 | $8.02 | 0.50 | $10.59 | $11.85 | 0.89 |
So on these two days, the fix bar beat its neighbours in only 4 of 12 cases. GBPUSD on 14 October stood out at 1.71 times, yet the gold fix bar on 13 October was half the size of the bars around it. In short, two ordinary days show nothing special about 4pm.
The bigger lesson sits elsewhere on the same charts. In five of the six captures, the busiest bar came at 12:30 UTC on 14 October, which is 8:30 in New York. On EURUSD and GBPUSD its tick volume reached the 12.5K line, several times the fix bar. Every chart moved at once, all in the dollar’s favour. That looks like a scheduled data release, the kind of forex news spike our news guide covers. Still, we did not match it to a named release.
What 13 months of month-ends showed
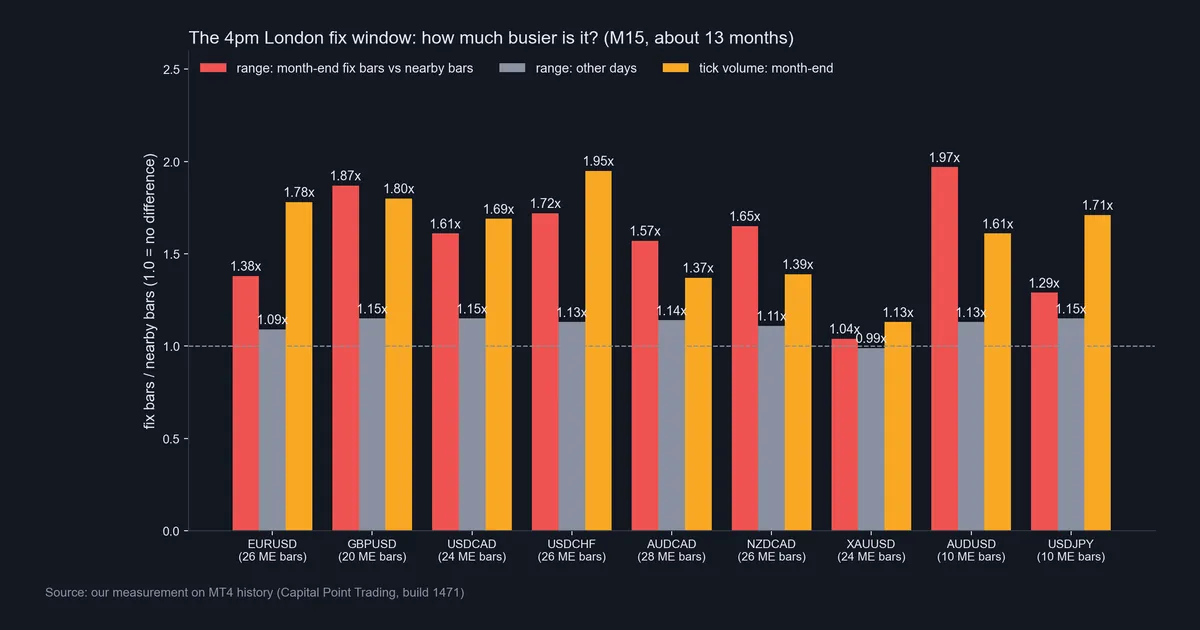
The MT4 test tells a clearer story. On ordinary days, the fix-bar range ran 1.09 to 1.15 times the nearby bars across the eight currency pairs. On month-ends it ran from 1.29 times on USDJPY to 1.97 times on AUDUSD. Tick volume moved the same way: 1.37 to 1.95 times on month-ends, against 1.12 to 1.22 times on other days.
There is a plain reason for the month-end jump. Many asset managers value portfolios and reset currency hedges at month-end. They often deal at the fix, so their trade price matches the price they report. That flow is large and squeezed into a few minutes, so it would make the fix bars busier even in an honest market.
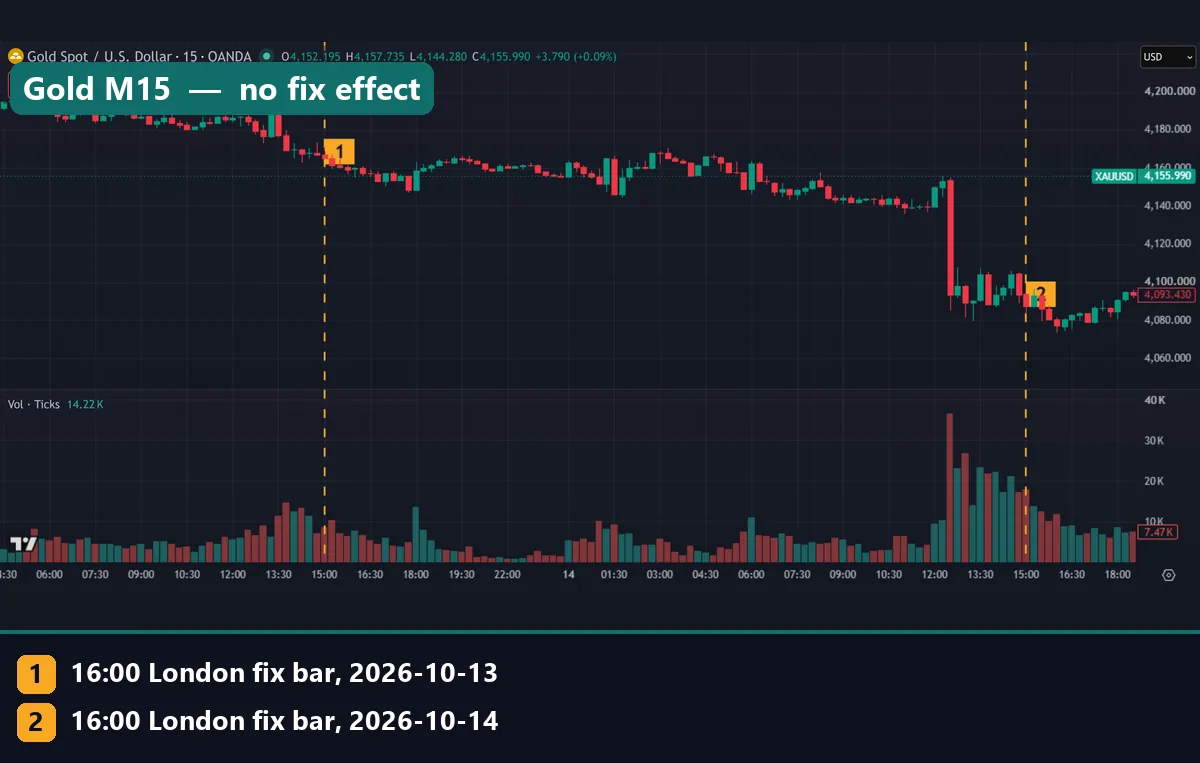
Gold is the exception. Its fix bars ran 1.04 times the nearby range on month-ends and 0.99 times on other days. That fits, because the WM/Reuters fix is a currency benchmark, and gold has its own benchmark auctions at other times. Our gold capture agrees: both fix bars look normal next to the 12:30 UTC drop on 14 October.
Download the complete indicator database
Put these concepts on your charts. One email unlocks the full library of 1,380+ indicators with compiled MT4 and MT5 files, plus my TradingView scripts. No paywall, no spam, unsubscribe any time.
Get free access to my indicator database
One email unlocks 1,380+ free MT4, MT5 and TradingView indicators — the complete library. No single-tool download; you get the whole database.
Where it fails: what a retail chart cannot show
Our test measures activity, and activity is not evidence of manipulation. Regulators built the bank cases on chat-room messages and trading records, not on candles. The CFTC even attached example chats to its press release. Other limits are practical:
- No central tape. Spot forex has no single record of trades, and another broker’s chart can differ from yours.
- Tick volume is not traded volume. It counts price changes on one feed. Our guide on open interest versus volume explains the gap.
- Small samples. We had 5 to 14 month-ends per symbol, so one odd month moves the ratio a lot.
- Coarse bars. The fix window lasts minutes, and our bars last 15, so a sharp push gets blended with quiet minutes.
- Clock changes. The fix stays at 16:00 London but moves between 15:00 and 16:00 UTC across the year.
- A different era. Our 2025 and 2026 data says nothing about how the fix behaved from 2008 to 2013.
A turn at the fix proves nothing
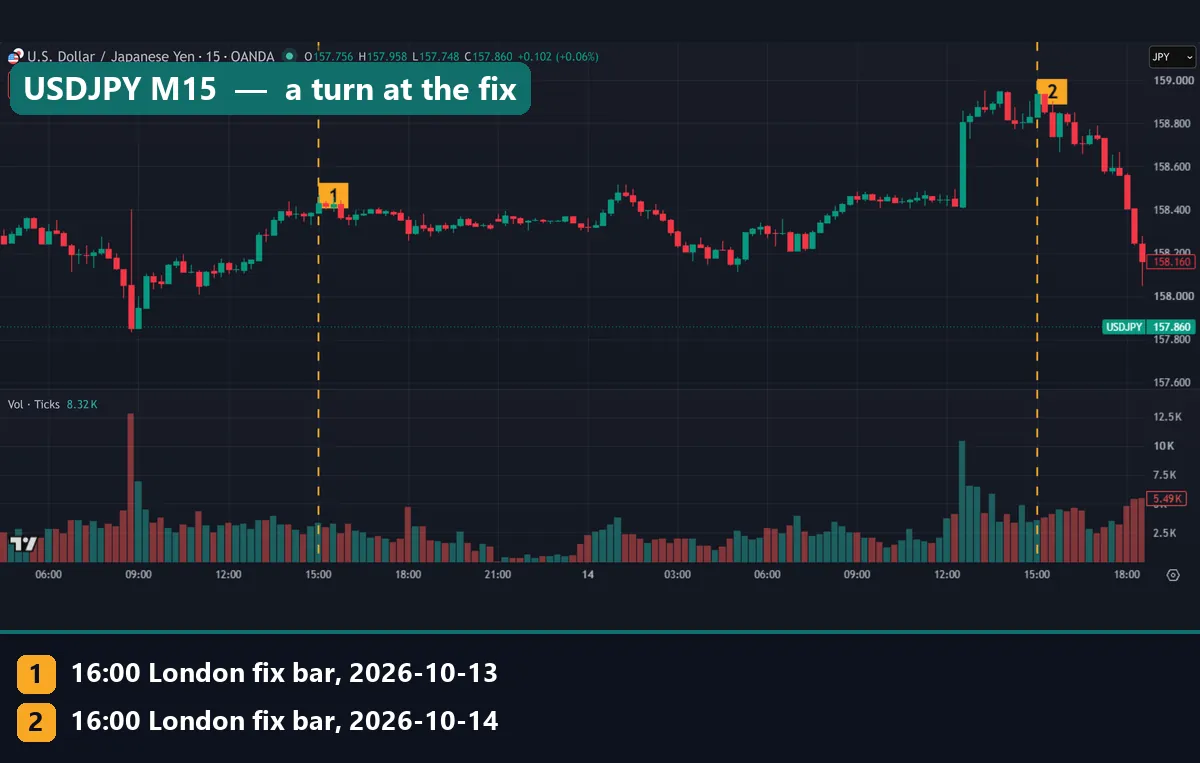
USDJPY topped near 159.00 right at the 14 October fix bar, then fell to 158.16. AUDUSD shows the mirror image, with a low just after the fix near 0.6950. Online, a tidy turn like this often gets posted as proof that banks “run the fix”.
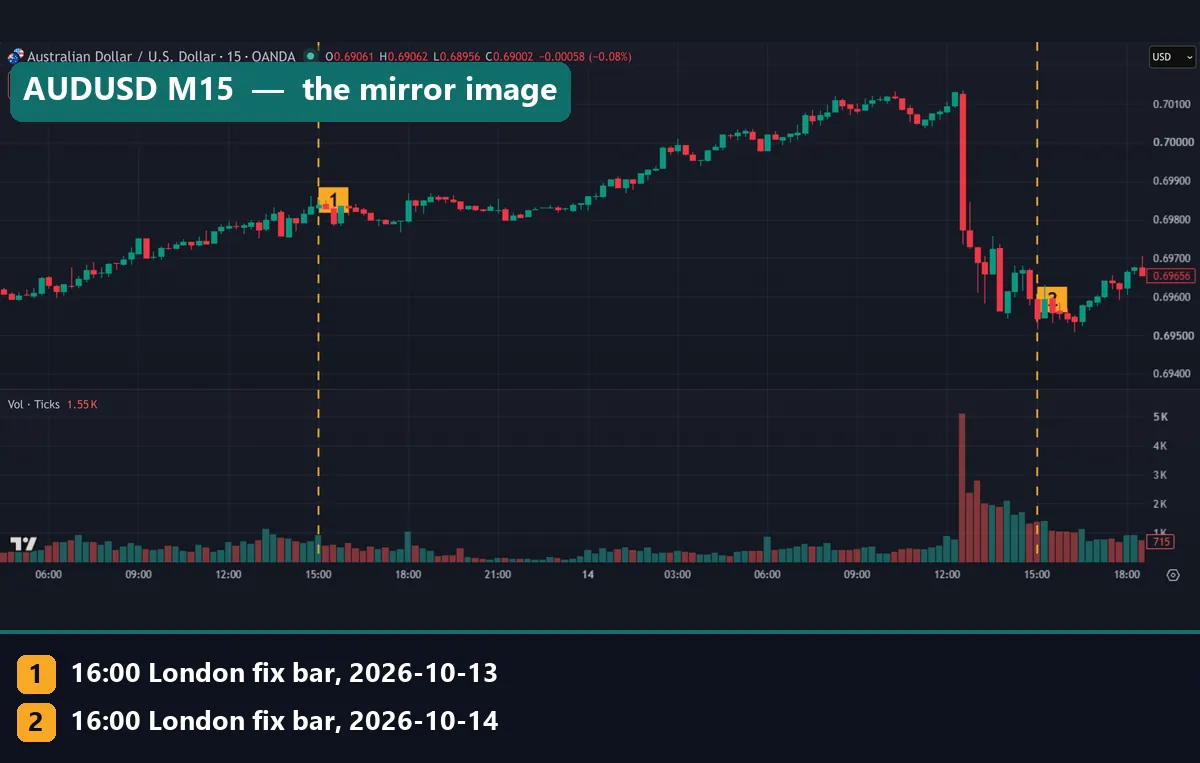
We cannot rule that out from a chart, but we cannot rule it in either. On 14 October the dollar had rallied hard since 12:30 UTC. Also, the fix falls in the last hour of the London trading session, when European desks close out their day. Either fact could explain a turn near 16:00. Meanwhile, our worked example found the fix bar smaller than its neighbours in 8 of 12 cases.
Common mistakes when you suspect manipulation
1. Calling every spike a stop hunt. When gold and five currency pairs jump in the same 15-minute bar, as at 12:30 UTC on 14 October, the cause is market-wide. Check the economic calendar first.
2. Reading tick volume as size. A tall tick-volume bar means many price updates on your broker’s feed. It does not show how much money traded, or who traded it.
3. Treating month-end fix activity as rigging. Ratios near 2.0 look dramatic. Yet hedging and valuation flows explain them without any misconduct.
4. Blaming the broker without a second feed. Compare your broker’s chart with another feed for the same minute. Also learn why spreads widen around the rollover and news, since a wide spread can trigger a stop with no price spike. Then check the broker against the usual forex broker red flags.
Where to go next
To protect yourself rather than prove anything, start with your broker. Our overview of forex regulatory bodies lists the main regulators to check against. Then read how an ECN broker differs from a market maker, since that decides where your prices come from.
Next, find the fix in your own time zone with our forex time zone converter. For scale, our guide to daily trading volume in forex puts the market’s size in context. In the end, market manipulation in forex is real and documented, but the proof came from records, not charts.
FAQ: market manipulation in forex
Is the forex market manipulated?
Parts of it have been. Regulators fined major banks over attempts to manipulate FX benchmarks in 2014 and 2015. That does not mean every move you see is rigged.
What was the forex fix scandal?
Traders at large banks used private chat rooms to share client orders and plan trades around FX benchmarks, including the 4pm fix. The FCA fined five banks £1.1 billion in November 2014, and the CFTC added over $1.4 billion the same day.
What is the WM/Reuters 4pm fix?
It is a set of daily currency reference rates set around 4pm London time. In 2014 it drew on a one-minute window, and the FSB then recommended a wider one.
Is the 4pm fix still busier than other times?
In our MT4 data, yes, mainly at month-end. Fix bars ran 1.29 to 1.97 times the range of nearby bars on month-ends, against 1.09 to 1.15 times on other days.
Can I see market manipulation on an MT4 chart?
Not in any reliable way. MT4 shows one broker’s prices and tick volume, with no order book and no record of who traded.
Do brokers move prices to hit stops?
A B-book broker has a conflict of interest, but that alone does not prove quote rigging. Compare its prices with a second feed, and check its regulator.
Is spoofing possible in forex?
It can happen on the platforms banks use, where orders sit in a visible book. However, retail traders cannot see those books.
Should I avoid trading at the 4pm fix?
In our data, month-end fix bars ran up to 1.97 times the nearby range, so a tight stop there faces more noise. That is a risk point, not an edge, and our figures exclude spread, swap and commission; results are not guaranteed; past performance is not indicative of future results.
Last updated: 15 October 2026.

About the author
Written by Dominic Walsh, a Forex trader and MT4/MT5 indicator, Expert Advisor and script developer. Every tool on forexmt4systems.com is tested on live charts before release and ships with ready-to-use compiled MT4 (.ex4) and MT5 (.ex5) files. Learn more about the trader and developer behind this site.
How we build, test and correct every tool: Editorial & Testing Policy. Trading carries risk; see the disclaimer.