
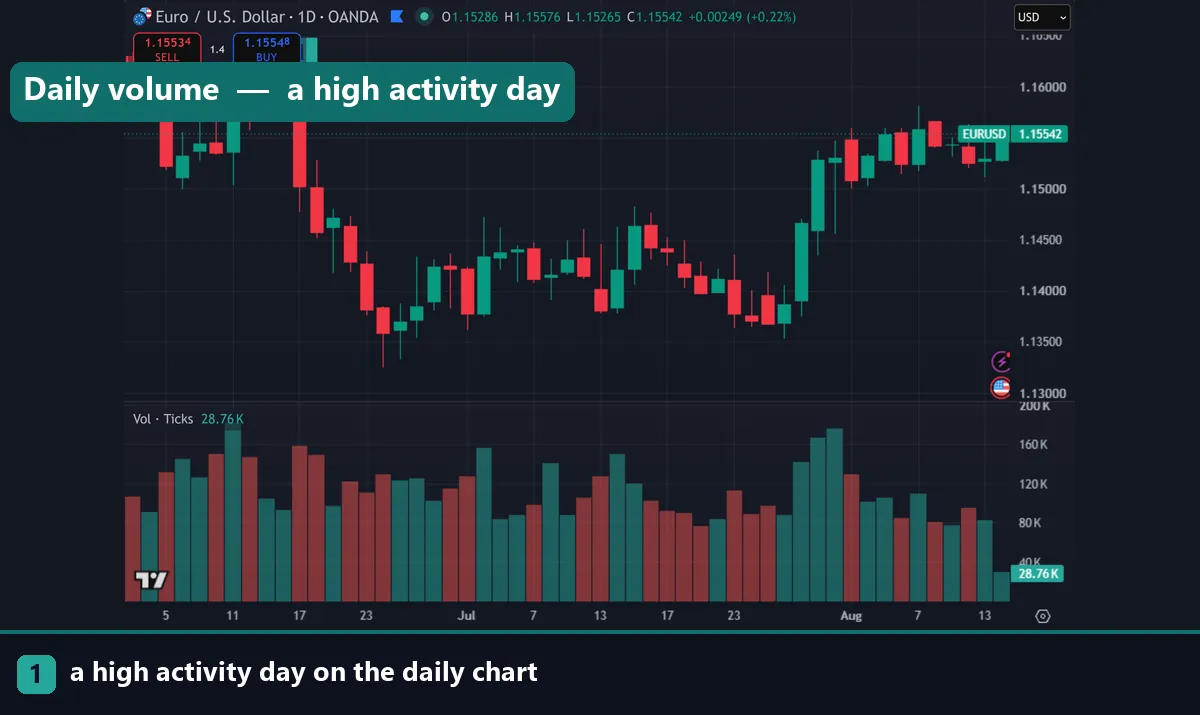
The daily trading volume forex markets generate is quoted at roughly 7.5 trillion dollars, a figure that comes from a survey run every three years by the Bank for International Settlements. It is the number every broker advert repeats, and almost none of it is available to you as a retail trader. This guide covers what the figure counts, what your platform shows instead, and how to use volume on a chart without misreading it.
Where the headline number comes from
The BIS Triennial Survey polls central banks and dealers across the major financial centres. The 2022 round put average daily turnover near 7.5 trillion dollars. The next round updates it.
That total covers everything: spot deals, forwards, swaps, options and interbank settlement. Spot trading — the exchange of one currency for another at the current price — is only around a third of it.
Foreign exchange swaps make up the largest single share. Those are financing transactions between institutions rather than directional bets, so a large part of the headline figure represents plumbing rather than speculation.
Retail trading is a rounding error inside it. The number tells you the market is deep and liquid, which matters, and it tells you nothing about what any individual price is doing.
Daily trading volume forex charts actually show
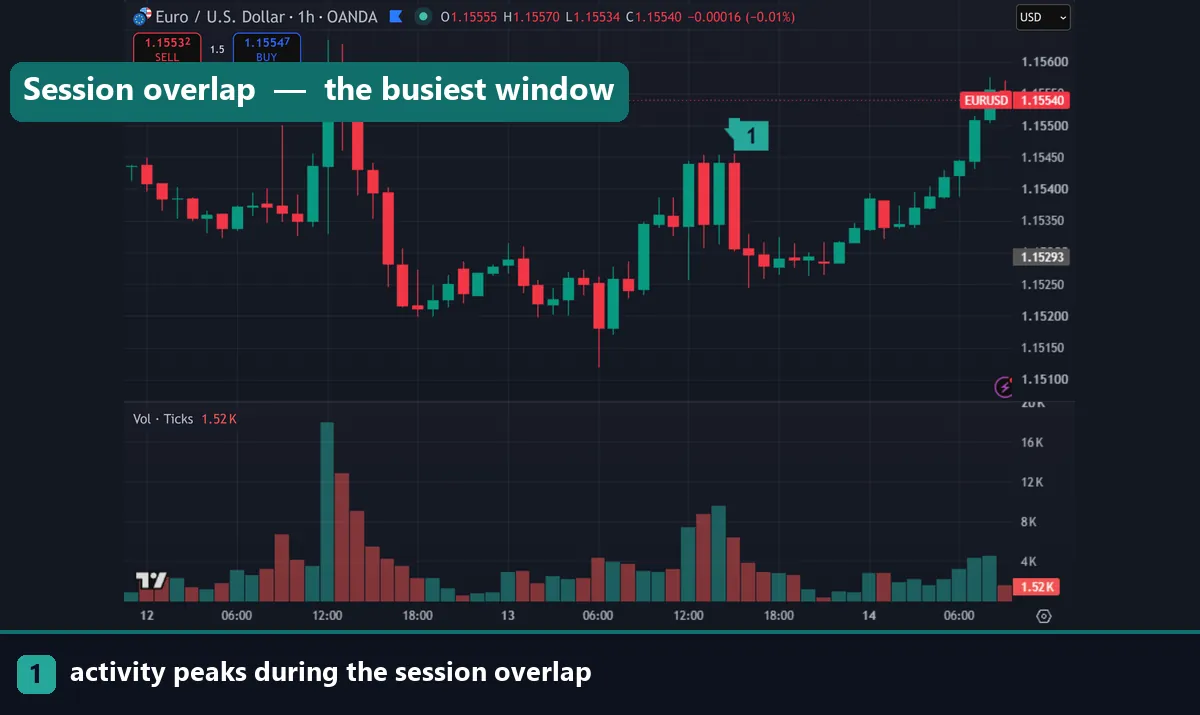
Here is the part that catches people out. Forex has no central exchange, so no one publishes a consolidated volume figure. Your platform cannot show real traded volume because the data does not exist in one place.
What you see instead is tick volume: the number of price updates in each bar. If EURUSD changed quote fifty times during an hour, that hour’s volume bar reads fifty.
| Measure | What it counts | Where you get it |
|---|---|---|
| BIS turnover | Notional value of all FX deals | Survey, every three years |
| Tick volume | Price updates per bar | Your MT4 or MT5 chart |
| Broker volume | Lots traded at one broker | Rarely published |
| Futures volume | Real contracts on CME | CME, free with delay |
Tick volume is a proxy, not a measurement. It correlates reasonably well with real activity — busy periods produce more quote updates — and it varies between brokers because each feed is different.
Why the session matters more than the day
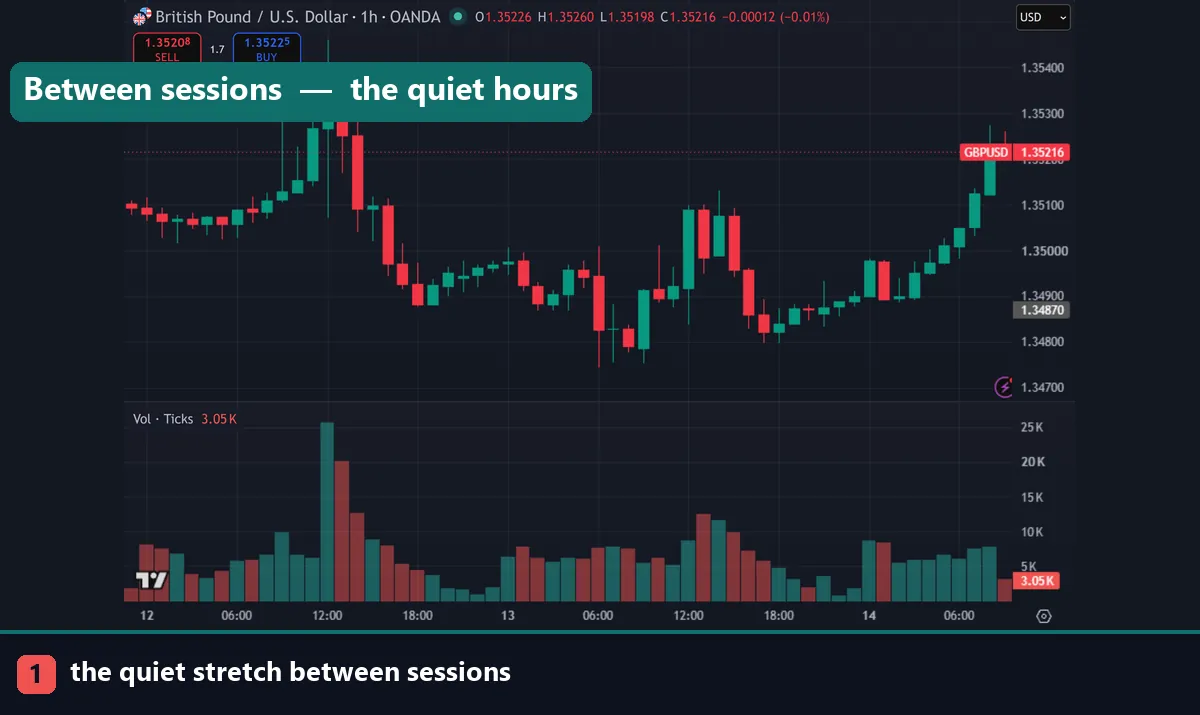
Activity is not spread evenly across twenty-four hours, and the shape of the day is more useful than any daily total.
The London session carries the largest share, roughly 08:00 to 16:00 UK time. The New York session follows, and the four-hour overlap between them is the busiest window of the week.
The Asian session is quieter for European pairs and more active for yen and Australian dollar crosses. Between the New York close and the Tokyo open, activity thins to its lowest point.
Spreads track this directly. A pair that quotes 0.6 pips during the overlap can quote several pips in the thin hours, which changes the arithmetic of any short-target strategy. Our forex trading sessions guide maps the windows.
Reading volume without overreading it
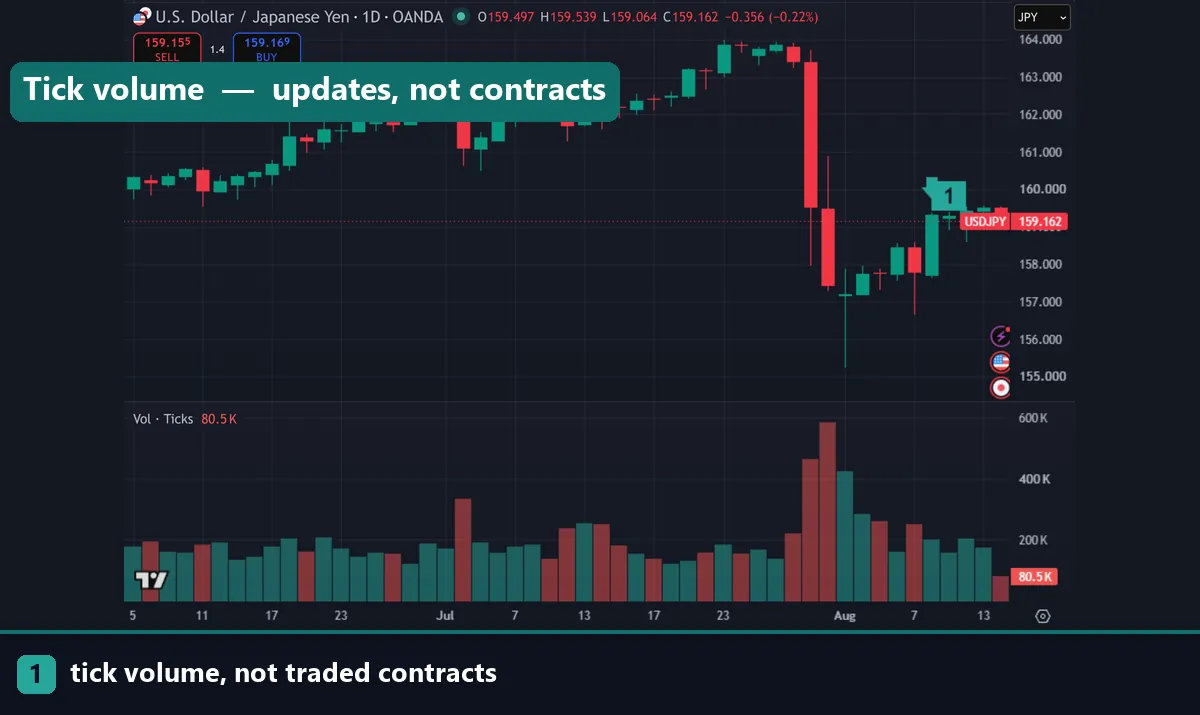
Three uses hold up. Everything beyond them tends to be pattern-matching after the fact.
Confirming a breakout. A move out of a range on rising tick volume has more participation behind it than the same move on flat volume. Not proof, but useful context.
Spotting exhaustion. A very large volume bar at the end of an extended run often marks the point where the last participants entered. What follows is frequently a stall.
Timing your session. If your strategy needs movement, trade when volume says the market is awake. If it needs quiet ranges, do the opposite.
What volume cannot tell you is direction. A tall bar means many quote updates arrived, not that buyers outnumbered sellers, since every trade has both sides.
Download the complete indicator database
Put these concepts on your charts. One email unlocks the full library of 1,380+ indicators with compiled MT4 and MT5 files, plus my TradingView scripts. No paywall, no spam, unsubscribe any time.
Get free access to my indicator database
One email unlocks 1,380+ free MT4, MT5 and TradingView indicators — the complete library. No single-tool download; you get the whole database.
The futures cross-check
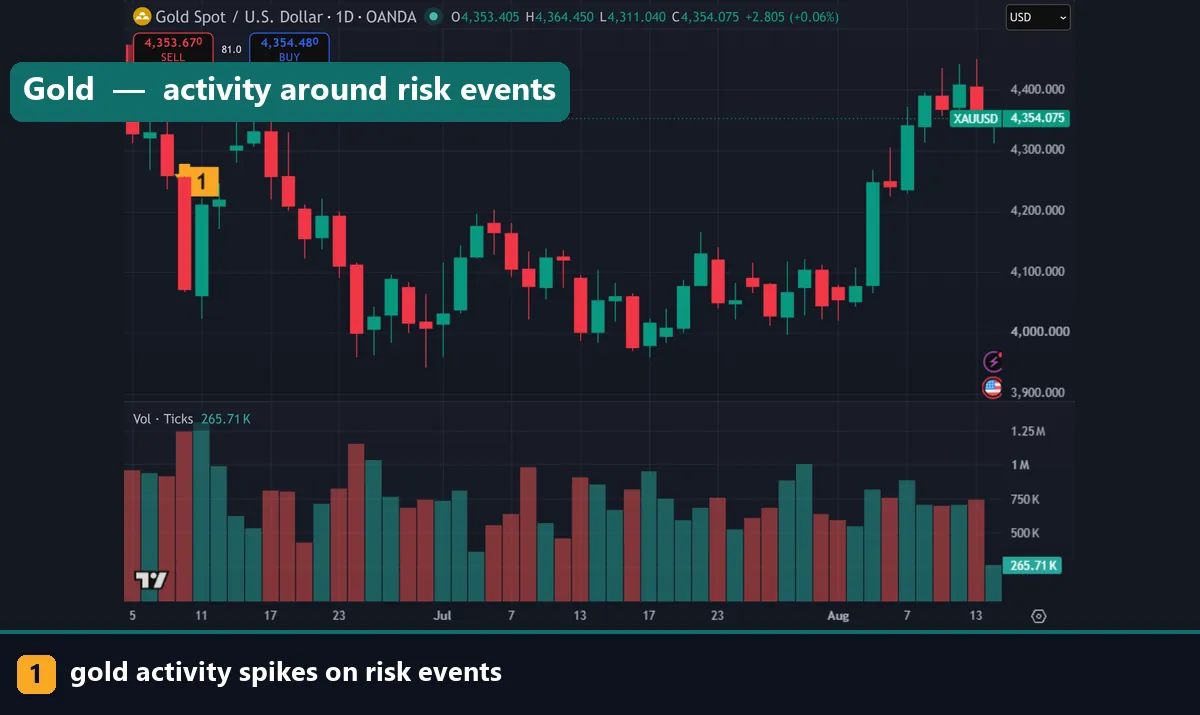
Traders who want genuine volume have one clean option: currency futures on the CME.
Those are exchange-traded contracts with a central clearing house, so reported volume is real and consolidated. The 6E contract tracks the euro against the dollar, 6B the pound, 6J the yen.
Because the same participants trade both markets, futures volume is a reasonable proxy for spot activity in the same currency. Traders who care about volume analysis often chart the futures contract alongside their spot pair.
The catch is the schedule. Futures follow exchange hours with a daily break, so the twenty-four-hour continuity of spot forex is lost, and contracts expire quarterly.
For most retail purposes tick volume is adequate. If your method genuinely depends on volume, the futures chart is worth the extra step.
Common mistakes
Four repeat. Treating tick volume as traded volume tops the list, since it counts quote updates rather than contracts. Comparing volume across brokers comes second, because each feed produces different counts. Third, traders read a tall bar as bullish when it only signals activity. Fourth, they apply volume rules built for stock markets, where the data means something quite different.
Where to go next
Volume is a timing input more than a signal. Read our forex trading sessions guide for when the market is active, then bid ask spread calculation for how activity affects your costs. For the pairs that stay liquid throughout, see the most traded pairs, and volume indicators for MT4 covers the tools. For further reading, the Triennial Survey at the BIS is the source of the headline figure, and Investopedia explains what a tick is at Investopedia.
FAQ
What is the daily trading volume in forex?
The BIS Triennial Survey put average daily turnover near 7.5 trillion dollars in 2022. That total includes spot, forwards, swaps and options, with swaps making up the largest share.
Is the volume on my MT4 chart real?
No. It is tick volume, meaning the count of price updates in each bar. Forex has no central exchange, so consolidated traded volume does not exist for your platform to show.
Why does volume differ between brokers?
Each broker aggregates a different set of liquidity providers, so their feeds update at different rates. Comparing tick volume across platforms tells you about the feeds, not the market.
When is forex volume highest?
During the London and New York overlap, roughly 13:00 to 16:00 UK time. Activity falls to its lowest between the New York close and the Tokyo open.
Can I get real forex volume anywhere?
Currency futures on the CME report genuine exchange volume. The 6E, 6B and 6J contracts track the euro, pound and yen against the dollar.
Does high volume mean price will rise?
No. Volume measures activity, not direction, because every trade has a buyer and a seller. Trading involves risk, results are not guaranteed, and past performance is not indicative of future results.

About the author
Written by Dominic Walsh, a Forex trader and MT4/MT5 indicator, Expert Advisor and script developer. Every tool on forexmt4systems.com is tested on live charts before release and ships with ready-to-use compiled MT4 (.ex4) and MT5 (.ex5) files. Learn more about the trader and developer behind this site.
How we build, test and correct every tool: Editorial & Testing Policy. Trading carries risk; see the disclaimer.