
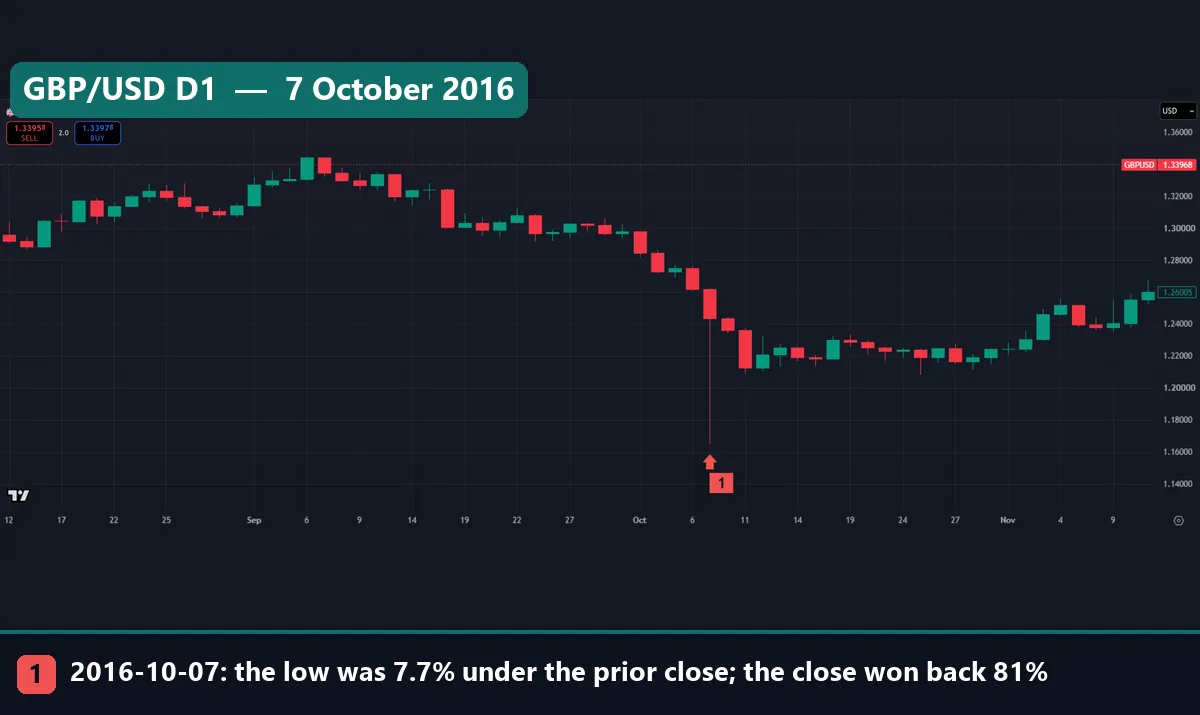
A flash crash is a price fall that is very fast, very deep and mostly undone soon after. This guide settles three things with our own data: how to measure one on a daily chart, how rare it is, and what it does to a stop order. Take GBP/USD on 7 October 2016. The low sat 7.66% under the prior close, yet the day closed only 1.42% lower. A fixed rule found 13 events like that in 48,566 market-days across seven markets. They cluster, they differ by data feed, and the recovery did not always last.
What is a flash crash?
Two official reports give the clearest description. The CFTC and SEC staff findings on the market events of 6 May 2010 describe “an extraordinarily rapid decline and recovery”. That afternoon, major US stock indices had already lost over 4% on the day. Then they fell a further 5 to 6% in minutes, before rebounding almost as quickly. They closed about 3% lower.
The BIS Markets Committee report on the sterling flash event of 7 October 2016 adds the shape: a fast and very large V-shaped move that news or data cannot fully explain. Such events have mostly hit fast electronic markets, such as FX, government bonds and stocks. Many happen in quiet hours, when liquidity is thinnest.
So three features define the event: speed, depth and a recovery. The mirror image is a spike up that reverses, and the BIS report compares sterling with the so-called flash rally in US Treasuries in October 2014. We found no fixed threshold in either report, so any count needs a rule of its own.
How a flash crash happens
The BIS report splits the sterling event into three stages. First came an orderly fall from 1.26 to about 1.24 on heavy selling. Next came a few minutes of extreme dysfunction, when sterling fell further, rebounded and traded in a wide range. Last, liquidity came back slowly over the following hours.
The setting mattered as much as the selling. On Thomson Reuters Matching, sterling fell from 1.2600 to 1.2494 in about eight seconds. At 00:07:15 BST the CME’s velocity logic paused futures trading for 10 seconds. Soon after, the futures price hit its lower limit for the day. The report also names option hedging and stop-loss orders as amplifiers. Our guide to liquidity in trading explains why a thin order book moves further on the same flow.
On a daily chart, all of this leaves one long wick, so we measure three numbers.
fall (%)      = (low / previous close - 1) x 100
fall (ATR)    = (previous close - low) / ATR(14) of the previous day
won back (%)  = (close - low) / (previous close - low) x 100
For a spike up, swap the low for the high. ATR is the average true range, a yardstick for a normal day’s movement. TradingView’s Average True Range help page gives the formula, and our ATR explainer shows how traders use it. Because we measure the fall in ATR, a quiet pair and a wild one become comparable.
How we tested
We pulled daily bars from the TradingView web chart on 6 November 2026. The FX pairs and gold come from OANDA. EUR/USD, GBP/USD, USD/JPY and EUR/CHF start on 6 May 2002. AUD/JPY starts on 31 May 2004, and gold on 27 October 1994. The S&P 500 is the SP:SPX index, used from 1990. Bars dated 6 November were still forming, so every window ends on 5 November 2026.
Then we ran a second pass on MetaTrader 4, build 1471, using Capital Point Trading’s daily history on 23 FX pairs. Dates vary by pair. Six crosses start in June or July 2018 and eight on 19 November 2019. The six USD pairs and EUR/GBP start on 19 May 2020, and AUD/CAD and NZD/CAD in June 2025. Most windows end on 28 May 2026. The latest ends on 24 August 2026: the terminal has been offline since late August 2026, so no window runs later.
Each OANDA daily bar in our data opens at 17:00 New York time. So a fall in the New York evening, early in Asian hours, lands in the bar dated the next day. Also, these are price measurements, not trades, with no spread, swap, financing or commission in them. Our method is in the editorial testing policy.
The settings of our flash crash rule
Every threshold below is our choice, not a market standard. Change one and the count changes.
| Parameter | TradingView pass | MT4 pass |
|---|---|---|
| Bars | Daily, OANDA FX and gold, SP:SPX | Daily, Capital Point Trading |
| Markets | EUR/USD, GBP/USD, USD/JPY, AUD/JPY, EUR/CHF, gold, S&P 500 | 23 FX pairs |
| Depth | Previous close to the day’s low (or high) | Same |
| Yardstick | ATR(14) of the previous day | Same |
| Minimum depth | 4 ATR | 4.0 ATR |
| Minimum price move | 2% | None |
| Minimum won back by the close | 50% | 50% |
| Direction | Falls, plus the mirror rule for spikes up | Both |
| Result | 13 events in 48,566 market-days | 14 events in 37,748 pair-days |
Reading a flash crash on a daily chart
Look for three things on one bar: a long lower wick, a close far above the low, and ordinary bars on either side. Our note on candlestick wicks covers how to read that tail.
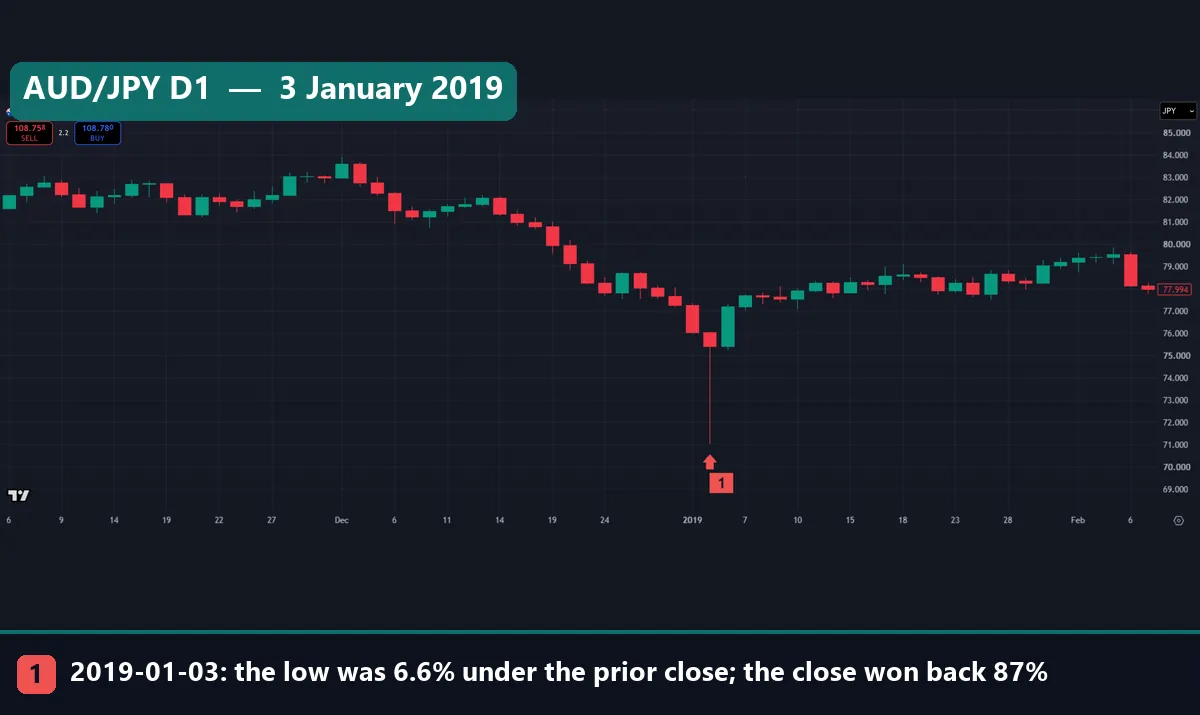
AUD/JPY on 3 January 2019 is the cleanest case on our charts. The pair closed at 76.06 the day before. Its low reached 71.032, which is 6.61% down and 5.4 ATR. Yet the close came back to 75.415, so 87% of the fall was gone by the end of the day. The next bar closed at 77.213, above the old close. USD/JPY fell 3.73% at the low that day and won back 70%. In both pairs the yen was the side that rose, as our guide to safe-haven currencies discusses.
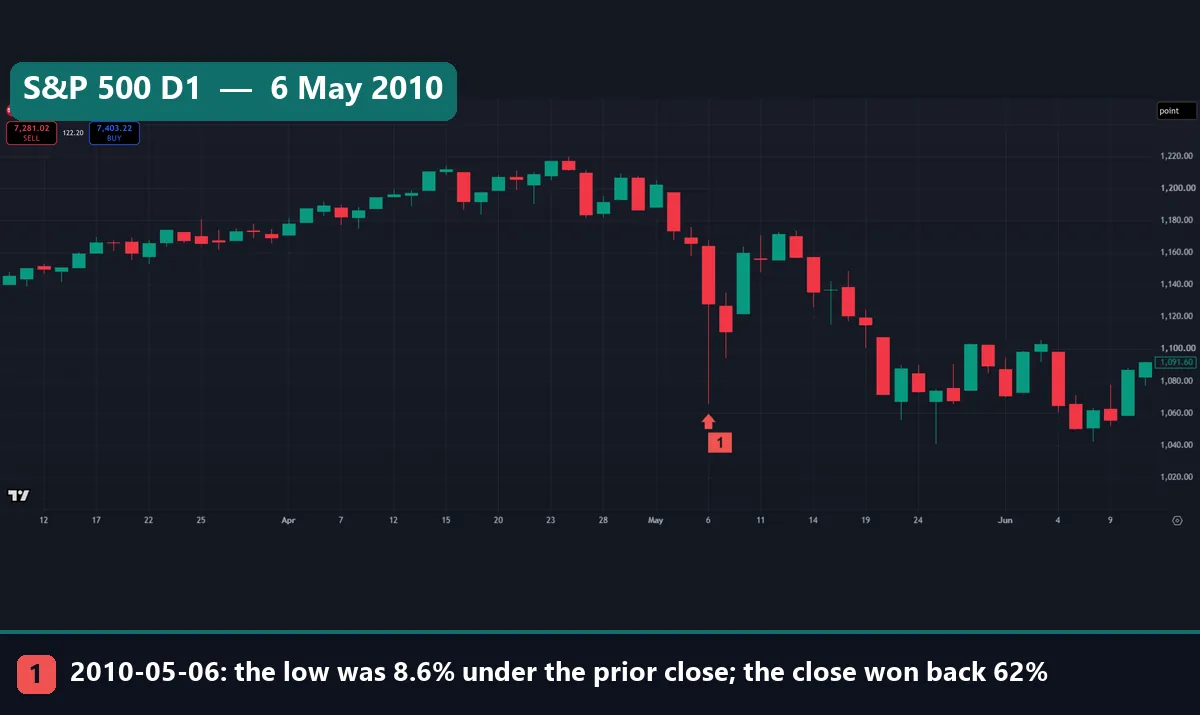
The S&P 500 on 6 May 2010 shows the same shape with a different ending. The index closed at 1,165.87 the day before, touched 1,065.79 and closed at 1,128.15. That is 8.58% down at the low and 3.24% at the close, so 62% came back. But look further right. On 25 May 2010 the index traded at 1,040.78, under the flash low. So the wick marked a fast extreme, not a floor.
Worked example: GBP/USD on 7 October 2016
Take the marked bar in the first chart. OANDA’s daily bar reads: previous close 1.261565, high 1.26231, low 1.16496 and close 1.24361.
- Fall: 1.261565 – 1.16496 = 0.096605, or about 966 pips.
- Fall in percent: 0.096605 / 1.261565 = 7.66%.
- Fall in ATR: 8.9 times the ATR(14) of the day before, the largest in our TradingView pass.
- Won back: 1.24361 – 1.16496 = 0.07865, or 786.5 pips. That is 81% of the fall.
- Close against the prior close: down 1.42%.
The high sat only 0.06% above the prior close, so almost the whole bar is the fall and the climb back. The BIS puts the move at about 00:07 BST on 7 October, which is 19:07 in New York the evening before. So the event sits about two hours into OANDA’s 7 October bar.
The rebound did not end the slide, though. The pound closed at 1.21244 on 11 October, well under the flash day’s close. For the longer story, see our guide to whether the pound is stronger than the dollar.
Nine famous days, measured the same way
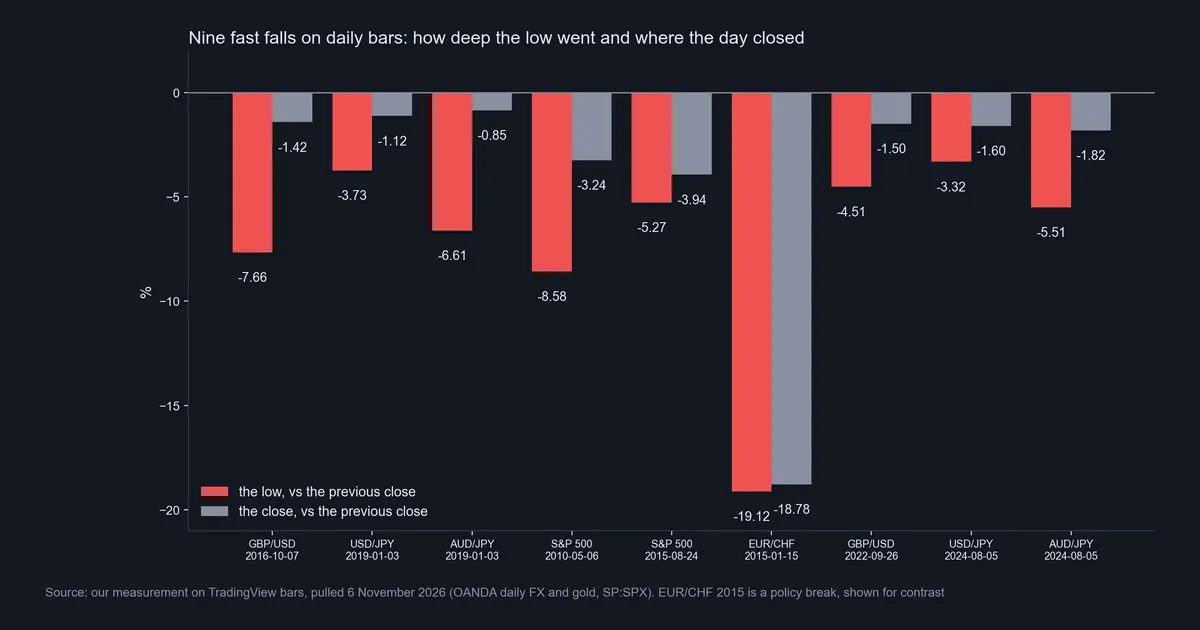
This chart sets nine famous fast falls side by side. The red bar is the low against the previous close, and the grey bar is the close. In a flash crash the grey bar looks short next to the red one.
Most days fit. GBP/USD in 2016, the yen pairs in 2019 and the S&P 500 in 2010 won back 62% to 87% by the close. On 26 September 2022, GBP/USD fell 4.51% at the low and won back 67%. On 5 August 2024, USD/JPY fell 3.32% and won back 52%, while AUD/JPY fell 5.51% and won back 67%. Our note on a carry trade unwind covers what happens when crowded positions close together.
Two days break the pattern. On 24 August 2015 the S&P 500 fell 5.27% at the low and closed 3.94% down, so only 25% came back. The BIS report links that day partly to technical issues around the opening of the cash market. EUR/CHF in January 2015 is the other exception, covered below.
How rare is a flash crash? Our rule found 13
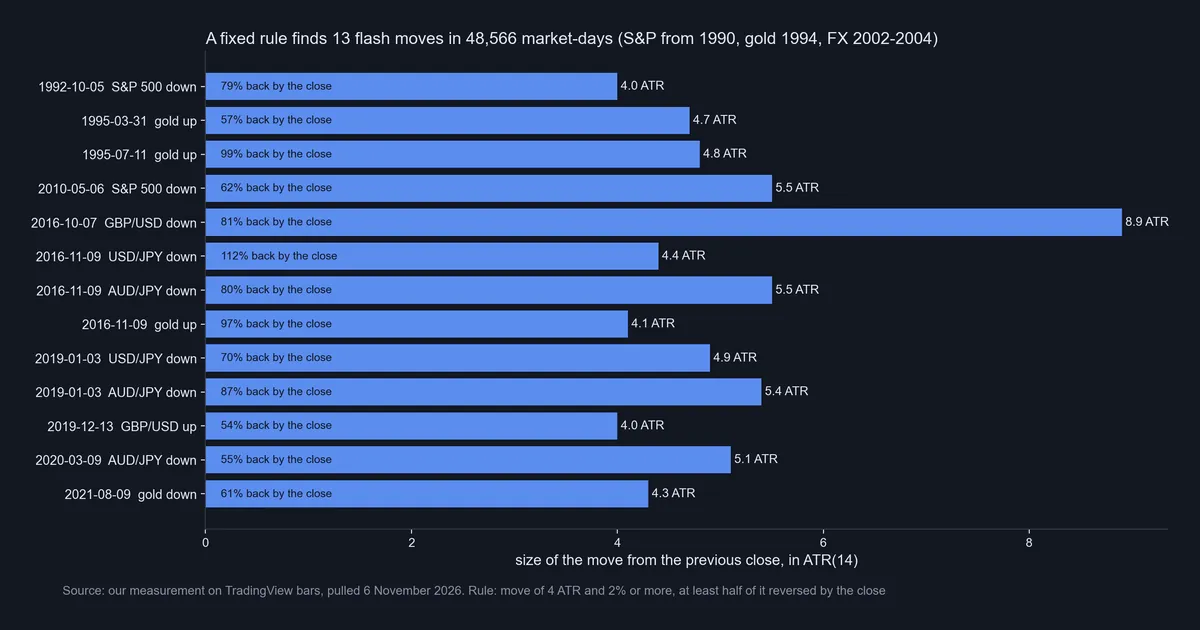
Our TradingView pass found 13 events in 48,566 market-days, about one in 3,700. Nine were falls and four were spikes up. Five came on yen pairs. EUR/USD produced none from May 2002 to November 2026, and neither did EUR/CHF.
The events also cluster. Three fell on one day, 9 November 2016: USD/JPY, AUD/JPY and gold. The MT4 pass shows this more strongly. It found 14 events in 37,748 pair-days, about 3.7 per 10,000, yet 13 of them fell on just three days. Seven pairs qualified on 9 March 2020. Three did on 3 January 2019, led by AUD/JPY at 7.52% down with 89% won back. Then three pound crosses did on 26 September 2022. The only other case was CHF/JPY on 30 April 2026. So “one in 3,700” is an average, not a clock.
Download the complete indicator database
Put these concepts on your charts. One email unlocks the full library of 1,380+ indicators with compiled MT4 and MT5 files, plus my TradingView scripts. No paywall, no spam, unsubscribe any time.
Get free access to my indicator database
One email unlocks 1,380+ free MT4, MT5 and TradingView indicators — the complete library. No single-tool download; you get the whole database.
Where it fails
Here are the plain limits.
- No speed. A daily bar shows how far price went and how much came back. It cannot show whether the fall took 40 seconds or eight hours.
- Feed dependent. OANDA’s GBP/USD low on 7 October 2016 is 1.16496. The BIS report cites trades as low as 1.1491 on Reuters, and says other platforms printed lower still. Our MT4 feed puts the AUD/JPY low of 3 January 2019 at 7.52% down, against 6.61% on OANDA.
- Arbitrary lines. GBP/USD on 26 September 2022 fell 3.2 ATR, and USD/JPY on 5 August 2024 fell 2.3 ATR. Both miss our 4 ATR line, though both won back over half by the close.
- A broken yardstick. EUR/CHF sat at 1.20 for weeks, so its ATR was tiny. Its 2015 fall measures 287.6 ATR, which says more about the yardstick than the move.
- Small sample. Thirteen events cannot give a reliable yearly rate, and they say nothing about the next one.
- Few markets. We tested seven markets on TradingView and 23 pairs on MT4, with no single stocks, crypto or intraday bars.
Two charts that test the label
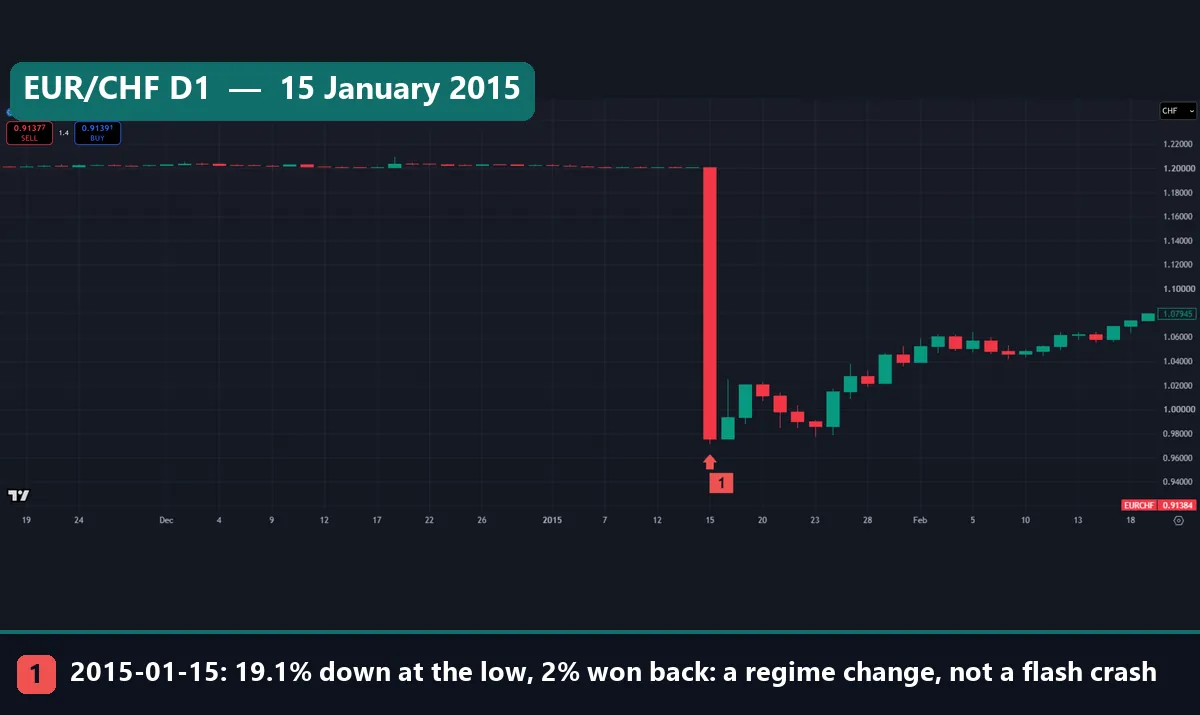
EUR/CHF on 15 January 2015 fell further than any day here, yet it is not a flash crash. That day the Swiss National Bank’s press release said it was discontinuing the minimum exchange rate of CHF 1.20 per euro. On OANDA the pair closed at 1.200965 the day before, touched 0.9714 and closed at 0.97543. That is 19.12% down at the low and 18.78% at the close, with 2% won back. On 19 February, the last bar on the chart, it closed at 1.07945, still about 10% under the old floor. The BIS report agrees that the franc move had a clear driver.
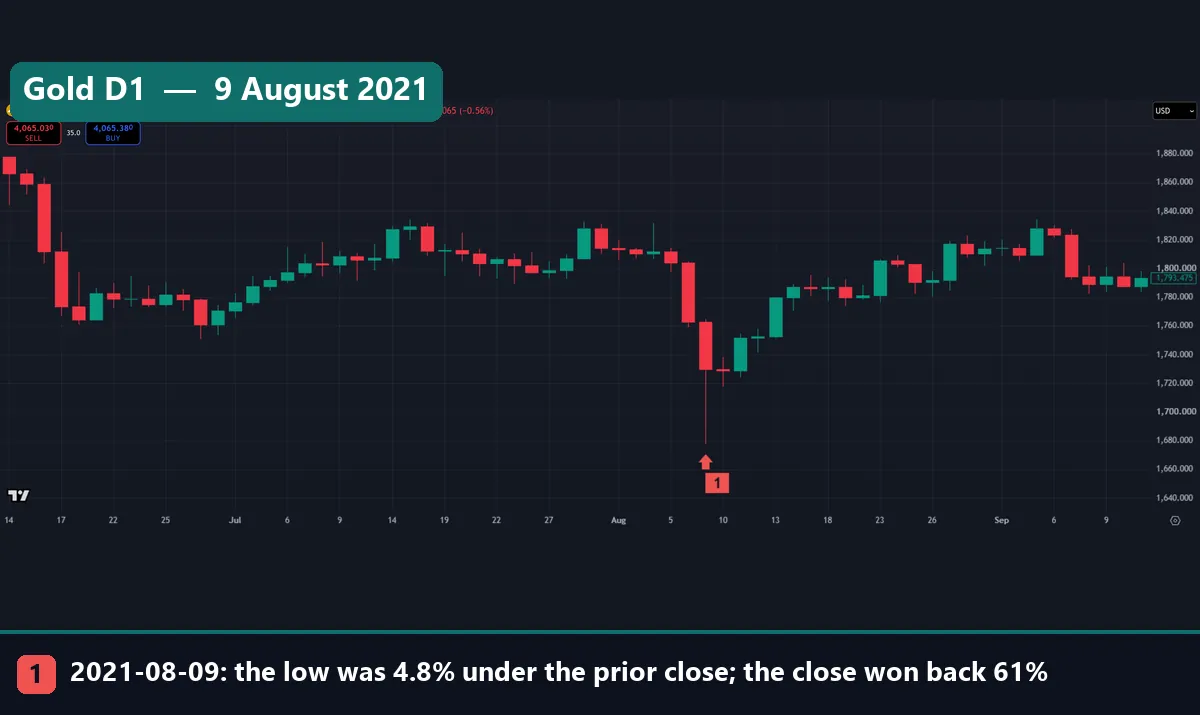
Gold on 9 August 2021 passed our rule. It closed at 1,763.085 the day before, touched 1,677.686 and closed at 1,729.675: 4.84% down at the low, 4.3 ATR, with 61% won back. Note the large red bar before it, when gold dropped from about 1,804 to 1,763 on 6 August. In the weeks after, the low held and gold traded above 1,830 by early September. That is the opposite of the S&P 500 in 2010, so a recovery on the day tells you little about the weeks after.
What a flash crash does to stop orders
A stop order waits for price to touch a level. Once triggered, it becomes an order to deal at the next price available. In a flash crash that price can sit far away, because the book is thin. The gap between the stop level and the fill is slippage. Our guides to the stop order and to slippage in trading cover the mechanics.
Spreads also widen as liquidity providers step back, as our note on why spreads widen explains. A limit order acts differently: it fills only at its price or better, so it may not fill at all. On a leveraged account, a fall of several ATR can also trigger a margin stop-out. Then the recovery by the close does not help, because the broker already closed the position near the low.
Common mistakes with a flash crash
- Quoting the low as a price you could trade. Each feed prints its own low: OANDA shows 1.16496 for 7 October 2016, while Reuters traded at 1.1491.
- Calling every big fall a flash crash. The S&P 500 on 24 August 2015 won back 25%, and EUR/CHF in 2015 won back 2%.
- Reading the rebound as the all-clear. GBP/USD closed lower within days, and the S&P 500 broke its flash low within three weeks.
- Trusting a stop to cap the loss. A stop sets a trigger, not a fill price. Plan your position size so a fill far past the stop still fits your risk.
Where to go next
For spikes with a clear cause, read our guide to the forex news spike. For the hours when books often run thin, see the Asian trading session. Then read the four sources linked above: the CFTC and SEC findings, the BIS report, the SNB release and TradingView’s ATR page.
FAQ: flash crash questions
What is a flash crash in simple terms?
It is a very fast, very deep fall that largely reverses soon after. On a daily chart it shows as a long lower wick, with the close well above the low.
What caused the flash crash of 6 May 2010?
The CFTC and SEC staff point to a sell program of 75,000 E-Mini futures, worth about $4.1 billion, started at 2:32 p.m. on a turbulent day. Its algorithm targeted 9% of recent volume, without regard to price or time.
How often does a flash crash happen?
Our rule found 13 events in 48,566 market-days, about one in 3,700. But they cluster: on MT4, 13 of 14 events fell on three days.
Which currency pairs see flash crashes most?
In our data, yen pairs gave 5 of our 13 TradingView events. EUR/USD gave none from May 2002 to November 2026.
Was the Swiss franc move of January 2015 a flash crash?
Not by our rule. EUR/CHF fell 19.12% at the low but won back only 2%, after the SNB dropped its 1.20 minimum rate. That set a new level rather than a V shape.
Can a stop-loss protect me in a flash crash?
It will trigger, but the fill can land far past the stop when the book is thin. So plan for slippage before you set the size.
Why do brokers show different lows for the same day?
The BIS notes that most FX trading is over the counter and lacks a consolidated tape. So each feed prints its own low.
Can you predict or trade a flash crash?
We cannot. Thirteen events in decades is too few to model. Our figures describe the past only, so results are not guaranteed; past performance is not indicative of future results.
Last updated: 6 November 2026.

About the author
Written by Dominic Walsh, a Forex trader and MT4/MT5 indicator, Expert Advisor and script developer. Every tool on forexmt4systems.com is tested on live charts before release and ships with ready-to-use compiled MT4 (.ex4) and MT5 (.ex5) files. Learn more about the trader and developer behind this site.
How we build, test and correct every tool: Editorial & Testing Policy. Trading carries risk; see the disclaimer.