
Liquidity in trading has two meanings, and most confusion comes from mixing them up. The first is market liquidity: how easily you can trade size without moving the price. The second comes from ICT and smart money traders: the stop and entry orders that rest above old highs and below old lows. This guide explains both, shows the second on real charts, and tests one popular claim against 14 months of our own MT4 data. The short answer: price takes out the previous day’s high or low on roughly half of all days, so a sweep on its own tells you very little.
What liquidity in trading means
In plain finance, a liquid market is one where you can trade quickly at a fair price. Many buyers and sellers are present. So the gap between bid and ask stays small, and a normal order fills without a jump. The liquidity entry at Investopedia gives the textbook version.
ICT traders use the word in a narrower way. To them, liquidity is a cluster of orders at a known price. Stops from short sellers rest above a swing high. Stops from buyers rest below a swing low. Breakout traders also park buy stops above highs and sell stops below lows.
Both meanings look at the same fact: every trade needs someone on the other side. Market liquidity asks how much of that other side exists now. The ICT meaning asks where a large block of it will sit next. For the spread side, see our guide to market liquidity and how it shows up in spreads. This page is the broad parent. It links to deeper reads instead of repeating them.
Market liquidity: spreads, depth and size
Three things tell you how liquid a market is. First, the spread, the cost of crossing from bid to ask. Second, depth, the volume waiting near the market. Third, impact, how far price moves when a large order hits.
Spot FX is the deepest market there is, as the BIS Triennial Survey of foreign exchange markets for 2025 documents. Still, liquidity is not even. It thins between the New York close and the Tokyo open, and around big news. That is why spreads widen at those times.
You can see the spread on our charts. At capture time, the TradingView order panel showed 1.6 and then 1.5 pips on EURUSD, 2.0 and 2.1 on GBPUSD, and 54.0 points on gold. Those are single live OANDA quotes, not averages. But they show the order: the euro pair costs least to cross, and gold costs most.
Depth is harder to see. MetaTrader 4 shows no order book at all. MetaTrader 5 has a Depth of Market window, and the MarketBookGet function in the MQL5 reference reads it from code. However, it shows only what your broker feeds it. Our page on slippage in trading covers the cost side.
Resting orders: liquidity in the ICT sense
Now picture yesterday’s high. Some traders sold near it with stops just above. Others want to buy a breakout, so they set buy stops there too. All of those orders turn into market buys once price trades through the level.
ICT calls orders above highs buy-side liquidity, and orders below lows sell-side liquidity. The theory says a large player who wants to sell in size needs buyers. So that player may push price into the buy stops, sell against them, and let price fall. The move through the level and back is a sweep, or raid.
The core is sound. Stops do cluster at obvious levels, and a run of stop orders can stretch a move by a few pips. The leap comes after that: many traders treat every sweep as proof of a planned reversal. Our data says that leap is not safe.
For detail, read our guides to buy-side and sell-side liquidity and the difference between a liquidity grab and a sweep. The internal and external range liquidity page explains which pools sit inside a range and which sit at its edges.
How we tested
We wanted two numbers. How often does price take out the previous day’s high or low? And when it does, how often does the day close back on the other side?
First, we read the 15-minute history from the site owner’s terminal: Capital Point Trading, MetaTrader 4, build 1471. The M15 data covers 14 symbols between June 2025 and August 2026. Each symbol has its own window. For example, EURUSD runs from 1 July 2025 to 26 August 2026.
Next, we grouped bars into server days. This server runs at UTC+3 in summer and UTC+2 in winter. We skipped days with fewer than 40 M15 bars, so holidays drop out. Then we compared each day’s range with the day before.
Finally, we drew the charts on the TradingView web chart with the OANDA feed on 1 October 2026. They cover 29 September to 1 October 2026 on M15, plus one EURUSD H1 view. Note that the TradingView charts use UTC days, while the MT4 statistics use server days. So chart levels will not match the MT4 day boundaries exactly. Our method sits in the editorial testing policy.
Settings and parameters of our sweep test
There is no official rule for a sweep. These are our choices, so you can check or change them.
| Parameter | Our choice | Why it matters |
|---|---|---|
| Reference level | Previous day’s high and low | The most common pool in ICT teaching. Weekly levels would give other numbers. |
| Day boundary | MT4 server day (UTC+2 or UTC+3) | A UTC or New York day cuts the range elsewhere, so the levels move. |
| Timeframe | M15 | Fine enough to see when the level broke. |
| Sweep | Any trade beyond the level, even one point | A stricter rule, such as five pips through, counts fewer sweeps. |
| Close back inside | Day’s final M15 close on the other side | Measures the end of the day only, not the path. |
| Minimum day size | 40 M15 bars | Drops partial days. |
Each choice changes the result. So treat our numbers as one honest measurement, not a law.
Reading liquidity in trading on a chart
Start with levels the crowd can see. Our charts mark the previous day’s high with a red dashed line and its low with a green one.
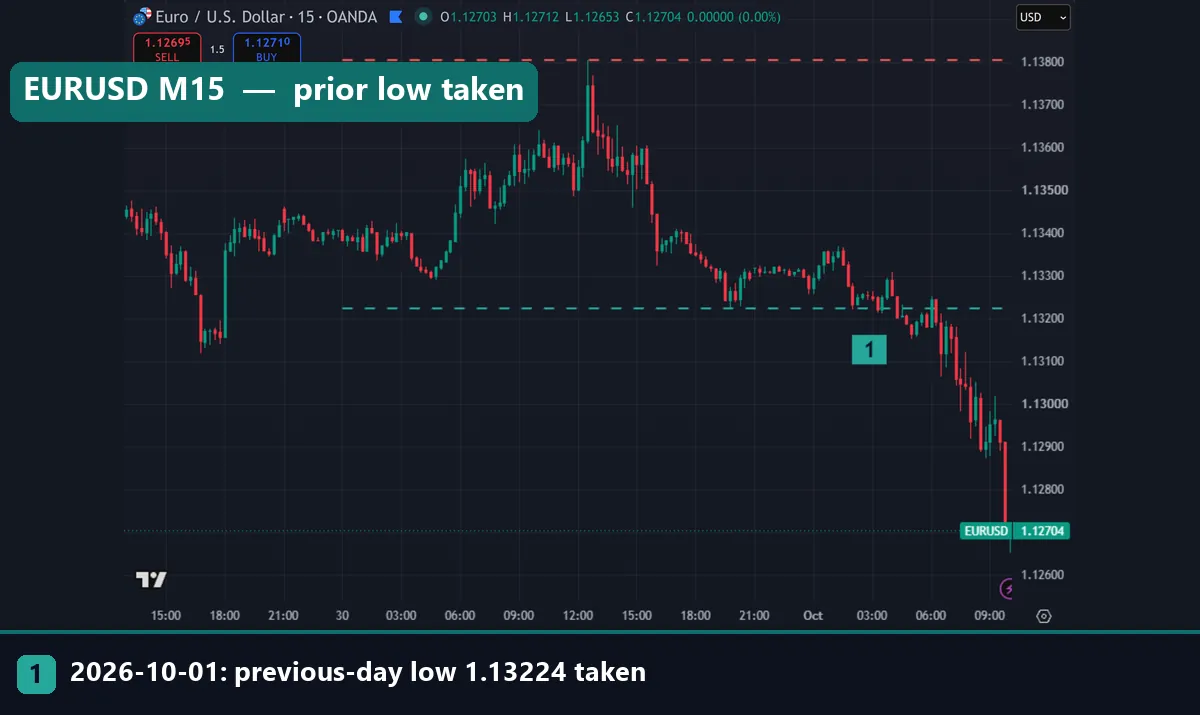
This EURUSD chart covers 1 October 2026. The red line is the 30 September high at 1.13804, and the green line is the 30 September low at 1.13224. Marker 1 sits on the bar that took the low, at 02:00 UTC. Price did not snap back. Instead, it hovered near the line for a few hours and then fell hard in the London morning.
Next, look for clusters. Equal highs and equal lows draw more stops than one swing, because more traders see the same line. Our guide on how to find liquidity on a chart walks through each kind.
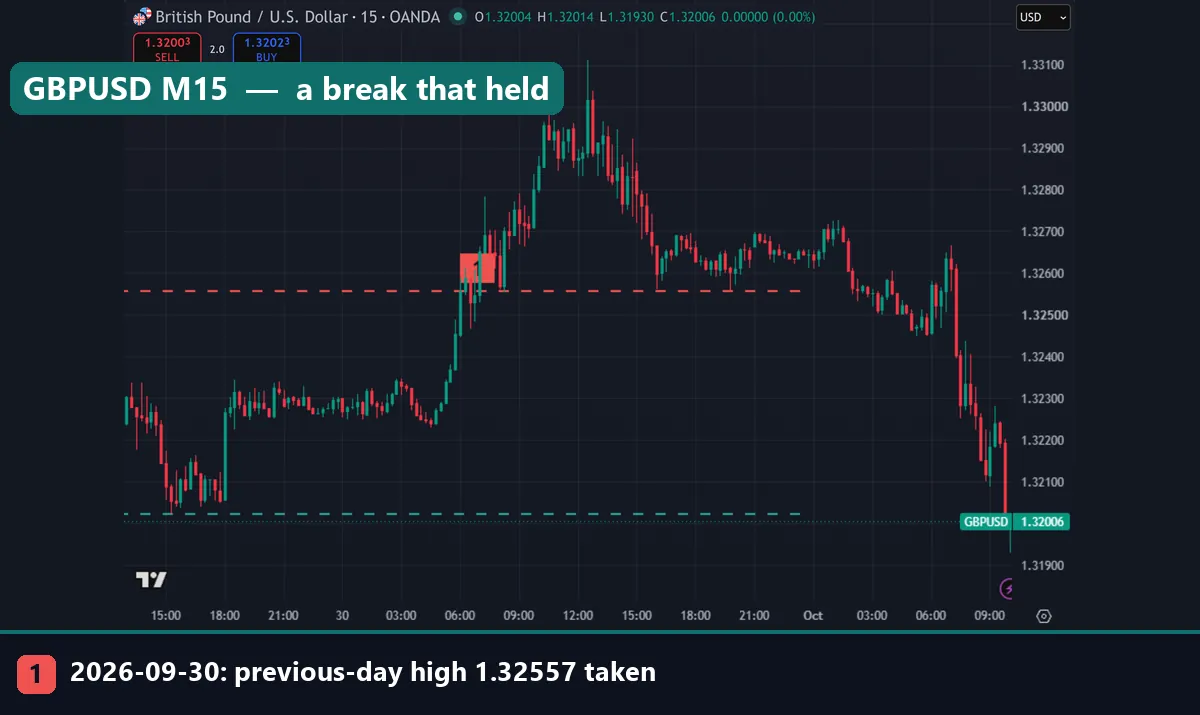
The GBPUSD chart shows the opposite reaction. The red line is the 29 September high at 1.32557, and marker 1 is the bar that broke it at 06:00 UTC on 30 September. Price then climbed for hours. It dipped back to the line in the afternoon, but the day closed above it. So the same event led to a fall on one chart and a rally on the other.
What our MT4 data says about prior-day sweeps
Here are the seven symbols with the largest samples. “High taken” means the day traded above the previous high. “Closed back” is the share of those days that closed below that high again. The low columns mirror this.
| Symbol | Days | High taken | Low taken | Both taken | High taken, closed back | Low taken, closed back |
|---|---|---|---|---|---|---|
| EURUSD | 297 | 45.5% | 52.2% | 13.1% | 51.9% | 51.6% |
| GBPUSD | 232 | 47.0% | 50.4% | 14.2% | 53.2% | 60.7% |
| USDCAD | 269 | 55.4% | 46.5% | 13.4% | 46.3% | 56.0% |
| USDCHF | 288 | 52.1% | 46.5% | 14.6% | 46.7% | 57.5% |
| XAUUSD | 269 | 53.9% | 43.1% | 10.8% | 47.6% | 47.4% |
| NZDCAD | 295 | 47.5% | 52.2% | 12.2% | 56.4% | 61.0% |
| AUDCAD | 318 | 50.9% | 47.5% | 12.3% | 43.2% | 62.3% |
First, a prior-day level gets taken on roughly half of all days, on every symbol. So a sweep is a normal event, not a rare signal. Second, both sides go on the same day only about one day in eight.
Third, the close-back rate sits near a coin flip. On EURUSD it is 51.9% after a high sweep and 51.6% after a low sweep. AUDCAD leans to 62.3% after a low sweep, but only 43.2% after a high sweep. That mix looks more like noise than an edge.
Small samples prove even less. EURJPY had only 21 usable days, and AUDJPY had 29. A few days either way can move those figures by ten points.
Worked example: three sweeps on 30 September 2026
Here is one day, read the ICT way, with the outcome next to it. Levels come from the OANDA feed on TradingView, using UTC days.
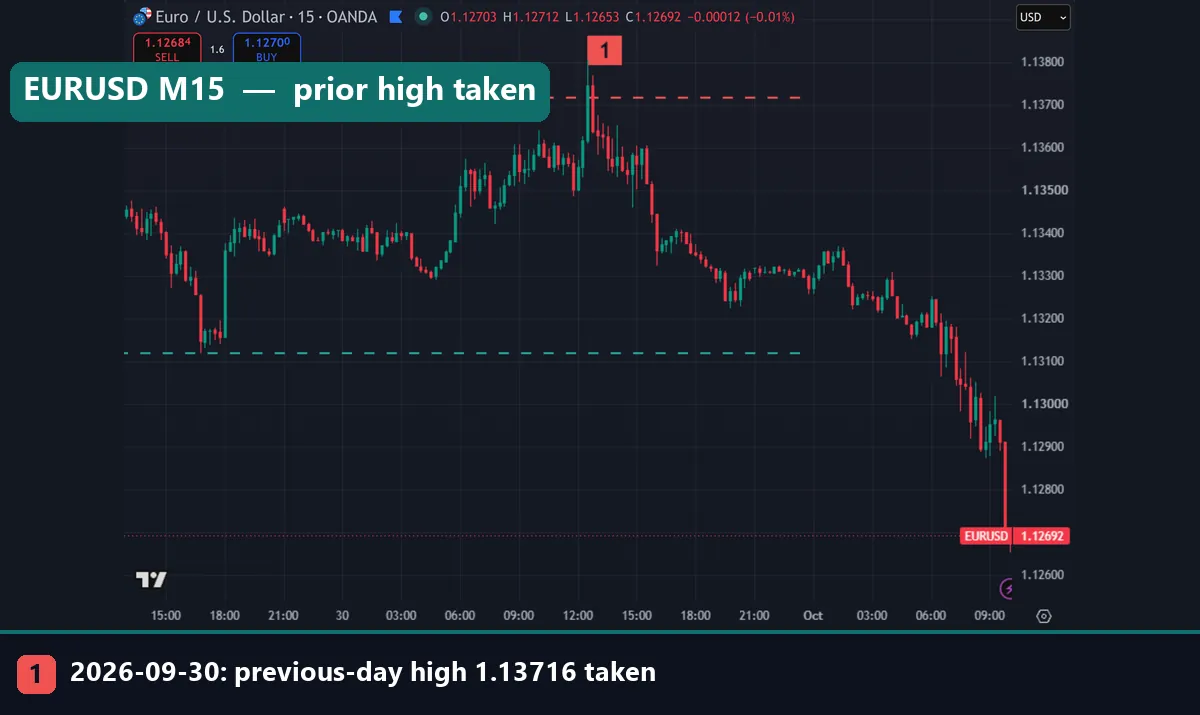
- EURUSD. The 29 September high was 1.13716. Price traded through it at 12:30 UTC and reached 1.13804, 8.8 pips beyond. The day closed at 1.13270, 44.6 pips back below. That is the textbook sweep, shown in our first image.
- GBPUSD. The 29 September high was 1.32557. Price broke it at 06:00 UTC and reached 1.33111, 55.4 pips beyond. The day closed at 1.32645, still 8.8 pips above. So this was a breakout, not a reversal.
- XAUUSD. The 29 September high was 4187.68. Gold traded above it at 06:45 UTC and later reached 4219.415, about 31.7 dollars beyond. The day closed at 4156.09, about 31.6 dollars back below.
So the same event gave two closes back inside and one clean breakout. Two out of three looks good. Yet a year of MT4 data puts the EURUSD split close to even. Three charts illustrate the idea; they do not prove it.
The day after: two more sweeps
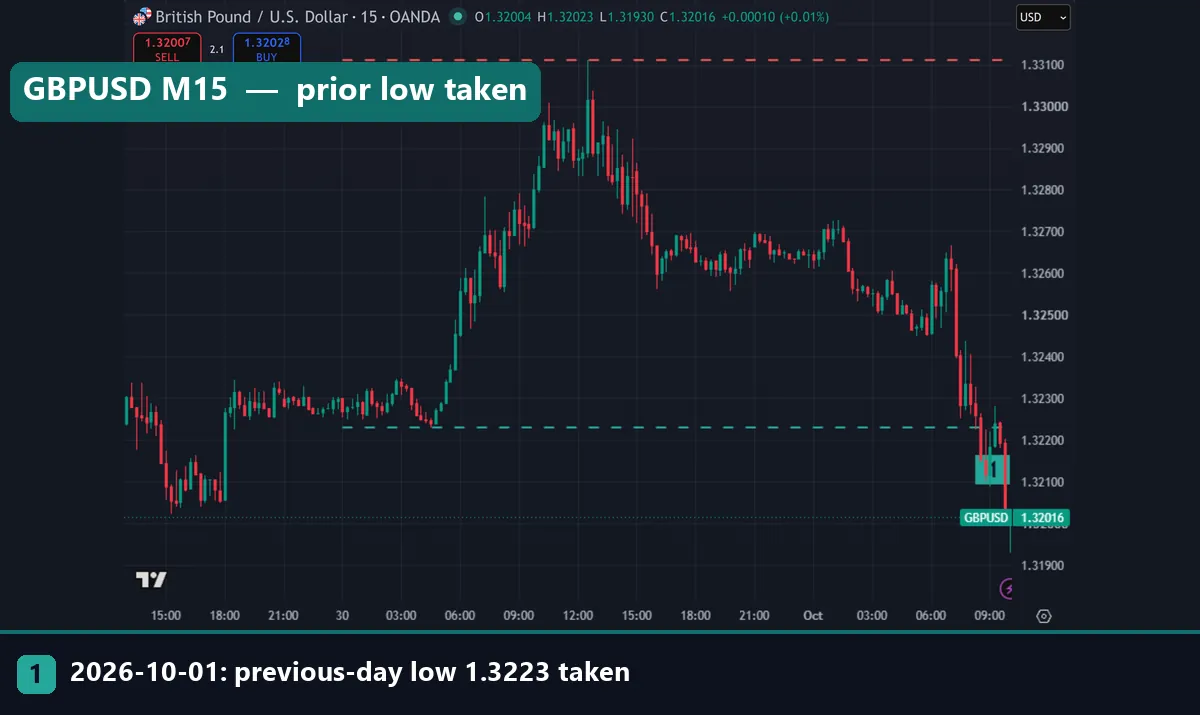
On GBPUSD, price took the 30 September low of 1.3223 at 08:15 UTC on 1 October, as marker 1 shows. Then it kept falling. At 09:45 UTC, the last bar we pulled, it stood at 1.3215, still below the line.
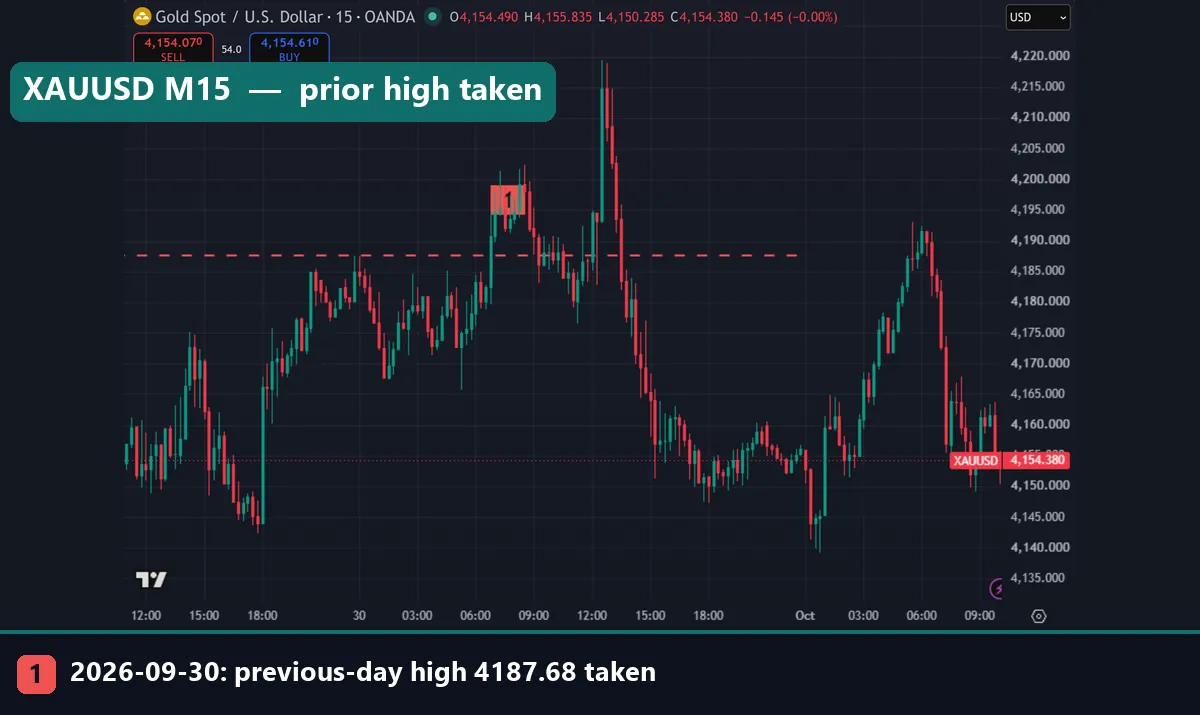
The gold chart shows the 30 September high sweep from the example. The red line is 4187.68. Price pushed through it in the morning, fell back, and then made a larger spike around midday before the sell-off.
Download the complete indicator database
Put these concepts on your charts. One email unlocks the full library of 1,380+ indicators with compiled MT4 and MT5 files, plus my TradingView scripts. No paywall, no spam, unsubscribe any time.
Get free access to my indicator database
One email unlocks 1,380+ free MT4, MT5 and TradingView indicators — the complete library. No single-tool download; you get the whole database.
Where it fails
- Sweeps are too common. If a level breaks on half of all days, a break alone cannot separate a trap from a trend.
- The close-back rate is near 50%. On EURUSD, a sweep of either side reversed by the close about half the time.
- The day boundary moves the level. A UTC day, a New York day and a server day each give a different previous high.
- Nobody can see the stops. Retail charts show no stop orders. Pools are an inference, not a measurement.
- Hindsight makes it look easy. After the fact, every reversal looks like a planned raid. Before it, you cannot tell.
Also, our test ignores spread and slippage, and both are worst at these levels. In short, a sweep is context, not a trigger. Our page on stop hunting in forex looks at the same problem from the stop owner’s side.
Zooming out: the same levels on other charts
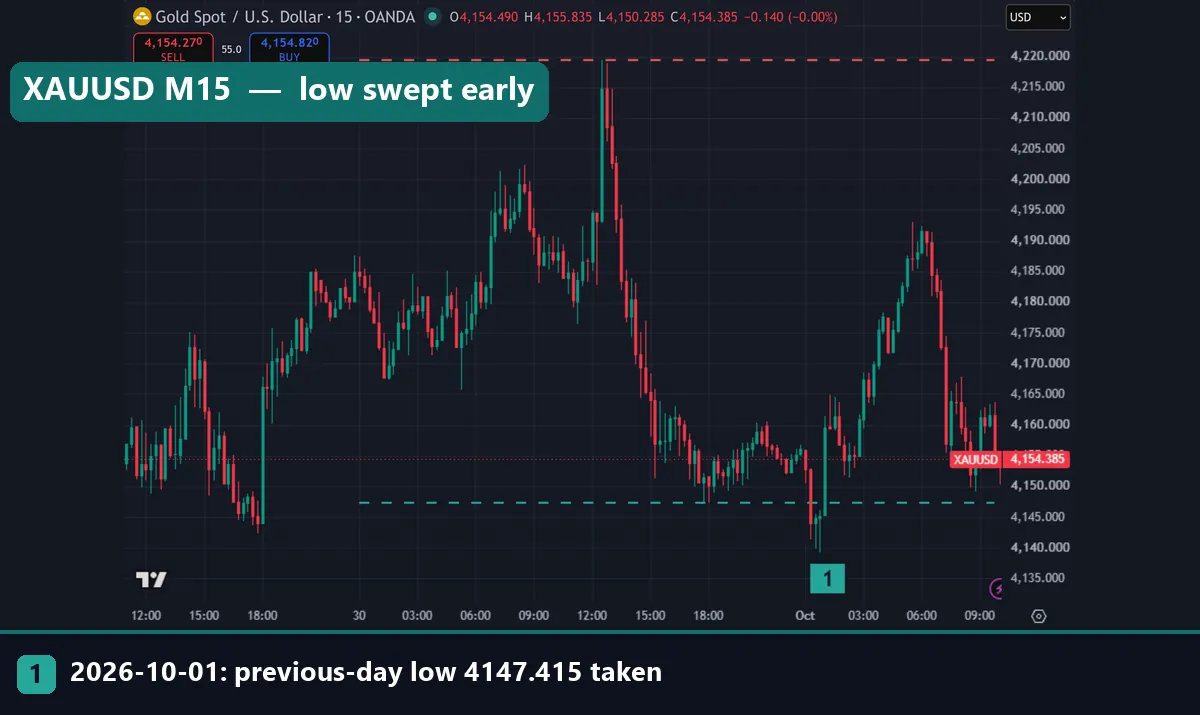
Gold on 1 October shows a low sweep that did snap back. The green line is the 30 September low at 4147.415. Price traded under it at 00:15 UTC, in the thin early Asian hours. Then it climbed back, and at 09:45 UTC it stood at 4160.565. The theory would like that one. However, it came when the market had the least depth.
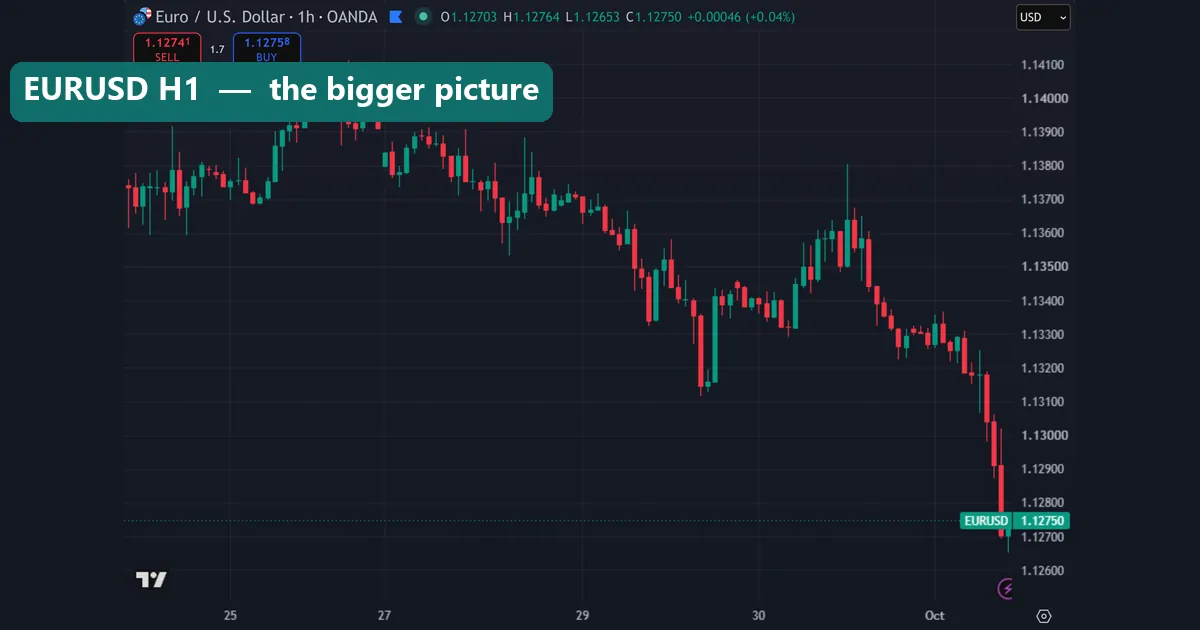
The EURUSD hourly chart puts the M15 detail in context. After a high on 26 September, the pair falls into 1 October. The tall upper wick on 30 September is the same sweep from the worked example. On this scale it is one spike inside a falling market. So check the larger flow before you read a single sweep. Our market structure guide shows how.
Common mistakes with liquidity
- Treating every sweep as a reversal. The close-back rate is near half. So wait for more, such as a structure shift on a lower timeframe.
- Ignoring market liquidity. A spike at 00:15 UTC happens in thin trade with wide spreads. Check our page on forex trading sessions before you trust it.
- Mixing up day boundaries. Pick one day definition and keep it, or your previous high moves when you change platform.
- Putting your stop where everyone else does. If stops cluster just past the obvious high, avoid that spot by habit. Size down so a wider stop still fits your risk.
Liquidity indicators you can use
Drawing levels by hand works, but a tool keeps the rules fixed. Our liquidity indicator for MT4 and MT5 marks likely pools above highs and below lows. The buy-side and sell-side liquidity indicator splits the two sides into separate zones.
On TradingView, the liquidity sweep detector flags the bar that takes a level. That flag says a level broke, not where price will close. The MT4 and MT5 downloads are compiled files, so you can run them but not edit them.
Where to go next
Next, read about the draw on liquidity, which asks which pool price will reach next. Then see how stops gather in a liquidity pool, and follow a full liquidity sweep example. For outside data, the New York Fed Foreign Exchange Committee volume survey shows how much FX trades in North America.
FAQ
What is liquidity in trading in simple terms?
In finance, it means how easily you can trade size at a fair price. In ICT teaching, it means the stop and entry orders resting above highs and below lows.
What is buy-side and sell-side liquidity?
Buy-side liquidity is the cluster of buy orders above a high, mostly stops and breakout entries. Sell-side liquidity is the cluster of sell orders below a low.
How often does price take the previous day’s high or low?
On roughly half of all days in our MT4 data. On EURUSD, over 297 days, the high went on 45.5% of days and the low on 52.2%. Both went on 13.1%.
Is a liquidity sweep a reversal signal?
Not on its own. On EURUSD, a high sweep closed back below 51.9% of the time and a low sweep closed back above 51.6% of the time. That is close to a coin flip.
Why do the levels on my chart differ from yours?
The day boundary differs. Our TradingView charts use UTC days, our MT4 data uses a UTC+2 or UTC+3 server day, and many traders use a New York day.
Can I see stop orders in MetaTrader?
No. MetaTrader 4 has no order book. MetaTrader 5 has Depth of Market, but it shows only what the broker provides, never other traders’ stops.
When is forex market liquidity lowest?
Usually between the New York close and the Tokyo open, and around major news. Spreads tend to widen then, and quick spikes through old levels are common.
Can a liquidity indicator tell me where price will go?
No. It marks levels where orders likely rest and flags when one breaks, but it cannot say whether price will reverse, so use it as context with structure and risk rules; results are not guaranteed; past performance is not indicative of future results.
Last updated: 1 October 2026.

About the author
Written by Dominic Walsh, a Forex trader and MT4/MT5 indicator, Expert Advisor and script developer. Every tool on forexmt4systems.com is tested on live charts before release and ships with ready-to-use compiled MT4 (.ex4) and MT5 (.ex5) files. Learn more about the trader and developer behind this site.
How we build, test and correct every tool: Editorial & Testing Policy. Trading carries risk; see the disclaimer.