
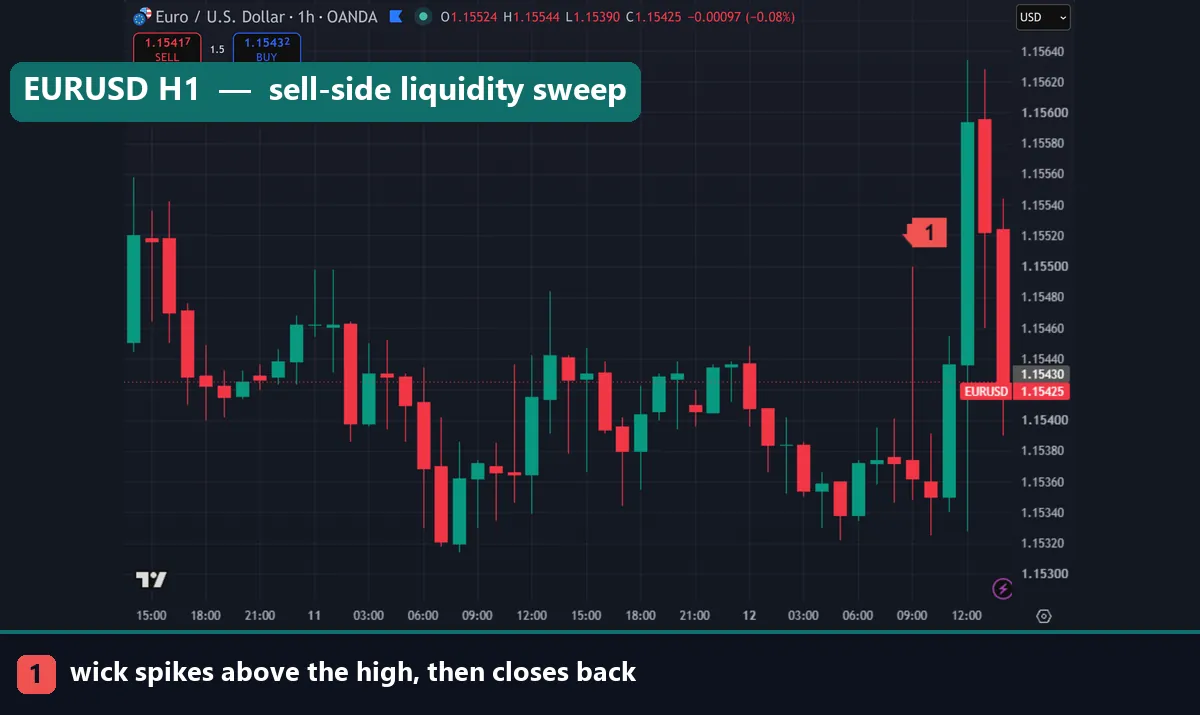
A liquidity sweep happens when price pushes just beyond an obvious high or low, triggers the stop orders resting there, and then reverses back into the range it came from. Traders also call it a stop hunt. For a few seconds the move looks like a clean breakout. Then the candle closes back inside the range, and the trap becomes visible. This guide walks through a liquidity sweep example on both sides of the market, separates a sweep from a genuine breakout, and stays honest about what the pattern cannot tell you.
What a liquidity sweep actually is
Orders are not spread evenly across a chart. They cluster. Traders who are long a currency pair park protective stops just under the last swing low. Shorts park theirs just above the last swing high. Breakout traders add entry stops in the same two places. So a narrow band of price above every obvious high, and below every obvious low, holds a dense pool of pending orders.
That pool is what the term liquidity describes here: orders that will execute automatically when price arrives. Anyone filling a large position needs willing counterparties, and triggered stops supply exactly that. Price therefore gravitates toward these levels.
When price finally trades through the level, those stops fire as market orders. That burst of forced buying or selling absorbs the size someone wanted to fill. Once the pool empties, the fuel behind the move is gone. Price often snaps straight back inside the range, which is the reversal traders point at afterwards and label a sweep.
Why liquidity pools sit above equal highs and below equal lows
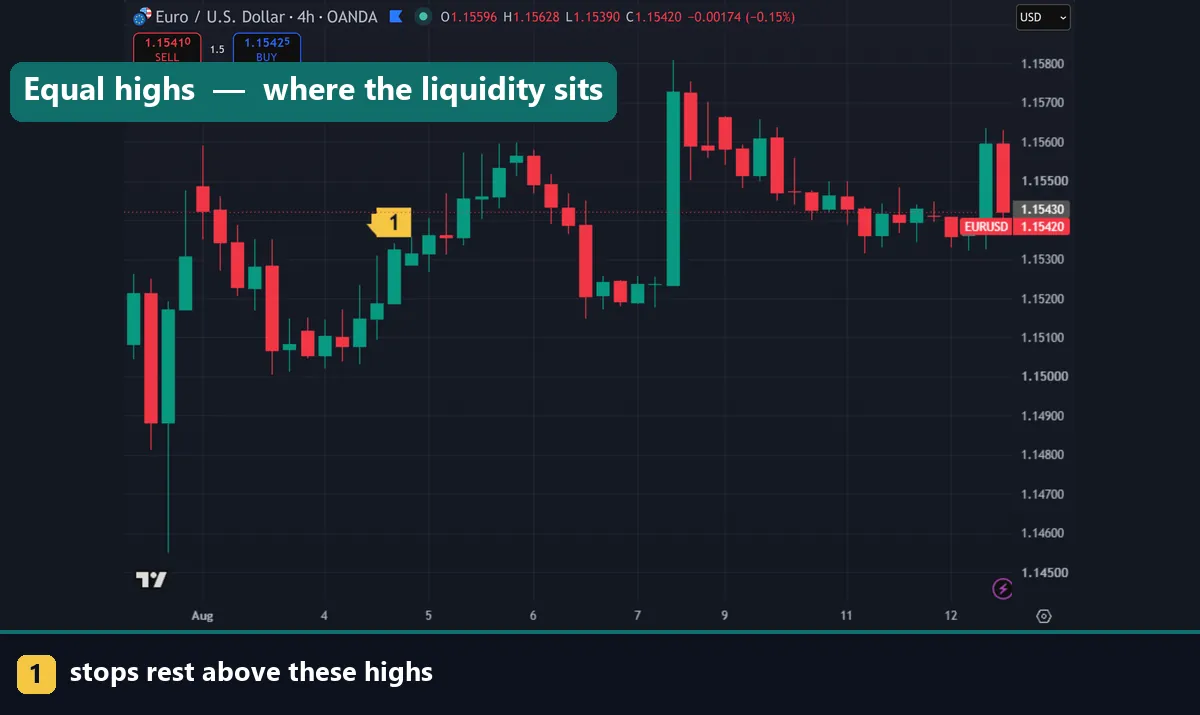
Equal highs are the clearest example. When price tests the same ceiling twice and stalls at nearly the same level, every chartist on that pair sees a double top. Shorts pile in beneath it and park their stops in a tight band directly above. That band is now a magnet, because it holds more resting orders than the surrounding air.
Equal lows work the same way in reverse. A double bottom invites longs, and their stops stack just below the shelf. The more equal the level looks, the tighter the cluster becomes. Ironically, the cleanest textbook level is the easiest one to run.
Round numbers behave similarly, because traders round their stops to neat figures rather than awkward ones. Session highs and lows qualify too, since intraday desks reference the Asian or London range when they set risk. If you can name a level out loud, orders probably sit near it.
Liquidity sweep versus a genuine breakout
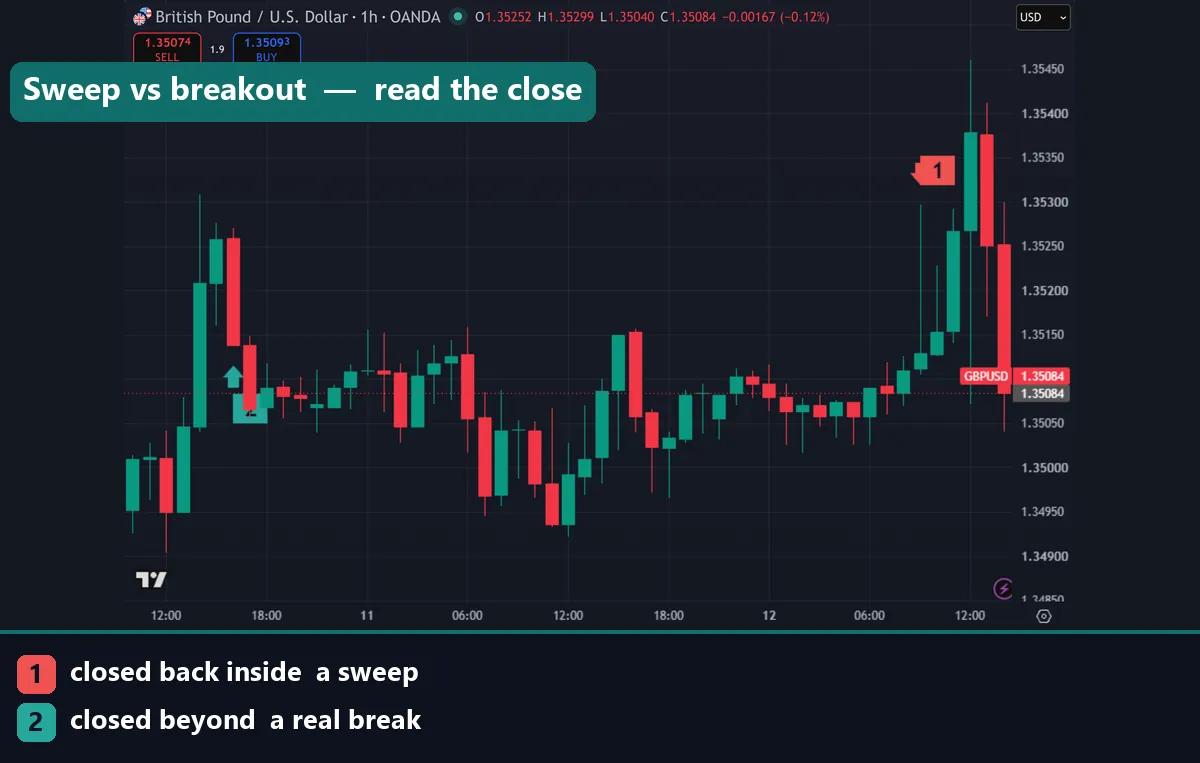
This is the distinction that matters, and the tell is the close. A sweep pierces the level with a wick, fails to find continuation buyers or sellers, and closes back inside the previous range. A real breakout closes beyond the level and then holds there. The following candles build away from the level instead of falling back through it.
So judge the move on closed candles, never on a flickering price. During the candle, the two look identical. After the close, they usually do not. Reading the shape of that candle properly is a skill worth practising, and our guide on how to read candlestick charts covers the wick-versus-body logic in detail.
The retest is your second confirmation. After a genuine break, price returns to the level and holds it in the opposite role. After a sweep, price slices straight back through, because nothing was ever built there.
A sell-side liquidity sweep example
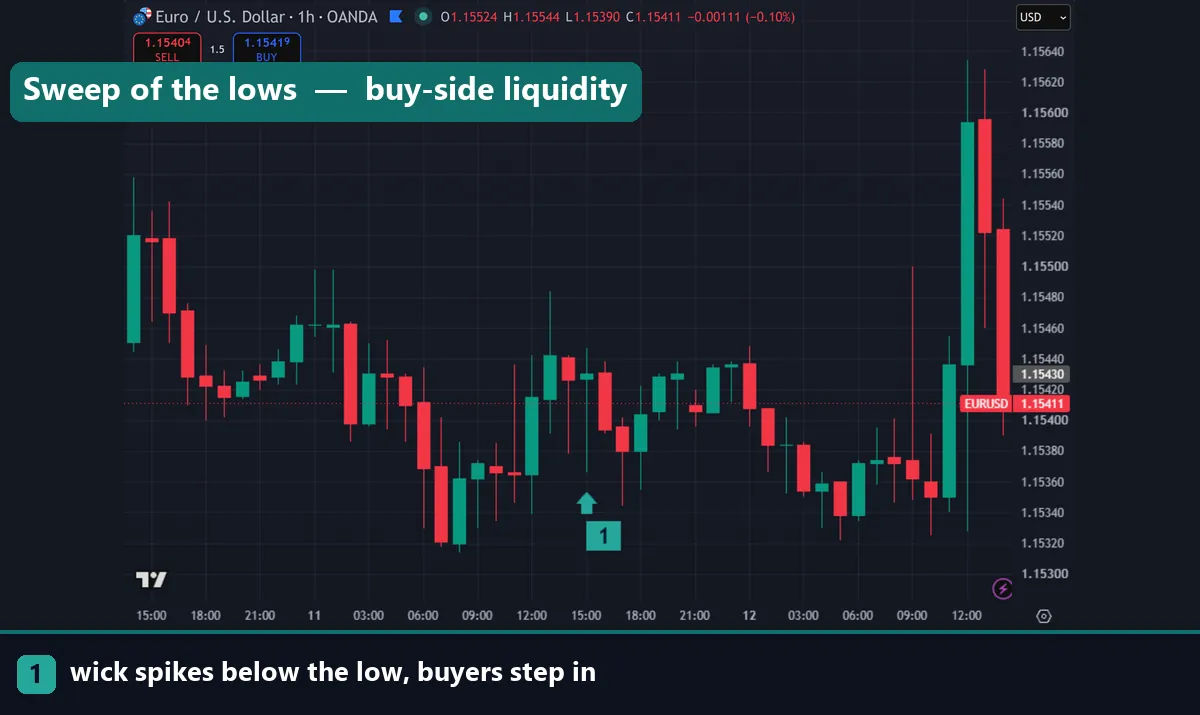
Sell-side liquidity means the sell stops resting below a low. Picture a pair that has bounced twice off the same support shelf, forming equal lows on the H1 chart. Buyers hold positions from that shelf, and their stops sit a handful of pips underneath.
Price then drifts lower and breaks the shelf by a small margin. Those stops trigger as sell orders. The candle prints a long lower wick, closes back above the shelf, and the next candle closes higher still. Buyers who were shaken out now watch price trade above where they exited.
Traders who follow this concept read that sequence as accumulation rather than a breakdown. They do not, however, buy the wick. Instead they wait for a shift in behaviour, which the entry section below explains.
A buy-side liquidity sweep example
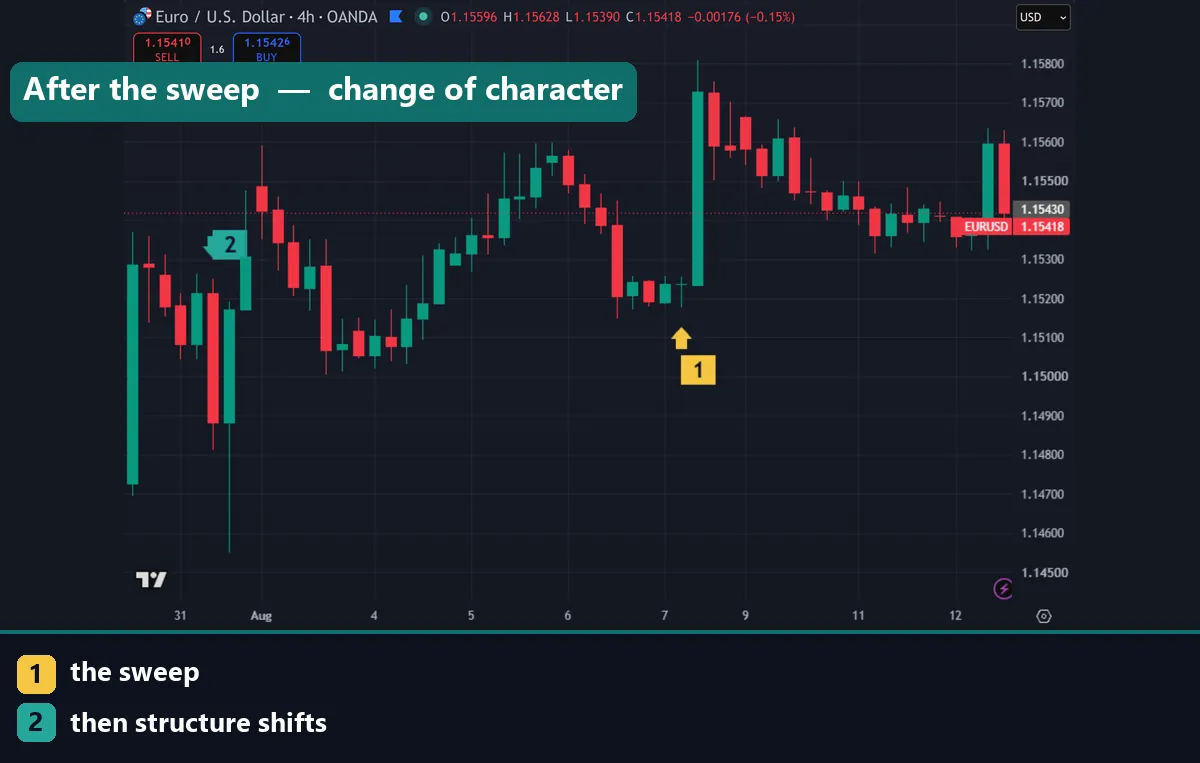
Buy-side liquidity is the mirror image: the buy stops resting above a high. Suppose a pair grinds into the previous day high during the London session and stalls there for an hour. Shorts are positioned beneath it, and breakout buyers have orders waiting above it.
One impulsive candle spikes through the high, fills both sets of orders, and closes back beneath the level. The high has been taken, yet price sits no higher than an hour earlier. On the next candle the market trades away from the level instead of extending. That is the classic buy-side sweep, and it frequently caps an intraday range.
Liquidity sweep types and what each one signals
| Level swept | Liquidity type | What it often signals | Watch out for |
|---|---|---|---|
| Equal highs | Buy-side | Range top being tested; possible short-term reversal down | Strong trends run equal highs and keep going |
| Equal lows | Sell-side | Range floor being tested; possible short-term reversal up | News can turn the sweep into a real breakdown |
| Session high / low | Both | Range expansion as a new session opens | Only meaningful around the session change |
| Previous day high / low | Both | Reference level for intraday desks; frequent reaction point | Often swept early, then respected all day |
| Round number | Both | Psychological cluster; sharp wicks are common | Spreads widen here, so fills can be poor |
Treat the middle column as a tendency, not a rule. Every level here also gets broken properly on a regular basis, which is why the close matters more than the level itself.
Waiting for the sweep, then the change of character
Most traders who use this concept refuse to enter on the sweep candle. Instead they add a second condition: a change of character, usually shortened to CHoCH. It means the short-term structure flips direction after the sweep.
Concretely, after a sell-side sweep on H1 they drop to M15 and wait for a close above the most recent lower high. That close says sellers have lost control of the smaller timeframe. Entry then comes on the pullback into the zone the shift created, with a stop below the sweep wick.
Momentum tools help you grade the shift rather than guess at it. Plenty of traders overlay an oscillator for that job, and our notes on the best RSI indicator settings explain how to tune one for the timeframe you actually trade. Marking the levels themselves is easier with a dedicated tool from the support and resistance indicators library.
Download the complete indicator database
Put these concepts on your charts. One email unlocks the full library of 1,380+ indicators with compiled MT4 and MT5 files, plus my TradingView scripts. No paywall, no spam, unsubscribe any time.
Get free access to my indicator database
One email unlocks 1,380+ free MT4, MT5 and TradingView indicators — the complete library. No single-tool download; you get the whole database.
The honest limitation of this pattern
Here is the part most tutorials skip. A liquidity sweep is only confirmed in hindsight. While the candle is forming you cannot know whether price will close back inside or keep running, and the same setup that produces a textbook reversal on Monday produces a trending breakout on Tuesday.
Many sweeps simply continue. Price takes the equal lows, keeps going, and the shelf becomes resistance for the rest of the week. Because the pattern is named after its outcome, chart examples posted online skew heavily toward the ones that reversed.
Treat the concept as a way to organise your levels and your risk, not as a forecast. It tells you where orders probably sit. It cannot tell you what price will do on arrival.
Common liquidity sweep mistakes
Four errors show up constantly. First, entering on the wick while the candle is still open, which turns a patient idea into a guess. Second, calling every wick a sweep; a small overshoot mid-range means little without an obvious pool of orders behind it. Third, ignoring the higher timeframe and fading a daily trend on an M5 reversal. Fourth, placing the stop too close to the sweep low, which invites a second run through the level. Give it room, and size down instead.
Where to go next
Sweeps are a structure concept, so they pair naturally with the tools you already use. Start with our roundup of the best day trading technical indicators, then set up your platform using the walkthrough on how to install MT4 and MT5 indicators. For background on the underlying idea, Investopedia explains what liquidity means at Investopedia, and Wikipedia describes the mechanics of a stop order on Wikipedia.
FAQ
What is a liquidity sweep in simple terms?
It is a move that pushes just past an obvious high or low, triggers the stop orders sitting there, and then reverses back into the range. The level gets tested, the orders get filled, and price returns to where it started.
How do I tell a liquidity sweep from a real breakout?
Look at the close. A sweep closes back inside the previous range and leaves a long wick outside it. A breakout closes beyond the level and the following candles hold above or below it, usually with a retest that respects the level.
Is a liquidity sweep the same as a stop hunt?
In everyday trading language, yes. Both describe price running through a cluster of resting stop orders before reversing. The smart-money vocabulary prefers sweep, while older technical analysis writing prefers stop hunt.
Which timeframe works best for spotting sweeps?
Most traders mark levels on H1, H4 or the daily chart, because those highs and lows attract the largest order clusters. They then refine entries on M5 or M15. Sweeps do appear on very low timeframes, but the noise makes them far harder to read.
Do sweeps always lead to a reversal?
No. Plenty of sweeps continue straight through the level and turn into genuine trends. That is why the concept is normally combined with a structure shift, a stop beyond the wick, and a clear invalidation point.
Can this pattern guarantee a profitable trade?
No. A liquidity sweep describes where orders were likely resting; it does not predict what price will do next, and it is only confirmed after the fact. Trading involves risk, results are not guaranteed, and past performance is not indicative of future results.

About the author
Written by Dominic Walsh, a Forex trader and MT4/MT5 indicator, Expert Advisor and script developer. Every tool on forexmt4systems.com is tested on live charts before release and ships with ready-to-use compiled MT4 (.ex4) and MT5 (.ex5) files. Learn more about the trader and developer behind this site.
How we build, test and correct every tool: Editorial & Testing Policy. Trading carries risk; see the disclaimer.