
Learning how to find liquidity in chart structure means identifying where stop orders are most likely to sit. Those clusters attract price, because filling large orders requires someone on the other side and stops provide it. This guide covers the five places liquidity gathers, how to rank them, and the honest limit of what a retail chart can actually show you.
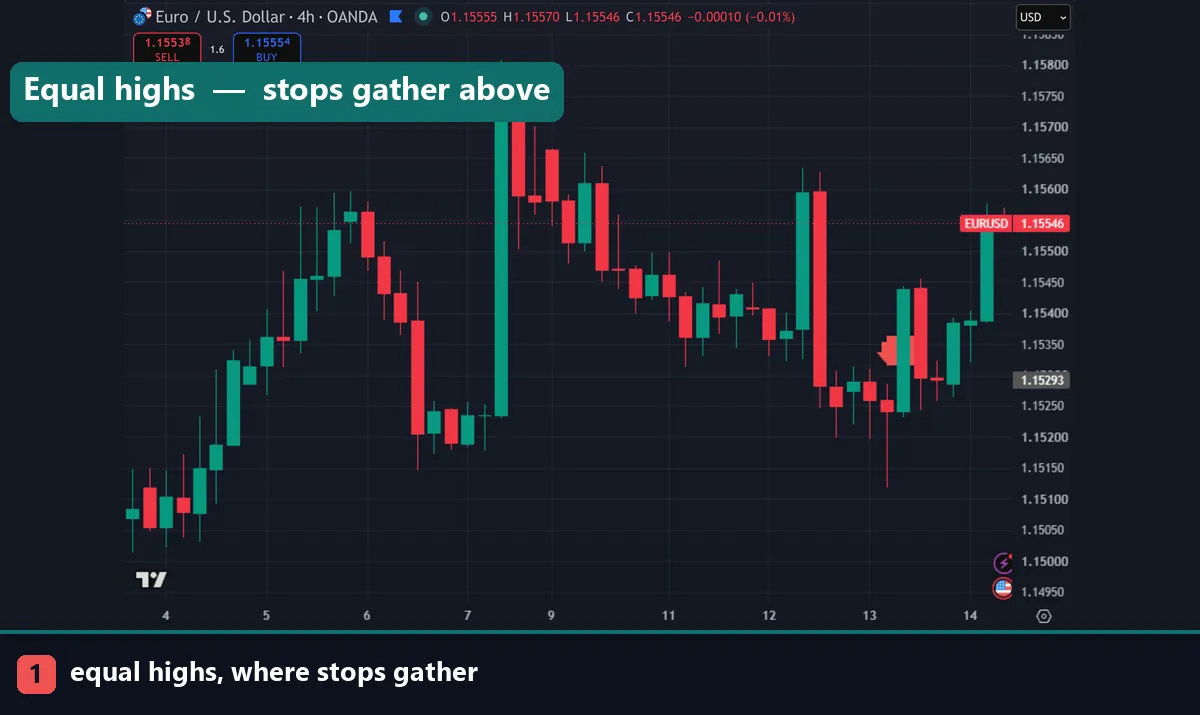
What liquidity means here
Liquidity in this context is not the general depth of a market. It means specific pools of resting orders — mostly stop losses — sitting at prices you can identify on a chart.
The reasoning is straightforward. A trader who bought at a swing low puts a stop just below it. Hundreds of traders do the same thing, so a cluster of sell orders builds under that low. Anyone wanting to buy a large amount needs sellers, and that cluster is where they are.
So price is drawn towards these areas, sweeps them, and often reverses once the orders are absorbed. Our market liquidity guide covers the general principle and liquidity sweep examples cover what the sweep looks like.
How to find liquidity in chart structure: five places
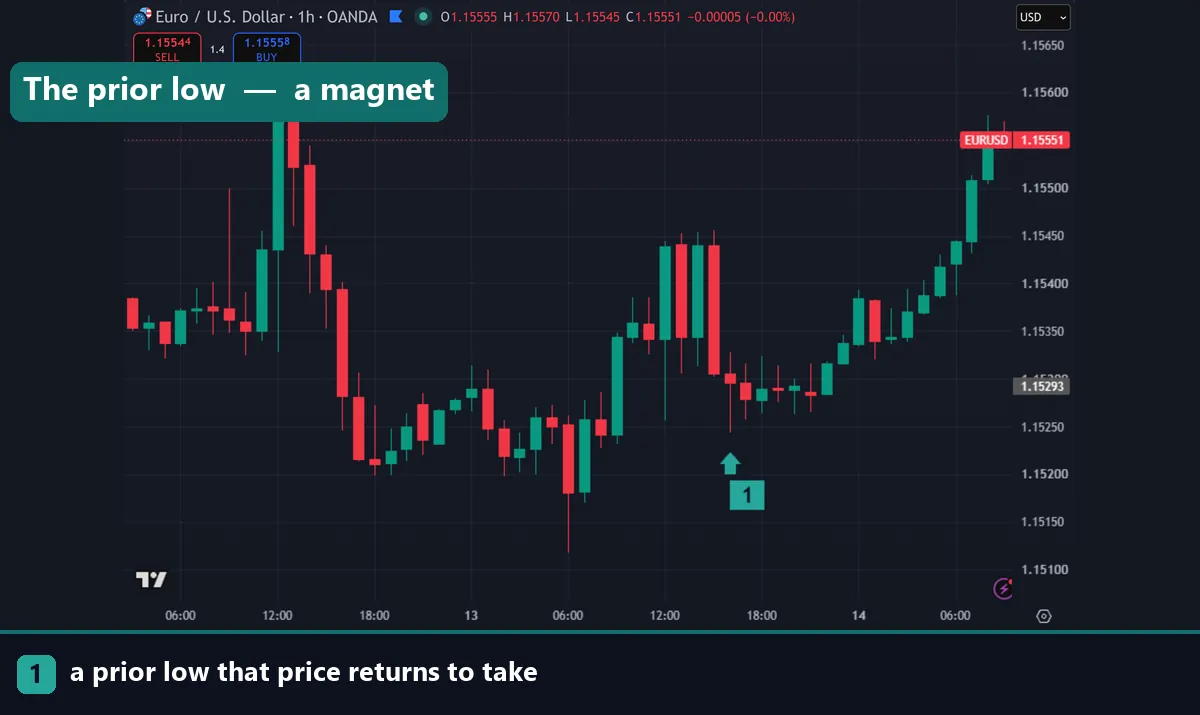
Equal highs and equal lows. The clearest signal on any chart. When price stalls at nearly the same level two or three times, stops pile above those highs or below those lows. The flatter the equality, the more obvious it is to everyone watching.
Prior session extremes. Yesterday’s high and low, and the weekly high and low. These are watched by enormous numbers of traders and carry orders accordingly.
Obvious swing points. Any swing high or low that stands out without effort. If you have to hunt for it, so does everyone else, and the orders are not there.
Round numbers. 1.1000 on EURUSD, 150.00 on USDJPY, 2,400 on gold. Traders place stops and targets at round figures far more than randomness would predict.
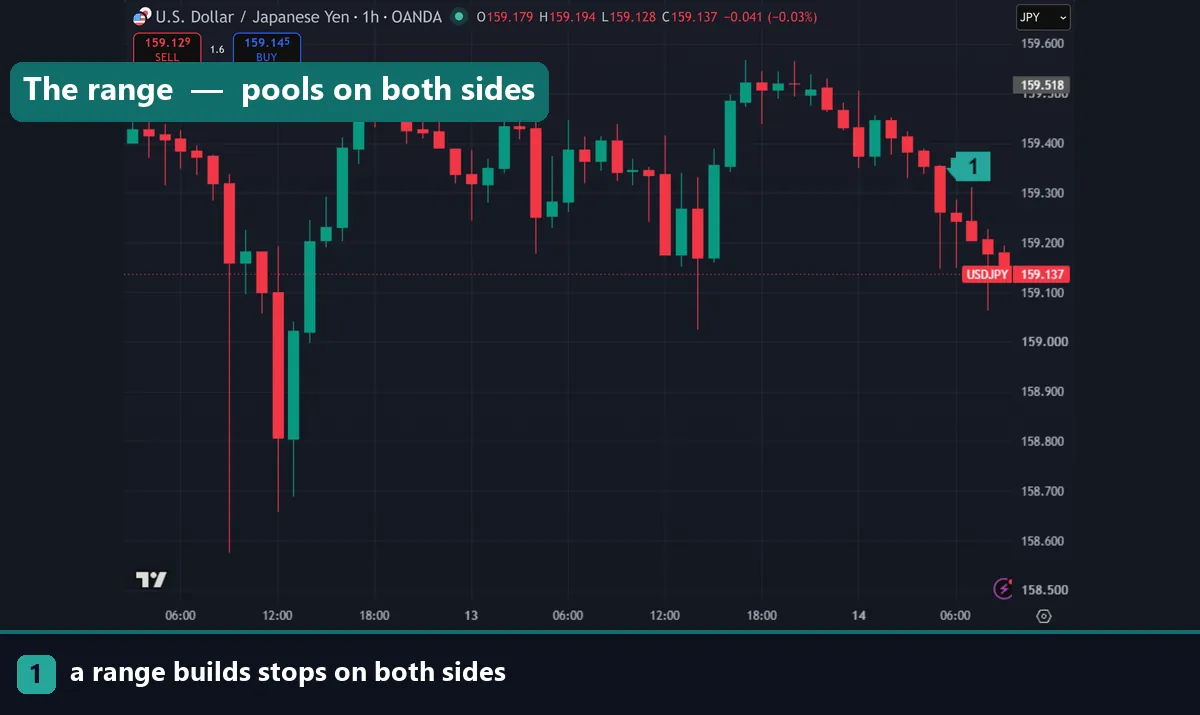
Range boundaries. A market that has ranged for days builds stops on both sides, since traders position for a break in each direction.
Ranking what you find
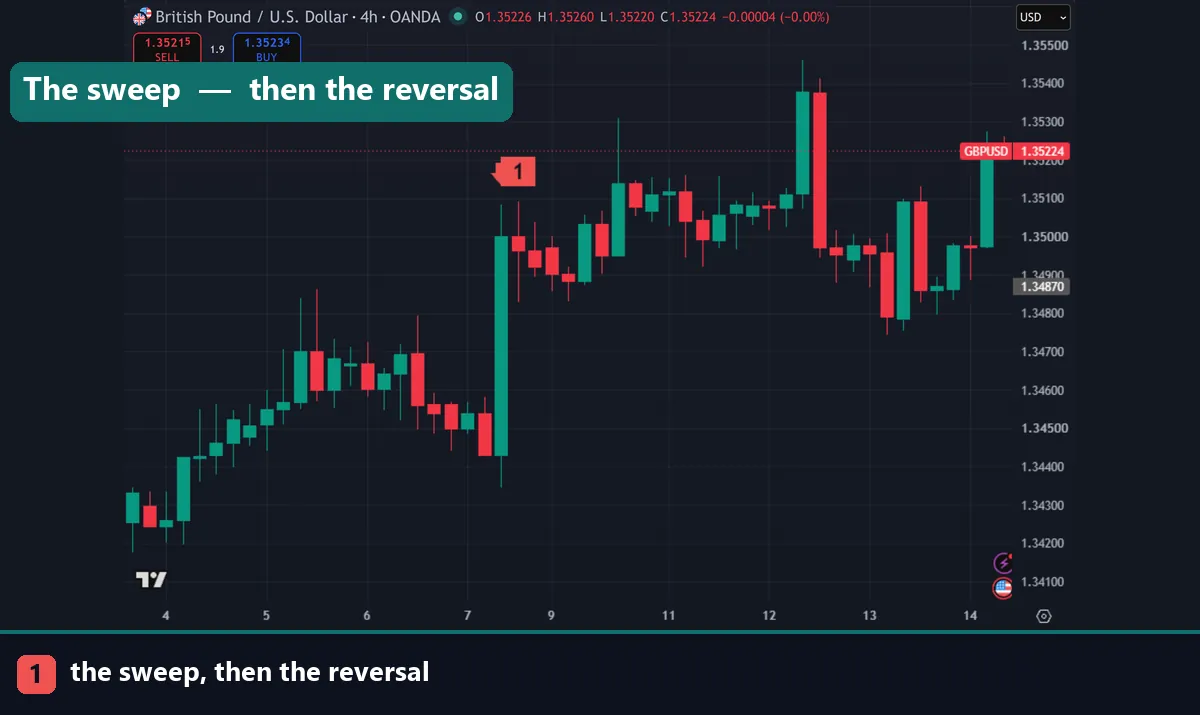
Mark every candidate and the chart becomes unusable. Three tests separate the ones that matter.
How obvious is it? Liquidity pools exist because many traders see the same level. Obviousness is the mechanism, not a shortcut.
How long has it been there? A high that has stood untested for a week has accumulated more orders than one formed an hour ago.
How many things agree? An equal high that also sits at yesterday’s high and a round number is a far stronger pool than any one of those alone.
Timeframe follows the same logic. Daily and H4 levels carry far more orders than M5 levels, so mark the higher timeframe first and use lower timeframes only for execution.
What a sweep looks like
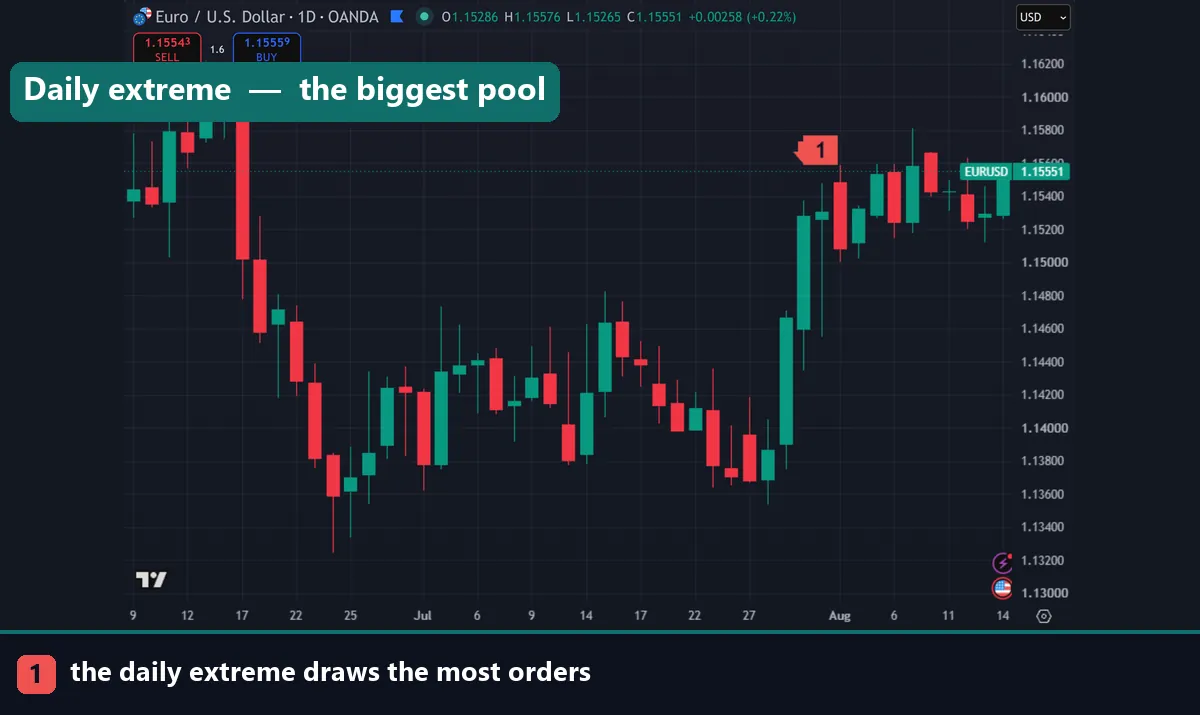
The pattern has three parts and recognising it is most of the value.
Price approaches the level, trades through it — often with a sharp move that looks like a breakout — then closes back inside. On the chart that leaves a long wick beyond the level, which is why long wicks at obvious highs and lows are worth studying.
The distinction that matters is sweep versus break. A sweep takes the orders and reverses; the close comes back inside. A break takes the orders and continues; the close holds beyond. Both start identically, and only the close tells you which happened.
That is why traders working this way wait for the candle to close rather than reacting to the spike. Our liquidity trap guide covers the trapped-trader dynamic that follows a sweep.
Download the complete indicator database
Put these concepts on your charts. One email unlocks the full library of 1,380+ indicators with compiled MT4 and MT5 files, plus my TradingView scripts. No paywall, no spam, unsubscribe any time.
Get free access to my indicator database
One email unlocks 1,380+ free MT4, MT5 and TradingView indicators — the complete library. No single-tool download; you get the whole database.
The honest limit
This needs saying clearly, because the vocabulary around this topic implies more precision than exists.
You cannot see the orders. Forex has no central exchange and no consolidated order book. Your broker shows its own feed, and no retail platform displays where stops actually sit.
Everything above is inference. It is reasonable inference — traders genuinely do put stops beyond obvious levels, and price genuinely does reach for those areas — but it is reading chart structure, not observing order flow.
Treat anyone claiming to show you institutional order flow on a MetaTrader chart with scepticism. They are making the same inference from the same public information.
The framework also fails around scheduled news, when a release drives price through every level regardless of what sits there. Check the calendar first, as covered in our forex news factory guide.
A workable routine
Four steps. Open the daily chart and mark the obvious extremes, equal highs and lows, and nearby round numbers. Drop to H4 and add anything equally obvious there. Note which side of price holds more pools, since that is the direction with a draw. Then wait for a sweep and a close back inside before acting.
Set the stop beyond the extreme of the sweep candle. If price closes past that wick, the read was wrong. Our ATR stop loss guide covers sizing that distance and the position sizing calculator converts it to lots.
Common mistakes
Four repeat. Marking every minor swing tops the list, which buries the chart and dilutes the levels that matter. Acting on the spike rather than the close comes second, since a sweep and a break look identical until the bar finishes. Third, traders work on M1 and M5 where the pools are too small to matter. Fourth, they treat the inference as observed order flow, which it is not.
Where to go next
This sits inside a structural framework. Read market liquidity for the foundation, then liquidity sweep examples and liquidity traps for what happens at the pools. Our low resistance liquidity guide covers the empty space between them, and the ICT trading strategy guide gives the wider method. For further reading, Investopedia explains liquidity at Investopedia, and the order book article on Wikipedia covers how resting orders work.
FAQ
How do I find liquidity on a chart?
Look for equal highs and lows, prior session extremes, obvious swing points, round numbers and range boundaries. Those are the places traders most commonly place stops, so orders gather there.
Why do equal highs matter so much?
Because they are unmissable. When price stalls twice at nearly the same level, everyone sees it and stops build above. The mechanism is shared visibility rather than anything hidden.
What is the difference between a sweep and a break?
Both trade through the level. A sweep closes back inside, leaving a long wick, and often reverses. A break closes beyond and continues. Only the candle close separates them.
Which timeframe should I mark?
Daily and H4 first, because those levels carry far more orders. Use M15 or lower only for timing an entry, never for identifying the pools themselves.
Can I actually see where stops are?
No. Forex has no central order book and no retail platform shows resting orders. Everything here is inference from chart structure, which is reasonable but not observation.
Is a liquidity pool a trade signal?
It marks where to pay attention. The trade still needs a sweep, a close back inside, and preferably trend context. Trading involves risk, results are not guaranteed, and past performance is not indicative of future results.

About the author
Written by Dominic Walsh, a Forex trader and MT4/MT5 indicator, Expert Advisor and script developer. Every tool on forexmt4systems.com is tested on live charts before release and ships with ready-to-use compiled MT4 (.ex4) and MT5 (.ex5) files. Learn more about the trader and developer behind this site.
How we build, test and correct every tool: Editorial & Testing Policy. Trading carries risk; see the disclaimer.