
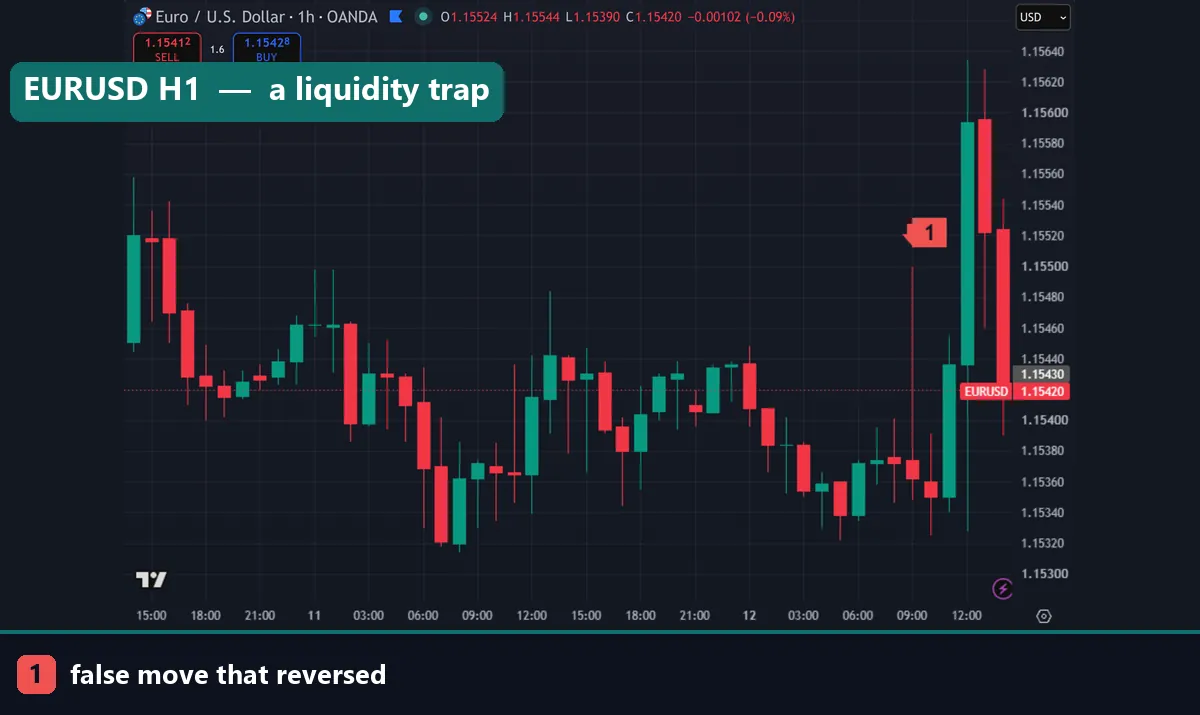
In trading, a liquidity trap is a false move that lures traders onto the wrong side of the market before reversing against them. Price breaks a level, everyone piles in, and the move immediately fails. The two everyday versions are the bull trap and the bear trap. Note that economists use the same phrase for something completely different, so this guide separates the two meanings first, then focuses on the trading sense: where these traps form, what exposes them, and how to stop walking into them.
Two meanings, one phrase
The economics definition comes from Keynesian theory. It describes a condition where interest rates are already very low, yet cheap money still fails to stimulate borrowing and demand. Households and banks hold cash instead of spending or lending it, so further rate cuts lose their effect. Central bankers then reach for other tools. That usage is macroeconomic and has nothing to do with a chart pattern.
Traders borrowed the phrase for a different idea. In the market sense, the “trap” is the pool of orders that gets caught on the wrong side of a failed move. Both meanings appear in search results, which is why so many traders end up on the wrong article. Everything below concerns the trading sense.
What a liquidity trap looks like on a chart
The sequence is consistent. Price approaches a level that everybody can see. It breaks through convincingly enough to trigger entries and stop orders. Momentum then evaporates within a candle or two, and price returns inside the range it just left. Traders who entered on the break are now underwater, and their exits push price further in the opposite direction.
That last part gives the pattern its bite. A trap does not merely fail; it fuels the reverse move, because trapped traders must eventually close out. So the reversal often travels further than the original breakout promised.
Bull traps and bear traps
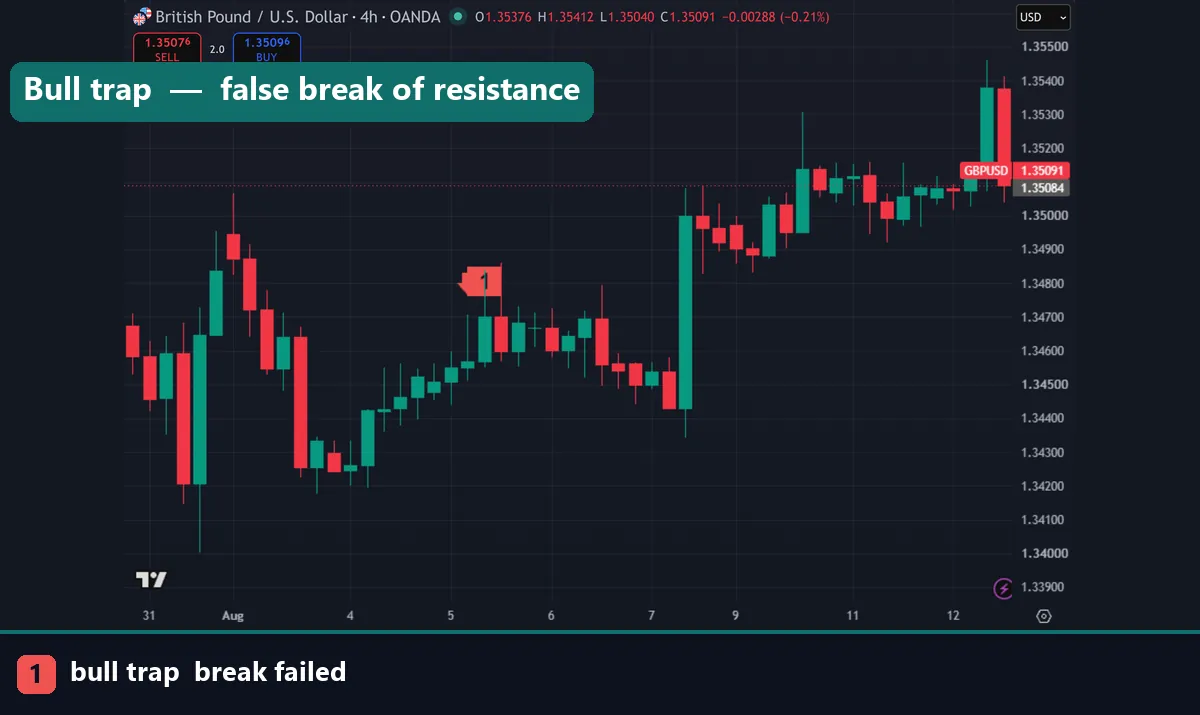
A bull trap is a false upside break. Price clears a resistance level or a prior high, breakout buyers enter, and then the candle closes back beneath the level. The trap catches buyers long while the market turns down. Bull traps cluster at range tops, at previous highs and at round numbers.
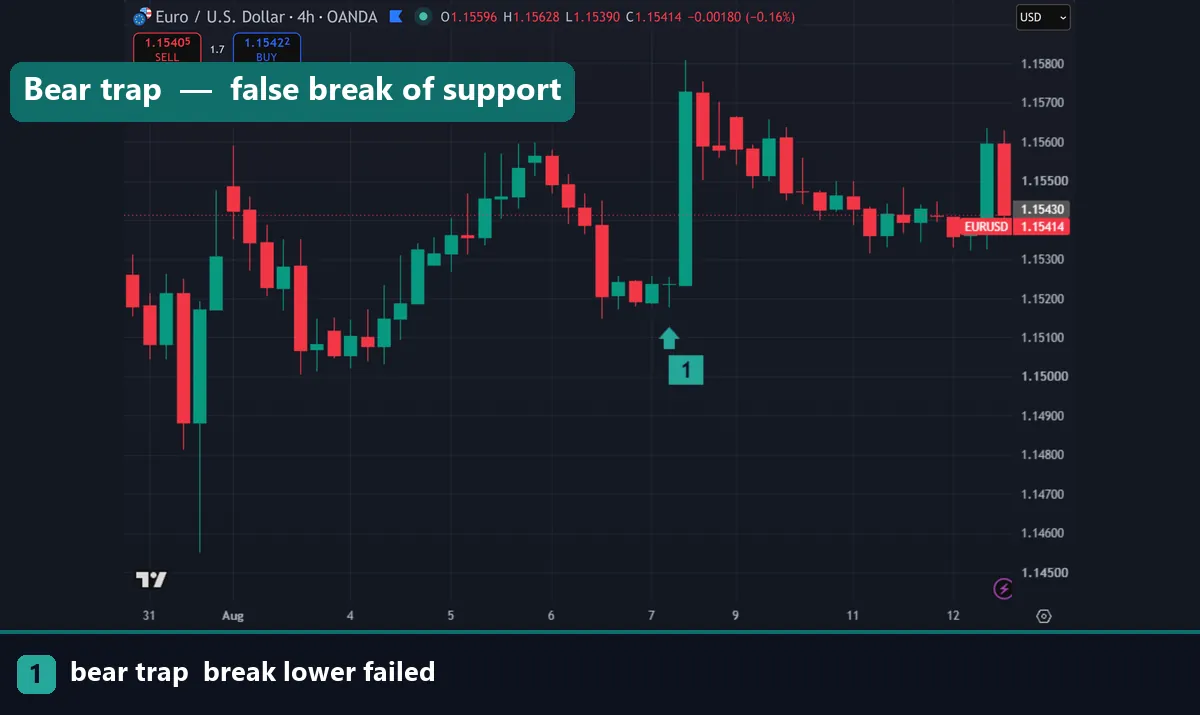
A bear trap is the mirror image. Price drops through support. Sellers go short, stops trigger on the longs, and then price reclaims the level. The trap catches sellers short just as price rallies. Bear traps are common at obvious swing lows, especially the ones that look like a clean double bottom on the daily chart.
Both share one feature: the level had to be obvious. A trap needs a crowd, and a crowd only forms where a level is easy to see. Levels nobody is watching rarely produce meaningful traps.
Where a liquidity trap tends to form
Three locations account for most of them. Well-tested support and resistance comes first, because positions and stops accumulate there over days. Round numbers rank second, since so many traders round entries and stops to a neat figure. Fake breakouts from a tight consolidation supply the third, where the market probes one side before committing to the other.
Session boundaries add another layer. London often probes a range that formed during the quiet Asian hours, and that first push regularly fails before the real direction appears. Marking these zones ahead of time is straightforward with a tool from our support and resistance indicators library, which keeps the levels on the chart instead of in your head.
News releases deserve a mention too. Price often spikes both ways in the first minute after a release, trapping traders in each direction before settling. That is a liquidity and spread effect, not a signal.
How the close and volume expose a trap
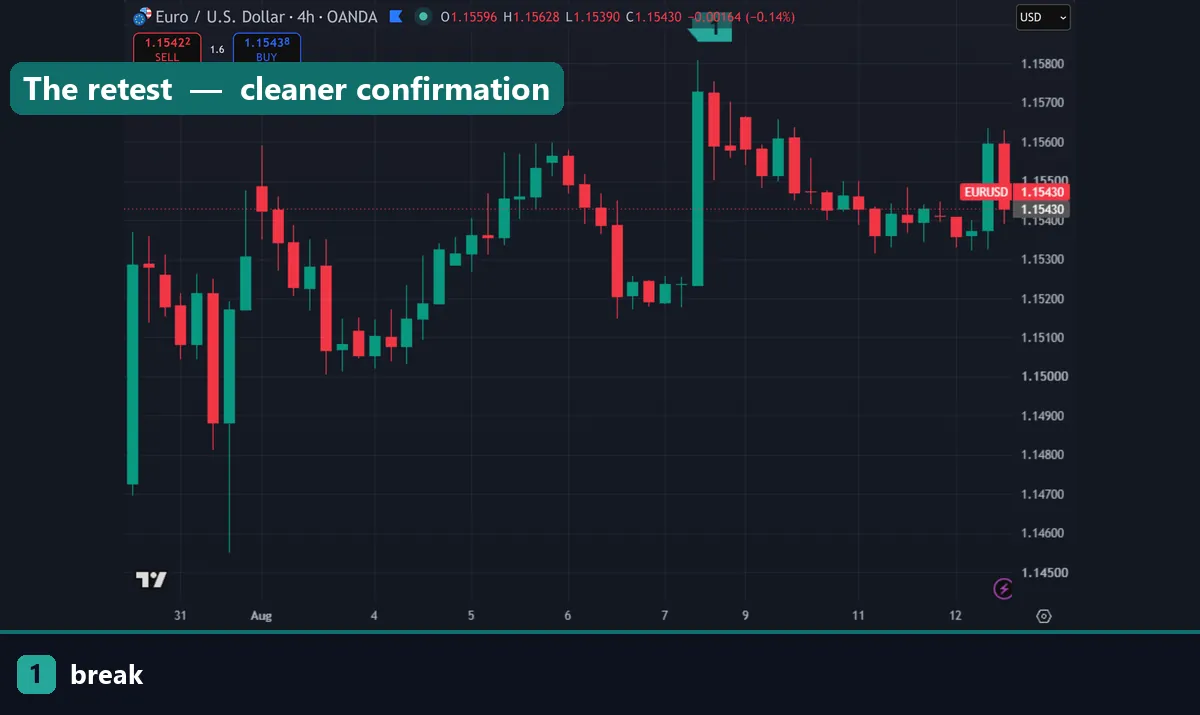
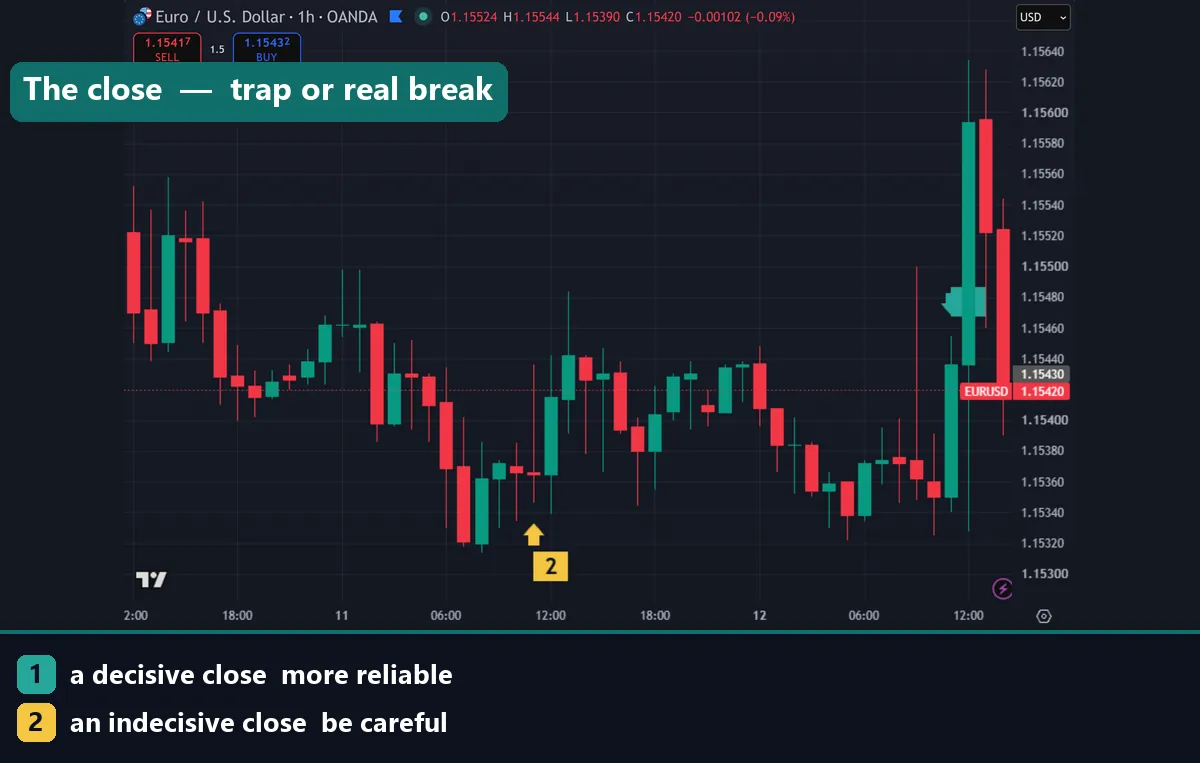
The candle close is the single most useful filter. A genuine breakout closes beyond the level and the next candles build away from it. A trap closes back inside, usually leaving a long wick where the break happened. So judge the move only on closed candles, and prefer the close of a higher timeframe over a five-minute flicker.
Volume adds a second opinion. Real breakouts normally attract participation, so tick volume expands as the level breaks and stays elevated. A trap often breaks on thin, unremarkable volume and then sees a volume surge on the reversal instead, as trapped traders exit. Forex tick volume is a proxy rather than true exchange volume, so treat it as supporting evidence.
The retest is your third check. After a real break, price usually comes back to the level and holds there in its new role. After a trap, price slices straight back through and keeps going. Reading these candles accurately takes practice, and our guide on how to read candlestick charts breaks down the wick-to-body relationships involved.
Bull trap versus bear trap at a glance
| Feature | Bull trap | Bear trap |
|---|---|---|
| Where it forms | Range top, prior high, resistance, round number above price | Range floor, prior low, support, round number below price |
| What it looks like | Break above the level, then a close back beneath it with an upper wick | Break below the level, then a close back above it with a lower wick |
| Who gets caught | Breakout buyers and traders chasing strength | Breakout sellers and longs stopped out at the low |
| Volume clue | Thin break, heavier volume on the drop back | Thin break, heavier volume on the recovery |
| What to wait for | A close back inside the range, then a failed retest of the high | A close back inside the range, then a failed retest of the low |
| Typical outcome | Move toward the opposite side of the range | Move toward the opposite side of the range |
Both columns describe tendencies. Price also breaks every level in that table properly on a regular basis, which is exactly why the confirmation steps matter more than the label.
How to avoid being trapped
Start with patience. Waiting for the candle to close before you act removes a large share of these situations, because most traps are only visible once the close prints. Yes, you sacrifice some of the move. You also stop paying for the fakes.
Next, demand a retest. Entering on the pullback to a broken level rather than on the break itself gives the market a chance to prove the level has flipped roles. If the retest fails, you never took the trade.
Third, zoom out. A break that looks decisive on M5 can mean nothing inside an H4 range, so check the higher timeframe before you commit. A momentum reading helps here as a cross-check, and our notes on the best RSI indicator settings show how to tune one so it reflects your timeframe rather than fighting it.
Download the complete indicator database
Put these concepts on your charts. One email unlocks the full library of 1,380+ indicators with compiled MT4 and MT5 files, plus my TradingView scripts. No paywall, no spam, unsubscribe any time.
Get free access to my indicator database
One email unlocks 1,380+ free MT4, MT5 and TradingView indicators — the complete library. No single-tool download; you get the whole database.
The honest limitation
No method identifies a trap reliably in real time. What happens afterwards defines the pattern, so at the moment of the break a trap and a real breakout look the same. Confirmation only arrives once the reversal is underway, and by then part of the move has already gone.
There is a second problem. Filters that avoid traps also filter out genuine breakouts. Wait for a close and a retest, and you will skip the strongest moves that never look back. Every trader trades that compromise; nobody removes it. Judge your rules over a long sample, not over the last three trades.
Common liquidity trap mistakes
Four mistakes cause most of the damage. First, chasing a break the moment price ticks through a level, before any candle has closed. Second, treating the economics definition and the trading pattern as related, which sends traders looking for macro explanations of a five-minute wick. Third, doubling down after being trapped, which converts a small loss into a large one. Fourth, placing stops in the most obvious spot of all, a pip beyond the round number, where the crowd already sits. Move the stop to where the idea is genuinely wrong, then reduce position size to keep the risk unchanged.
Where to go next
Trap awareness works best alongside a solid indicator set. Begin with our roundup of the best day trading technical indicators, then get everything onto your platform with the walkthrough on how to install MT4 and MT5 indicators. For the economic definition, Investopedia explains the liquidity trap at Investopedia, and Wikipedia covers the liquidity trap on Wikipedia in a macroeconomic context.
FAQ
What is a liquidity trap in trading?
It is a false move that pulls traders into the wrong side of the market. Price breaks an obvious level, attracts entries and stop orders, then reverses back inside the range and leaves those positions offside.
Is the trading meaning the same as the economics meaning?
No. In economics, a liquidity trap is a condition where very low interest rates no longer stimulate borrowing or demand. The trading usage borrows the phrase to describe a failed breakout. They share a name and nothing else.
What is the difference between a bull trap and a bear trap?
A bull trap is a failed upside break that catches buyers at a high. A bear trap is a failed downside break that catches sellers at a low. Both end with price closing back inside the range it just left.
How can I confirm a trap before entering?
Wait for the candle to close back inside the range, then watch the retest of the broken level. If the retest fails quickly and volume expands on the reversal, the evidence supports a trap. None of that is confirmation while the candle is still open.
Do traps happen more often on lower timeframes?
They appear more frequently there, mostly because noise and spread create many small failed breaks. Higher timeframe traps are rarer but tend to matter more, since the level attracted a larger crowd before it failed.
Can any method guarantee I avoid liquidity traps?
No. A trap is only identifiable after the reversal begins, and the filters that avoid traps also cost you real breakouts. Trading involves risk, results are not guaranteed, and past performance is not indicative of future results.

About the author
Written by Dominic Walsh, a Forex trader and MT4/MT5 indicator, Expert Advisor and script developer. Every tool on forexmt4systems.com is tested on live charts before release and ships with ready-to-use compiled MT4 (.ex4) and MT5 (.ex5) files. Learn more about the trader and developer behind this site.
How we build, test and correct every tool: Editorial & Testing Policy. Trading carries risk; see the disclaimer.