
An ICT trading strategy is a price-action method that reads the chart through institutional order flow. ICT stands for Inner Circle Trader, the online alias of Michael J. Huddleston. The approach drops indicators almost entirely. Instead it maps where orders are likely resting, then waits for price to travel there and react. This guide explains every core building block in plain English: market structure, order blocks, fair value gaps, liquidity pools and premium versus discount pricing. It also covers the criticism honestly, because the method is more discretionary than most tutorials admit.
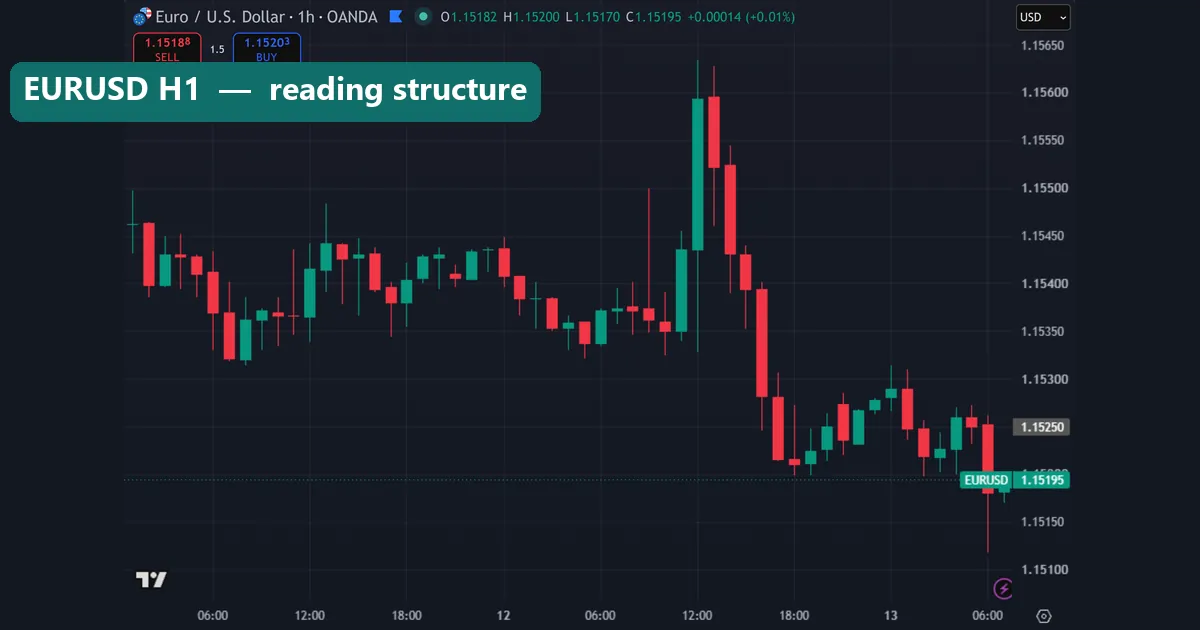
What ICT concepts are built on
One idea sits underneath everything. Large institutions cannot fill a big order at a single price, so price must travel to where resting orders sit. Retail stops cluster in obvious places, such as just above an old high. Under the ICT view, a spike into that high is not random. It is price reaching for fuel before it turns.
You do not have to believe the story to use the map, though. Old highs, old lows and price gaps are levels most traders already watch. Therefore they often matter, partly because everybody sees them. The levels are useful; the narrative around them is unprovable.
Market structure and the break of structure
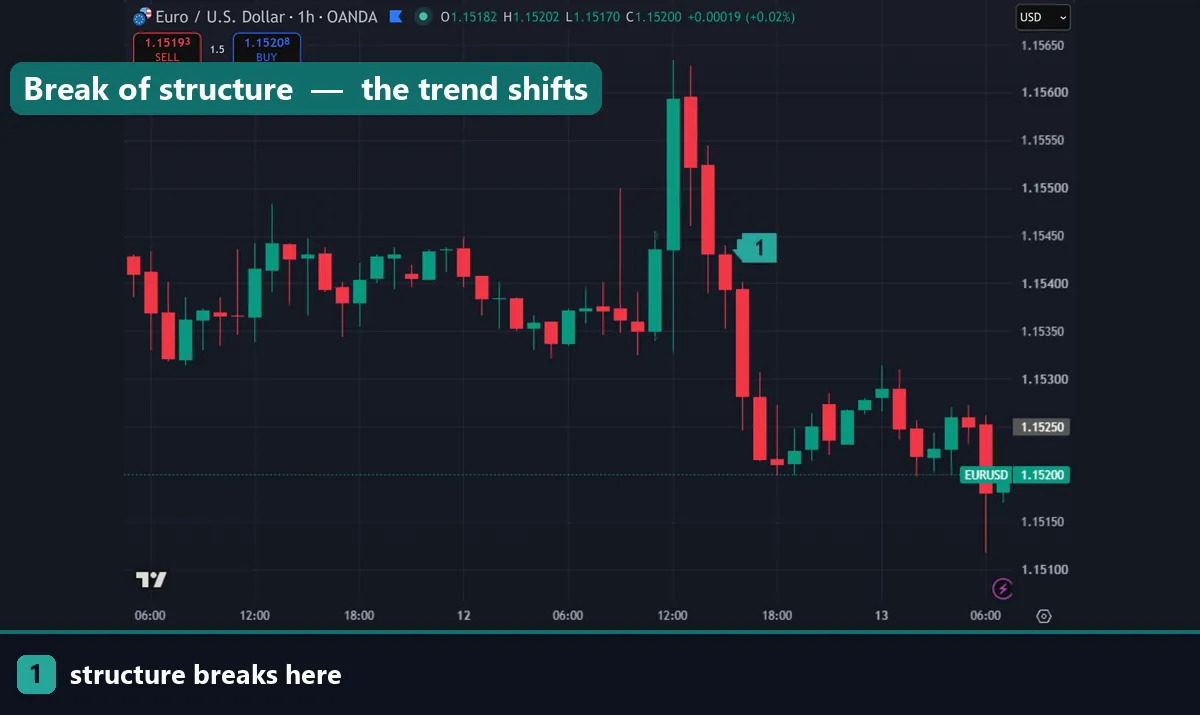
Market structure is simply the sequence of swing highs and swing lows. An uptrend prints higher highs and higher lows. A downtrend prints lower lows and lower highs. So structure describes the trend, swing by swing, without a single calculation.
A break of structure, or BOS, happens when price closes beyond the last swing point with the trend. It confirms continuation. A change of character, or CHoCH, is the mirror image: price breaks a swing against the trend, which hints the move is turning. Most ICT traders wait for a CHoCH before trusting a reversal.
The limitation here is real. Swing points are subjective, and the same chart shows different structure on M5 than on H1. So pick one timeframe for bias and one for entry, then stay consistent. Reading raw candles well makes this easier, and our guide on how to read candlestick charts covers that base.
Order blocks and fair value gaps

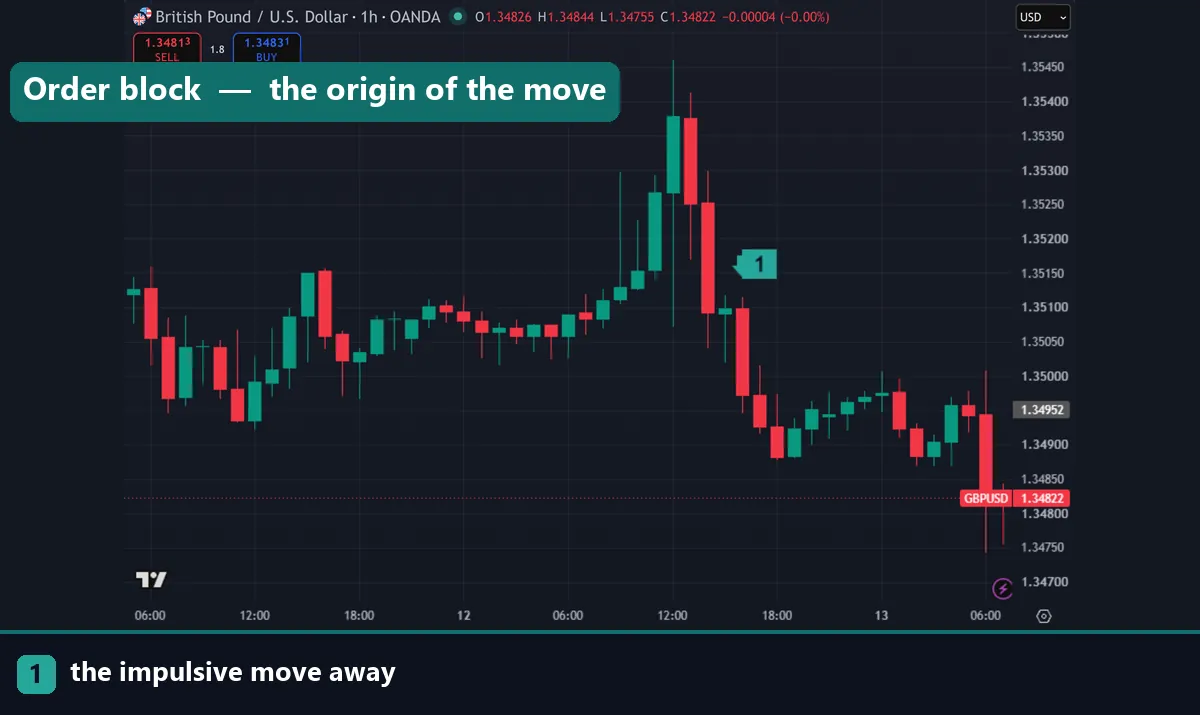
An order block is the last opposing candle before an impulsive move. A bullish order block is the final down candle before a strong rally. Traders mark its range as a zone, then watch for price to return there. The reasoning is that unfilled institutional orders remain inside that candle.
A fair value gap, also called an imbalance, is a three-candle pattern. The middle candle moves so fast that the wicks of candle one and candle three never overlap. That leaves a band of prices which barely traded. Price often returns to fill it, and many traders use the halfway point as their entry.
Now the honest catch. Any chart holds dozens of order blocks and gaps, and plenty are never revisited. Hindsight makes the winners look obvious. So decide in advance which zone you will trade, usually the one that caused the break of structure.
Liquidity pools above and below equal highs and lows
Liquidity, in ICT language, means resting stop orders. Two equal highs create a shelf, and short sellers’ stops sit just above it. That pool is called buy-side liquidity. Equal lows do the reverse and hold sell-side liquidity. Trendline touches and round numbers work the same way.
A sweep happens when price spikes through the shelf and then closes back inside the range. Traders read that as the pool being collected before the real move starts. Our walkthrough of a liquidity sweep example shows the sequence bar by bar, and the guide to the liquidity trap explains why a failed breakout damages so many accounts.
Still, a sweep proves nothing on its own. Sometimes price runs the stops and keeps going, which turns a reversal trade into a loss. So wait for structure to shift after the sweep rather than fading the spike.
Premium and discount pricing
This part is refreshingly simple. Draw a Fibonacci retracement across the swing low and swing high of the leg you care about. Everything above the 50% level counts as premium, and everything below counts as discount. ICT traders buy in discount and sell in premium, never the other way round.
The 0.62 to 0.79 band gets its own name: the optimal trade entry. Deeper retracements allow a tighter stop and a better reward-to-risk ratio. Yet strong trends often refuse to pull back that far, so waiting for a discount entry can leave you on the sidelines.
The core ICT concepts at a glance
| Concept | What it means | What traders use it for |
|---|---|---|
| Market structure | Sequence of swing highs and lows | Setting directional bias |
| Break of structure (BOS) | A close beyond the last swing, with the trend | Confirming continuation |
| Change of character (CHoCH) | A close beyond the last swing, against the trend | Timing a reversal entry |
| Order block | Last opposing candle before an impulsive move | Entry zone on the pullback |
| Fair value gap (FVG) | Three-candle imbalance with no wick overlap | Pullback target and entry level |
| Liquidity pool | Stops resting above equal highs or below equal lows | Mapping where price is drawn |
| Liquidity sweep | A spike through the pool, then a close back inside | Reversal trigger |
| Premium / discount | Above or below the 50% level of a price leg | Deciding where to buy or sell |
| Kill zone | Session window with heavier participation | Filtering when to trade |
Learn one row at a time. Traders who apply all nine at once end up with an unreadable chart.
How an ICT trading strategy setup is assembled
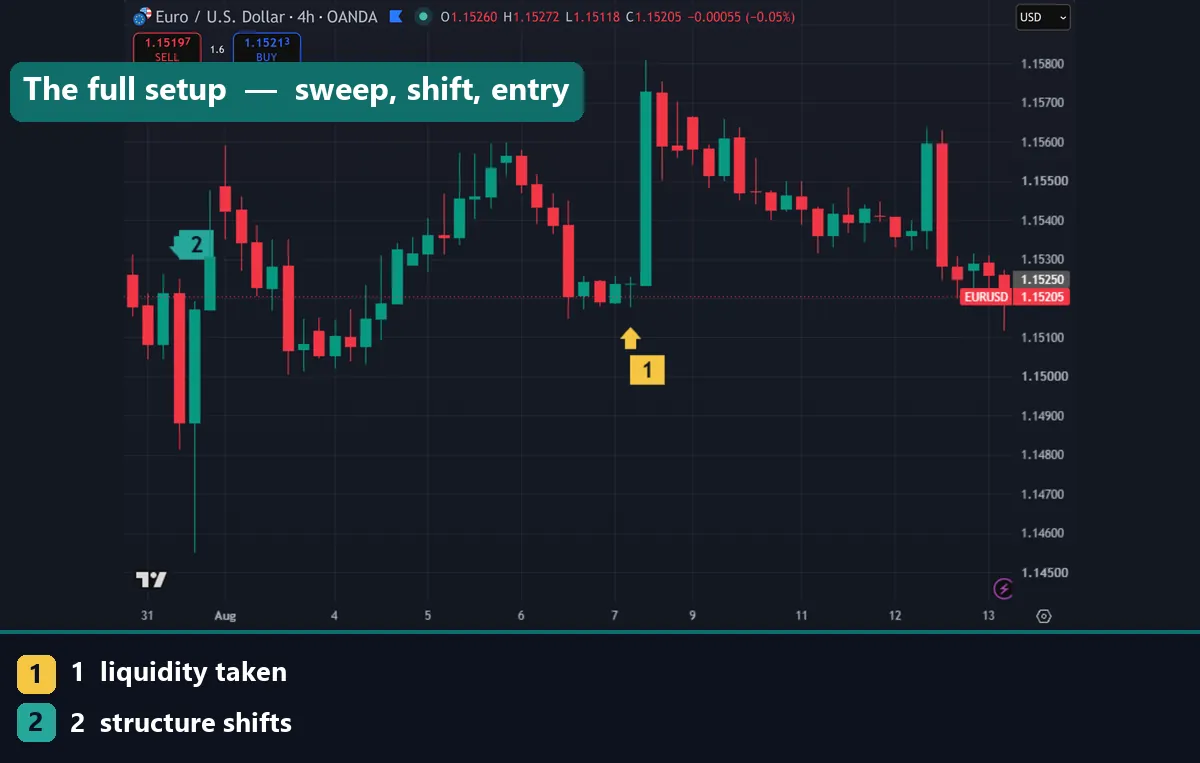
These pieces only work in sequence. First, set a higher-timeframe bias, because H4 or daily structure tells you which side you want. Second, mark the liquidity price is likely to reach: yesterday’s high, an equal-lows shelf, or a session extreme. Then wait. Nothing happens until price takes that liquidity.
Once the sweep occurs, drop to your entry timeframe and look for a change of character against it. That shift becomes your trigger. Next, find the order block or fair value gap that produced the shift, and place a limit order inside it. Finally, put the stop beyond the sweep wick and target the opposite liquidity pool.
Risk sizing comes first, not last. Calculate the position from the stop distance, and accept that many setups never complete. Anyone who needs a trade every session breaks this sequence, which is where losses begin.
Download the complete indicator database
Put these concepts on your charts. One email unlocks the full library of 1,380+ indicators with compiled MT4 and MT5 files, plus my TradingView scripts. No paywall, no spam, unsubscribe any time.
Get free access to my indicator database
One email unlocks 1,380+ free MT4, MT5 and TradingView indicators — the complete library. No single-tool download; you get the whole database.
The honest criticism of ICT concepts
Three criticisms deserve a straight answer. The first is hindsight. Most ICT charts on social media are marked up after the close, when the correct order block looks obvious. In live trading you face several candidate zones at once, and the method offers no objective rule for choosing between them.
Second, the vocabulary is new but the ideas are old. An order block sits very close to a supply or demand zone. A liquidity sweep is the stop hunt traders have described for decades. Premium and discount is Fibonacci retracement with fresh labels. Renaming a concept does not make it work better.
Third, none of this removes uncertainty. The framework stays discretionary, so two traders reading one chart can reach opposite conclusions. Backtesting is difficult for that reason. Treat ICT as a way to organise your chart reading, not as a system that hands you a fixed answer.
Common ICT trading strategy mistakes
Marking every gap is the most common error. The chart drowns under coloured boxes, and the trader gains a reason to enter anywhere. Keep only the zones tied to a structural break. A second mistake is skipping the higher-timeframe bias and trading M1 patterns alone, because the smallest timeframe sweeps liquidity constantly.
Overtrading the session windows ranks third. A time window is not a signal, so a quiet London session should end with no trade. Beginners also tuck the stop inside the sweep wick to chase a bigger reward figure. That places it exactly where price already proved it can reach. Leave room, or skip the setup.
Where to go next
ICT concepts sit on top of ordinary chart reading, so build that base first. Start with how to read candlestick charts, then study a full liquidity sweep example and the anatomy of a liquidity trap. Timing matters too, and our guide to when the forex market opens lists the hours each centre trades. If you want confirmation from a tool, compare the best day trading technical indicators, then follow the walkthrough on how to install MT4 and MT5 indicators. For outside reading, Investopedia explains how an order book works, and Wikipedia covers technical analysis more broadly.
FAQ
What is an ICT trading strategy in simple terms?
It is a price-action framework that assumes price moves toward pools of resting orders. You set a bias from higher-timeframe structure, wait for a liquidity sweep, then enter on a return to an order block or fair value gap.
Do I need indicators for the inner circle trader strategy?
No. The core method uses raw candles, structure and a Fibonacci tool. Some traders add a session-time or order-block indicator to save marking work, but every level can be drawn by hand.
What is the difference between an order block and a fair value gap?
An order block is a single candle, the last opposing one before an impulse. A fair value gap is the empty space between three candles where price moved too fast for the wicks to overlap.
Which timeframes suit ICT concepts best?
Most traders take bias from H4 or daily structure, then drop to M15 or M5 to enter. Lower timeframes sweep liquidity constantly, so entries below M5 add noise, not clarity.
Is ICT suitable for beginners?
Only after the basics are solid. The method assumes you can already read structure, candles and risk sizing. Beginners who skip that groundwork mark up charts with no consistent plan behind the boxes.
Are ICT concepts guaranteed to work?
No. The framework organises your reading of the chart; it does not predict price, and much of it is judgement rather than rule. Trading involves risk, results are not guaranteed, and past performance is not indicative of future results.

About the author
Written by Dominic Walsh, a Forex trader and MT4/MT5 indicator, Expert Advisor and script developer. Every tool on forexmt4systems.com is tested on live charts before release and ships with ready-to-use compiled MT4 (.ex4) and MT5 (.ex5) files. Learn more about the trader and developer behind this site.
How we build, test and correct every tool: Editorial & Testing Policy. Trading carries risk; see the disclaimer.