
Low resistance liquidity describes a stretch of chart where price can travel a long way without meeting much opposition. There are few unfilled orders in the path, so a move that starts tends to keep going until it reaches something substantial. Traders who work in this framework use it to decide which direction has room, and this guide covers how to identify it, how it differs from a liquidity pool, and where the idea breaks down.
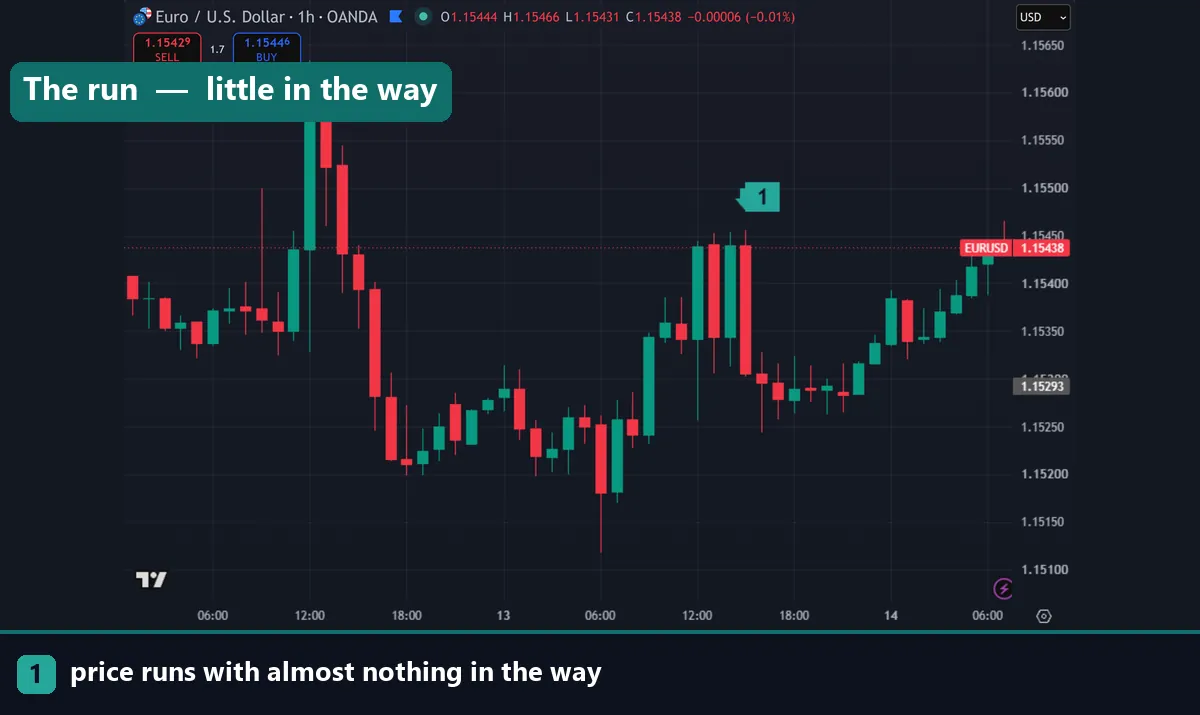
What low resistance liquidity actually describes
Every level on a chart where traders have placed orders represents potential opposition. Stop losses above old highs, limit orders at prior support, targets sitting at round numbers — all of it is resting business that price has to work through.
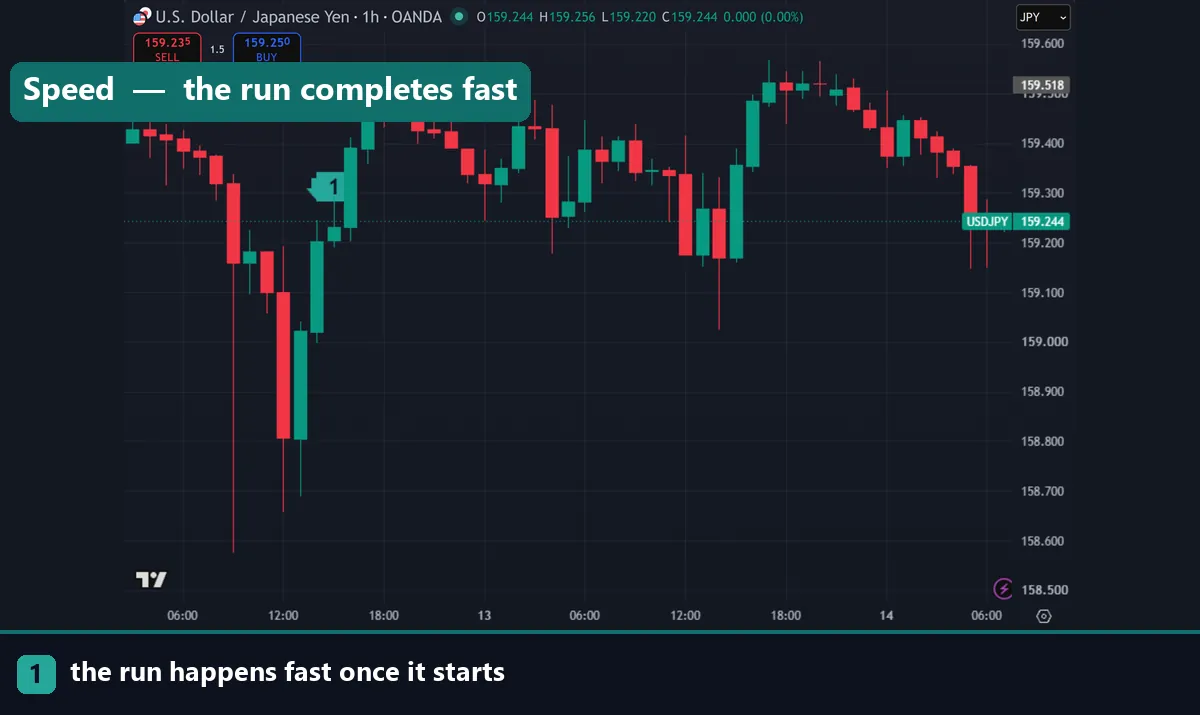
A low resistance liquidity run is the opposite condition: an area where that business has already cleared out, or never built up at all. With little in the way, price moves quickly and in one direction.
The term comes from the ICT framework, where it is sometimes written as a “low resistance liquidity run”. The underlying observation is older and simpler: markets move fast through empty space and slowly through crowded space. Our market liquidity guide covers the general principle.
How to spot it forming
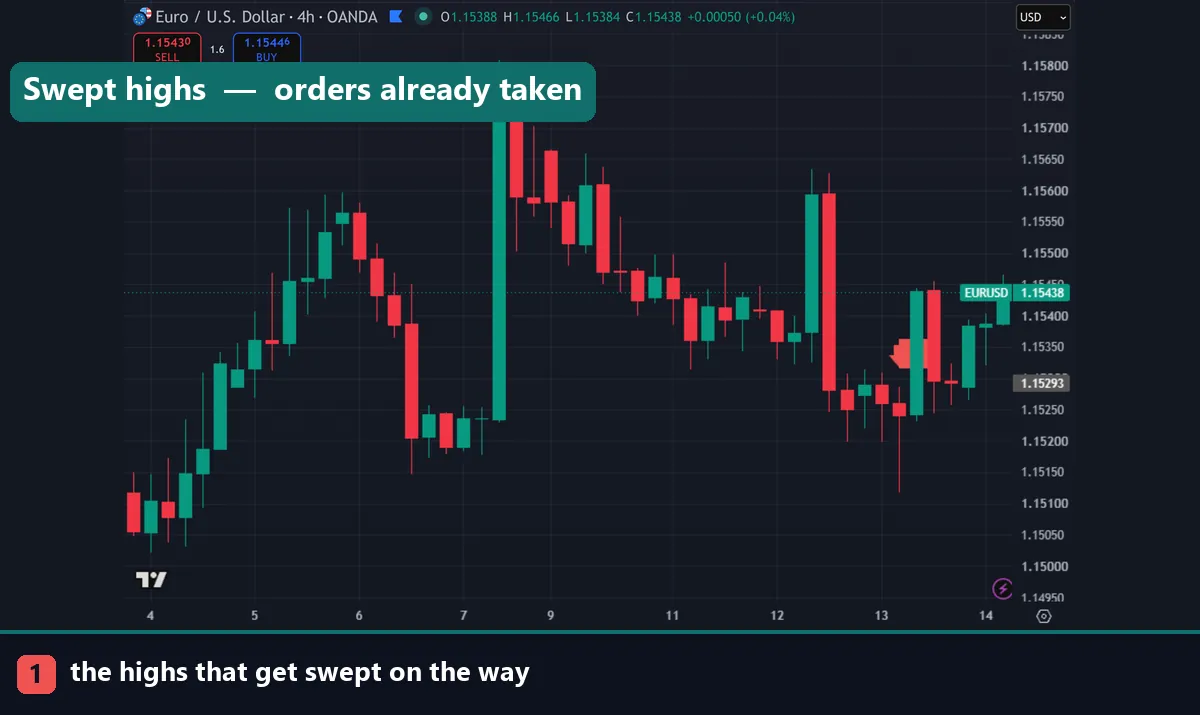
Four signs appear together when a stretch is genuinely thin.
Clean structure behind price. If the recent move already swept the highs and lows, those stops have gone. What is left above or below is emptier than it was.
A single directional leg. Long runs of same-direction candles with small pullbacks suggest nothing is pushing back. Price that grinds sideways is meeting supply.
Few prior touches. A price band that the market travelled through once, quickly, has fewer orders in it than a band it ranged in for days. Areas of long consolidation are the crowded ones.
Distance to the next obvious level. If the nearest prior high, session extreme or round number is a long way off, there is room for the run to continue.
Where it differs from a liquidity pool
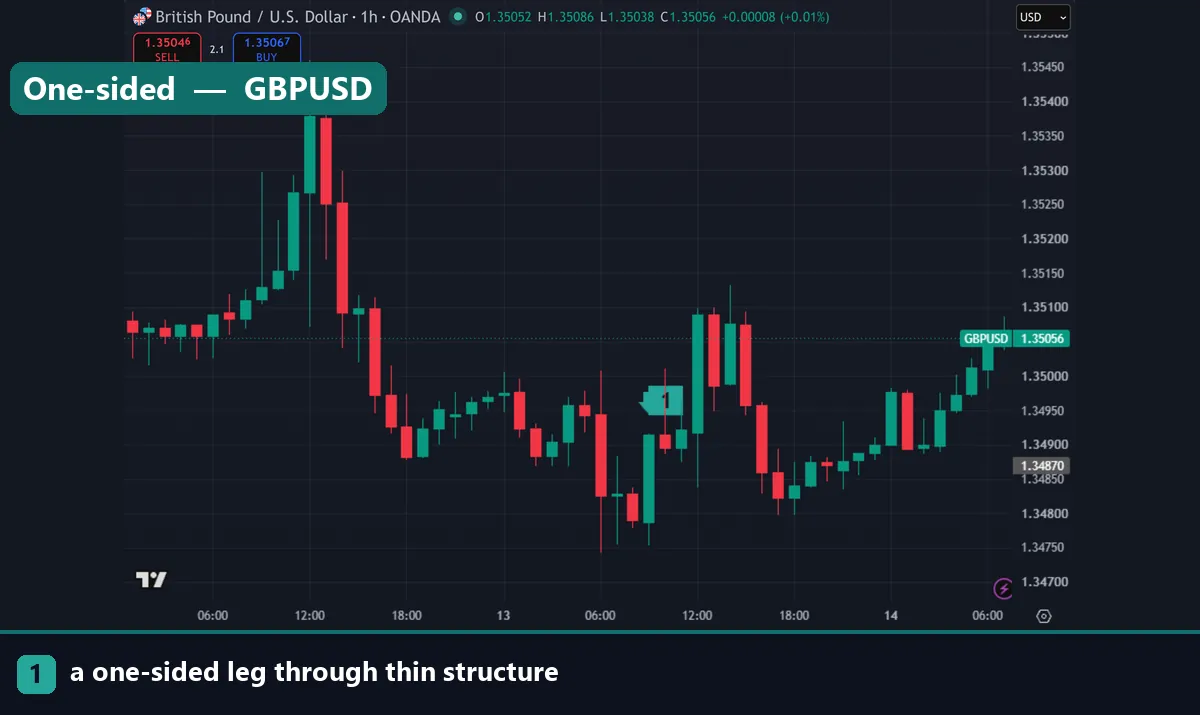
Traders muddle these two constantly, and they are close to opposites.
A liquidity pool is a concentration of orders — clustered stops above an obvious high, for instance. It works like a magnet, because there is business to do there.
Low resistance liquidity is the empty corridor between pools. It is not a destination; it is the path.
The practical read combines both. Find where orders cluster, note that price tends to travel towards them, then ask whether the route is clear. A pool sitting above with a thin corridor leading to it is the configuration this framework looks for. Our guides on liquidity sweeps and liquidity traps cover the pool side.
Trading around it
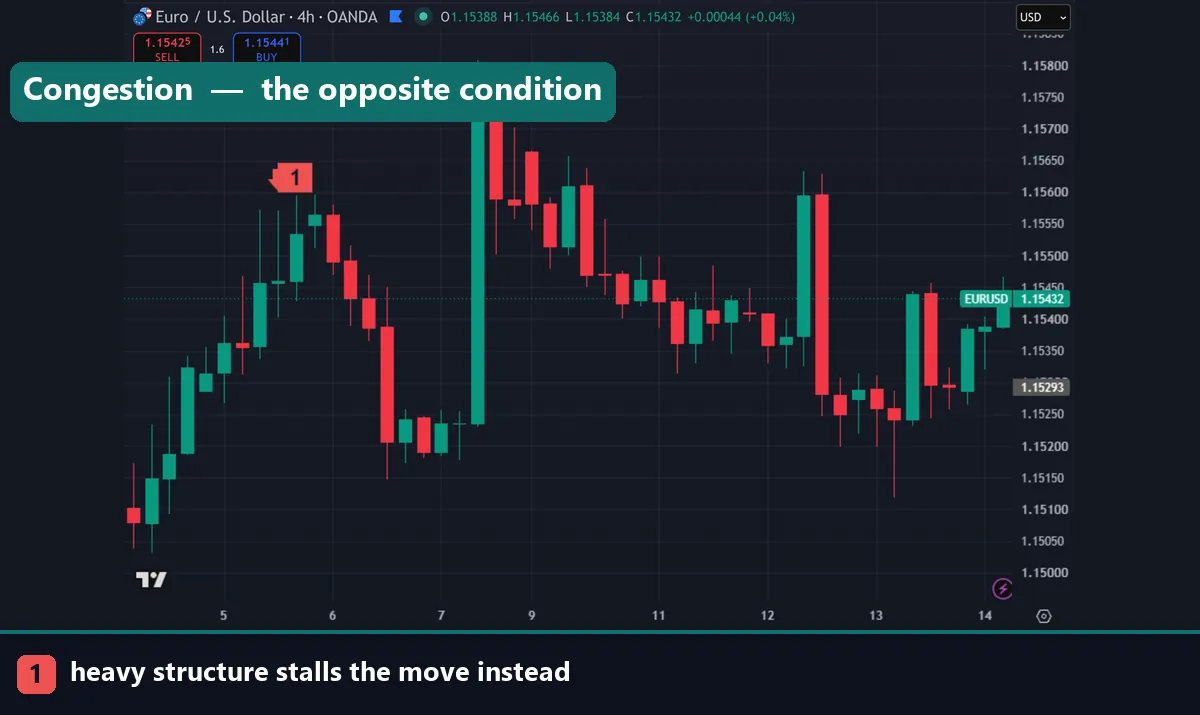
The framework answers two questions, and neither one is an entry signal.
Direction. If one side has a clear corridor and the other is dense with prior structure, the thin side is where a move has room. That biases which setups you are willing to take.
Targets. Once in a trade, a thin stretch ahead suggests holding for the far side of it rather than taking profit inside the empty space. The logical objective is the next area of concentrated orders, not an arbitrary pip count.
Entries still come from somewhere else — a level, a reaction, a structural break. Our ICT trading strategy guide covers how these pieces fit together, and the ATR stop loss guide handles the stop, which should sit where the read is wrong rather than just inside the corridor.
Download the complete indicator database
Put these concepts on your charts. One email unlocks the full library of 1,380+ indicators with compiled MT4 and MT5 files, plus my TradingView scripts. No paywall, no spam, unsubscribe any time.
Get free access to my indicator database
One email unlocks 1,380+ free MT4, MT5 and TradingView indicators — the complete library. No single-tool download; you get the whole database.
The honest limitation
This needs stating plainly, because the vocabulary sounds more precise than the evidence supports.
Retail traders cannot see the order book in forex. There is no central exchange, no consolidated depth, and your broker shows you its own feed. So when someone says an area has “low resistance liquidity”, they are inferring it from the shape of the chart, not observing resting orders.
That inference is reasonable. Price does move faster through areas it previously travelled quickly, and it does stall around levels it has respected before. But nobody reading a retail chart can verify the mechanism it describes, namely where orders sit.
Treat it as a way of reading structure with useful vocabulary, not as privileged information. Anyone claiming to see institutional order flow on a MetaTrader chart is describing an inference too.
The framework also fails in the same conditions everything else does. Scheduled news overrides structural reads entirely, and a thin corridor means nothing when a rate decision lands. Check the calendar first, as covered in our forex news factory guide.
A workable routine
Three steps keep it practical. First, mark the obvious pools: prior session highs and lows, equal highs, round numbers. Second, look at the space between price and those pools and judge whether the route is clear or congested. Third, take setups in the direction with room, and target the pool rather than the empty space.
Work on H1 and H4. On M1 and M5 almost everything looks thin because there is not enough history in view to judge congestion, which is how the concept gets over-applied.
Common mistakes
Four repeat. Treating the read as observed order flow rather than inference tops the list. Confusing the corridor with the pool comes second, which leads traders to target empty space instead of the level beyond it. Third, people apply it on fast timeframes where there is no structural context. Fourth, they use it as an entry trigger when it only informs direction and targets.
Where to go next
This sits inside a structural framework. Read market liquidity for the foundation, then liquidity sweep examples and liquidity traps for what happens at the pools. Our ICT trading strategy guide covers the wider method, and bearish FVG covers the imbalances that often mark the corridor. For further reading, Investopedia explains liquidity at Investopedia, and the market liquidity article on Wikipedia covers the academic framing.
FAQ
What is low resistance liquidity?
A stretch of chart where few resting orders stand in the way, so price can travel a long distance quickly. It describes the empty corridor between areas where orders cluster.
How is it different from a liquidity pool?
A pool is a concentration of orders that attracts price, such as stops above an obvious high. Low resistance liquidity is the clear path between pools. One is the destination, the other is the route.
How do I identify it on a chart?
Look for structure that has already been swept, a single directional leg with shallow pullbacks, a price band the market crossed only once, and a long distance to the next obvious level.
Can I actually see the orders?
No. Forex has no central order book, and your broker shows only its own feed. You infer the read from chart shape rather than seeing it. Treat it as structural reading, not order flow.
Which timeframe suits this reading?
H1 and H4. On M1 and M5 nearly everything looks thin, because too little history sits on screen to judge congestion.
Is it a trade signal?
No, it informs direction and target selection while the entry comes from a level or reaction. Trading involves risk, results are not guaranteed, and past performance is not indicative of future results.

About the author
Written by Dominic Walsh, a Forex trader and MT4/MT5 indicator, Expert Advisor and script developer. Every tool on forexmt4systems.com is tested on live charts before release and ships with ready-to-use compiled MT4 (.ex4) and MT5 (.ex5) files. Learn more about the trader and developer behind this site.
How we build, test and correct every tool: Editorial & Testing Policy. Trading carries risk; see the disclaimer.