
A bearish FVG is a three-candle imbalance that leaves a band of price above the market which nobody traded through on the way down. Traders mark it because price often rallies back into that band later and finds sellers there. This guide covers the exact definition, how to draw one without misplacing it, why bearish gaps behave differently from bullish ones, and which of the many you will find are worth trading.
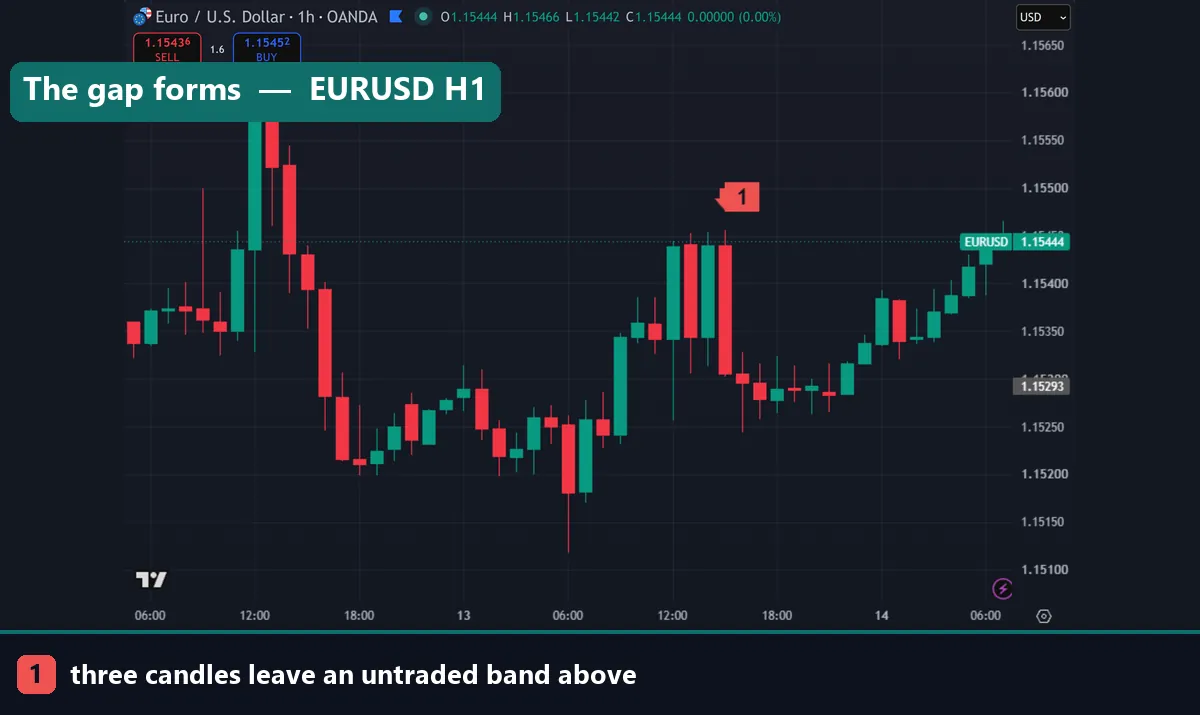
The bearish FVG three-candle definition
Take three consecutive candles. Compare the low of the first with the high of the third. If the third candle’s high finishes below the first candle’s low, the space between those two prices was skipped, and that space is a bearish fair value gap.
The middle candle creates it. Price fell far enough and fast enough during that bar that the market never traded back up through the region.
The most common drawing error is marking the middle candle’s body. The zone is defined by the outer two candles — first candle’s low, third candle’s high — and getting this wrong puts your levels in the wrong place entirely. The bullish version is the exact mirror, covered in our bullish FVG guide.
How price interacts with the zone
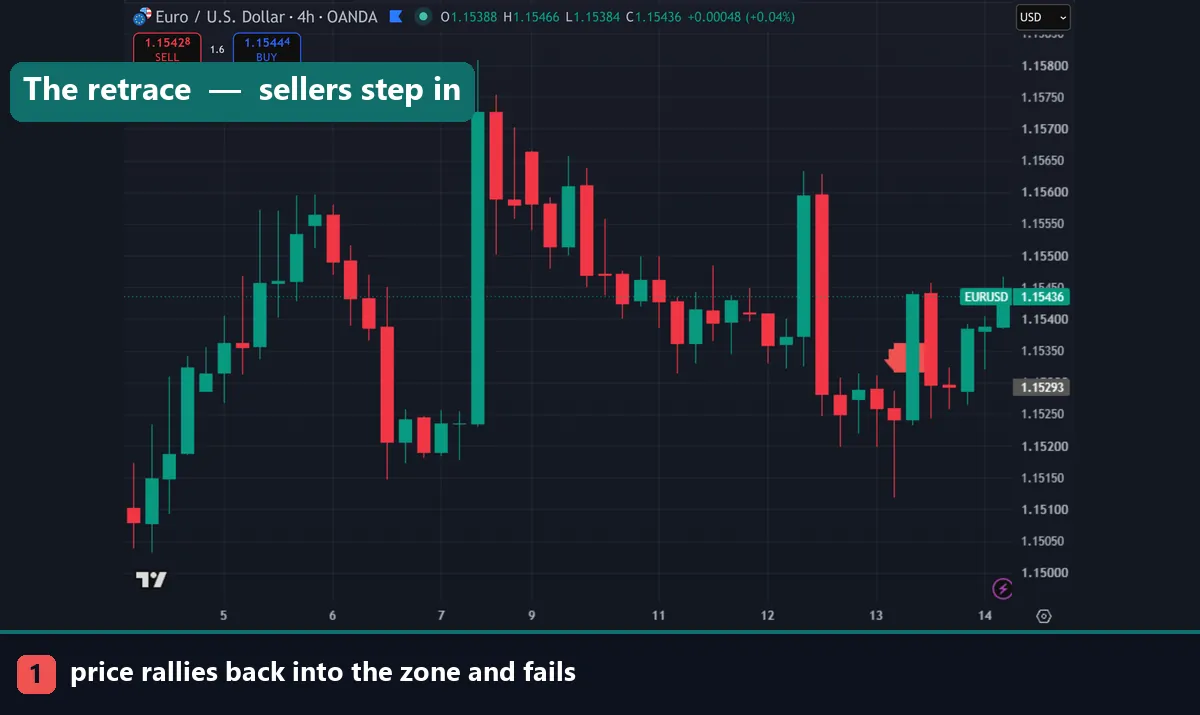
Three outcomes cover almost everything you will see, and knowing which you are watching decides whether there is a trade.
Partial fill and rejection. Price rallies into the lower portion of the zone, often reaching the midpoint, then turns back down. This is the textbook case and the midpoint is watched closely for exactly that reason.
Full fill and rejection. Price trades all the way to the far edge before turning. Still valid, though it needs a wider stop and more patience than the first case.
A close through. Price does not respect the zone and closes above it. The bearish reading is now wrong, and the zone tends to flip into support. That inversion is covered in our IFVG vs FVG guide.
The line between the second and third outcomes is the whole game, and it comes down to closes. A wick through the zone is noise; a close beyond it changes the meaning.
Why bearish gaps behave differently
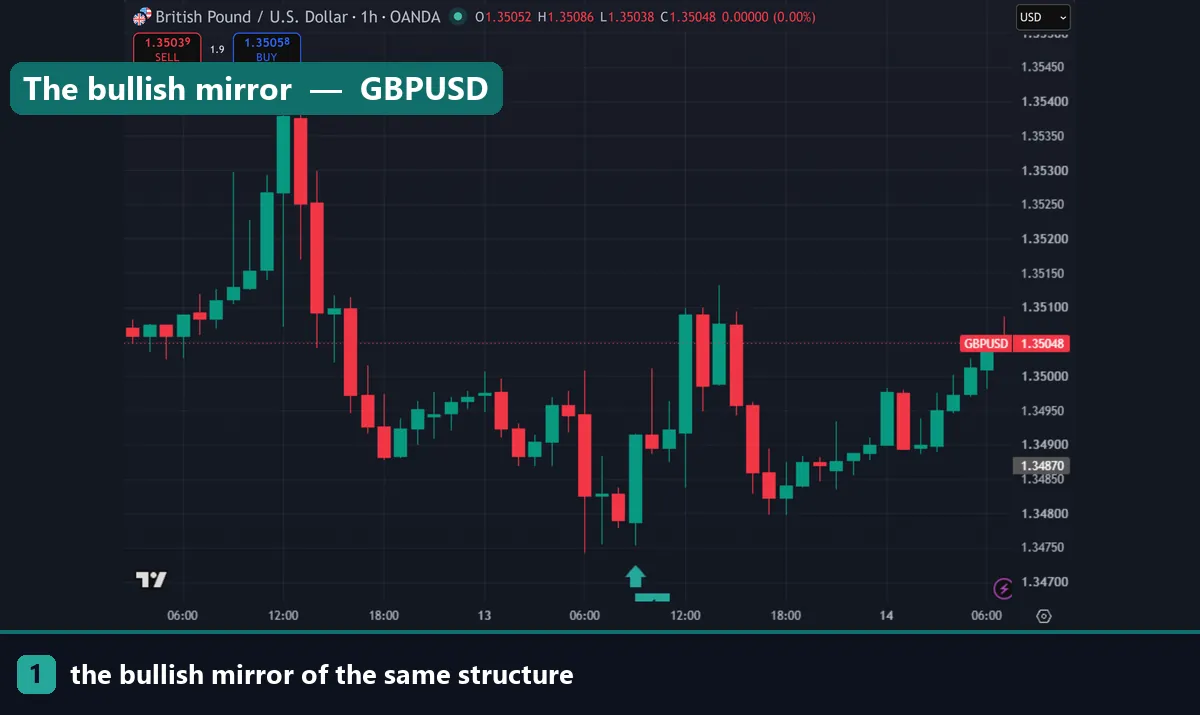
Bullish and bearish gaps are geometric mirrors, yet they do not behave identically, and the reason is worth understanding.
Markets tend to fall faster than they rise. Selling is often driven by risk reduction rather than opinion, so declines come in sharper, more compressed moves. That produces bearish gaps on steeper candles, and it means the rally back into the zone frequently arrives with more force than the equivalent pullback into a bullish gap.
Two practical consequences follow. A tight stop placed just above a bearish gap gets taken more often than the bullish equivalent, so size the stop from volatility rather than from the zone edge — our ATR stop loss guide covers the method. And the reaction, when it comes, tends to be quicker, which argues for taking partial profit earlier.
Filtering the ones worth trading
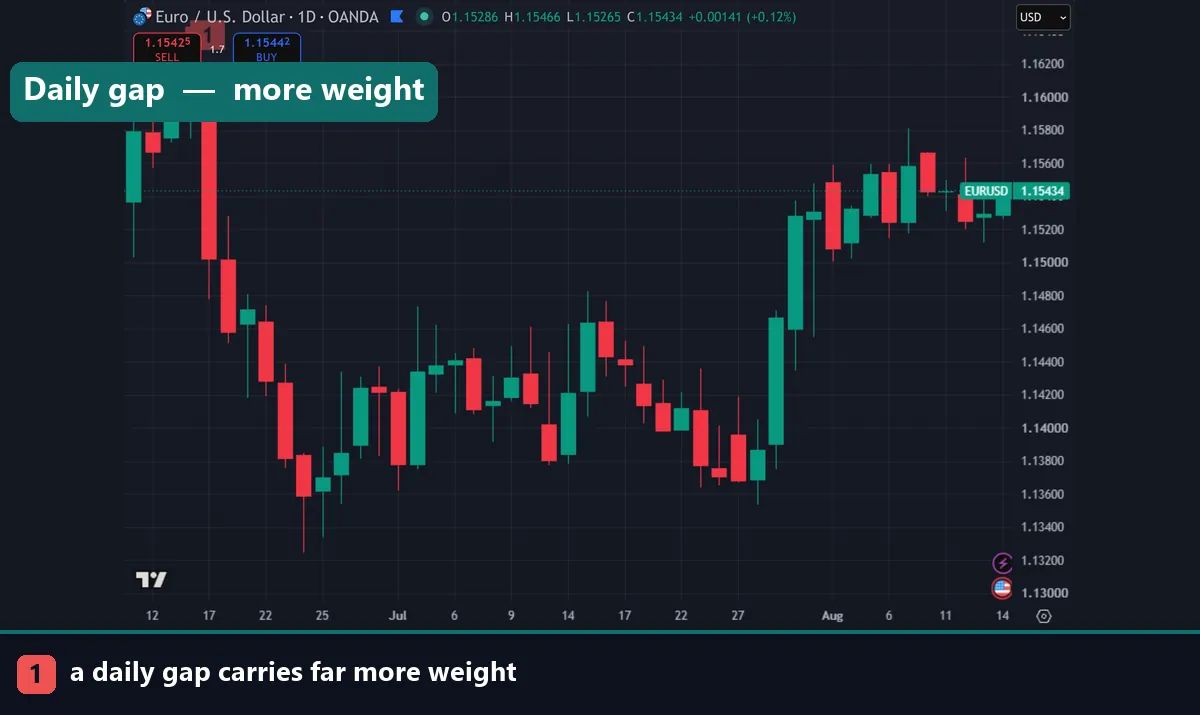
Mark every three-candle imbalance and your chart becomes unusable within minutes. Four filters cut the list down.
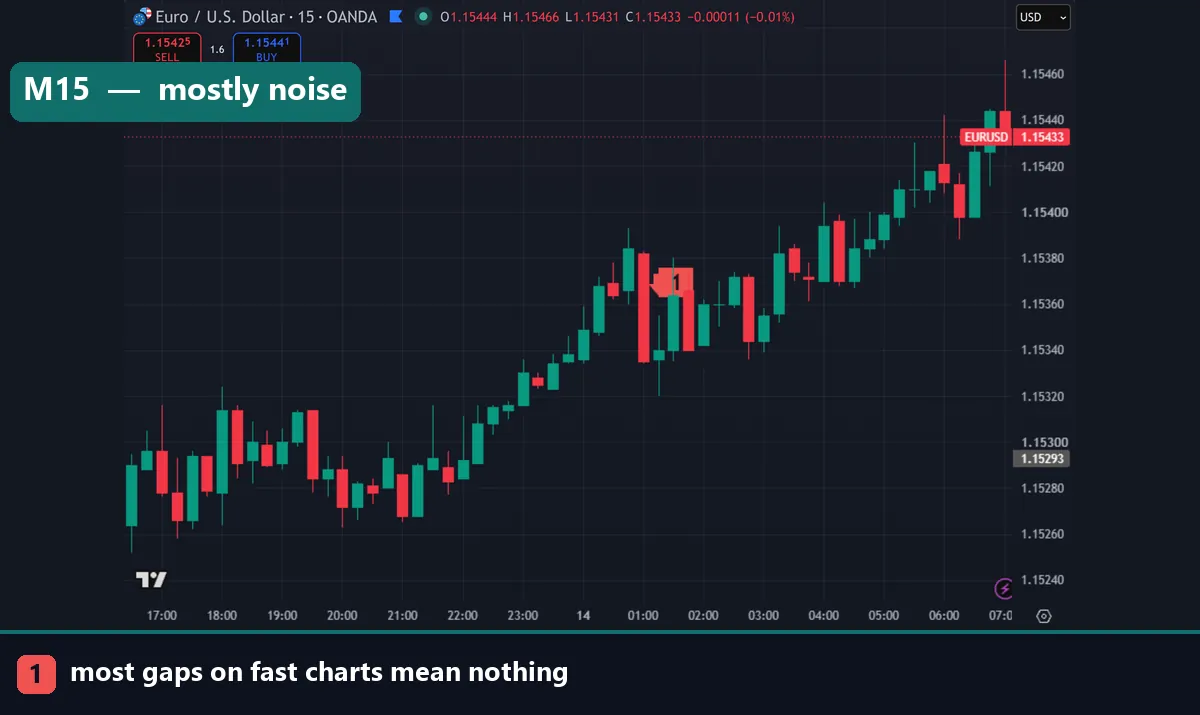
Timeframe. H4 and daily gaps attract far more attention than anything on M1. Mark the higher timeframe first, then drop down for entries.
Size. The gap should be a meaningful fraction of the recent range. Two pips of drift on EURUSD is not displacement.
The move that created it. A gap left by a strong impulse away from a level carries weight. One formed inside a quiet range usually does not.
Location. A gap at a prior swing high, a session boundary or an untested level matters far more than one floating mid-range. Our price action trading guide covers reading that structure.
Download the complete indicator database
Put these concepts on your charts. One email unlocks the full library of 1,380+ indicators with compiled MT4 and MT5 files, plus my TradingView scripts. No paywall, no spam, unsubscribe any time.
Get free access to my indicator database
One email unlocks 1,380+ free MT4, MT5 and TradingView indicators — the complete library. No single-tool download; you get the whole database.
Trading a bearish fair value gap
Two entry styles cover most approaches. A limit entry places a sell order inside the zone, commonly at the midpoint, accepting that some gaps get run straight through. A confirmation entry waits for price to reach the zone and print a rejection candle first, which costs a few pips and avoids many failures.
The stop belongs above the zone, not inside it. A close above the gap invalidates the reading entirely, so a stop placed within the zone will be hit by ordinary noise while the idea is still alive. The position sizing calculator converts that distance into lots.
Targets usually sit at the prior swing low or the next zone below. Many traders take partial profit at the first objective and trail the rest, since the initial reaction is often sharp and then fades.
The honest limitations
Most gaps do nothing. On any chart you will find dozens, and only a fraction produce a clean reaction. Selection is doing more work than the pattern.
Identification is also less objective than it looks. Two traders mark different zones on the same chart depending on the timeframe they read and the minimum size they accept, so any claimed success rate for the pattern is really a measurement of one person’s filters.
And a gap is a location, not a signal. It says where to pay attention. The decision to sell still needs trend context, a level, and a reaction — used alone it produces a stream of trades against the prevailing move.
Common mistakes
Four repeat. Marking the middle candle’s body rather than the outer candles’ extremes tops the list. Trading every gap on every timeframe comes second, which buries the chart. Third, traders place stops inside the zone and get shaken out of setups that were still valid. Fourth, they treat a normal fill as a failure, when only a close through the far side changes the reading.
Where to go next
Gaps work inside a structural method rather than alone. Read the bullish FVG guide for the mirror image, then IFVG vs FVG for what happens when one fails. Our ICT trading strategy guide gives the wider framework, and liquidity sweep examples cover the move that often creates a gap. To add a custom gap indicator, follow how to install MT4 and MT5 indicators. For further reading, Investopedia explains price gaps at Investopedia, and the order book article on Wikipedia covers the mechanics behind unfilled orders.
FAQ
What is a bearish FVG?
A three-candle imbalance where the third candle’s high sits below the first candle’s low, leaving an untraded band above price. Traders mark it and watch for sellers when price rallies back into it.
How do I draw one correctly?
Use the low of the first candle and the high of the third as the boundaries. Marking the middle candle’s body instead is the most common error and places the zone at the wrong prices.
Is a bearish gap different from a bullish one?
Geometrically they are mirrors, but markets fall faster than they rise, so bearish gaps form on sharper candles and the rally back into them often arrives with more force.
What happens when a bearish gap fails?
Once price closes above the zone the bearish reading is wrong, and the same zone tends to act as support instead. That flipped zone is an inverse fair value gap.
Which timeframe should I mark them on?
H4 and daily gaps carry the most weight. Mark those first, then use H1 or M15 for entries. Gaps on M1 and M5 form constantly and rarely matter on their own.
Does price always return to fill the gap?
No. Many are never revisited and plenty get closed straight through, so treat the zone as a place worth watching rather than a level price must reach. Trading involves risk, results are not guaranteed, and past performance is not indicative of future results.

About the author
Written by Dominic Walsh, a Forex trader and MT4/MT5 indicator, Expert Advisor and script developer. Every tool on forexmt4systems.com is tested on live charts before release and ships with ready-to-use compiled MT4 (.ex4) and MT5 (.ex5) files. Learn more about the trader and developer behind this site.
How we build, test and correct every tool: Editorial & Testing Policy. Trading carries risk; see the disclaimer.