
Is the pound stronger than the dollar? If you mean what one unit buys, yes. On 23 October 2026 one British pound bought about 1.338 US dollars, and in our data it bought more than one dollar at all 300 monthly closes since November 2001. Yet that number answers only one of three questions people mean by “stronger”. This guide separates unit value, trend and purchasing power, then checks each against our own charts and counts.
What a stronger pound actually means
Unit value. How many dollars does one pound buy? Today about 1.34. On this reading the pound wins, and it has won at every month-end in our 25-year window.
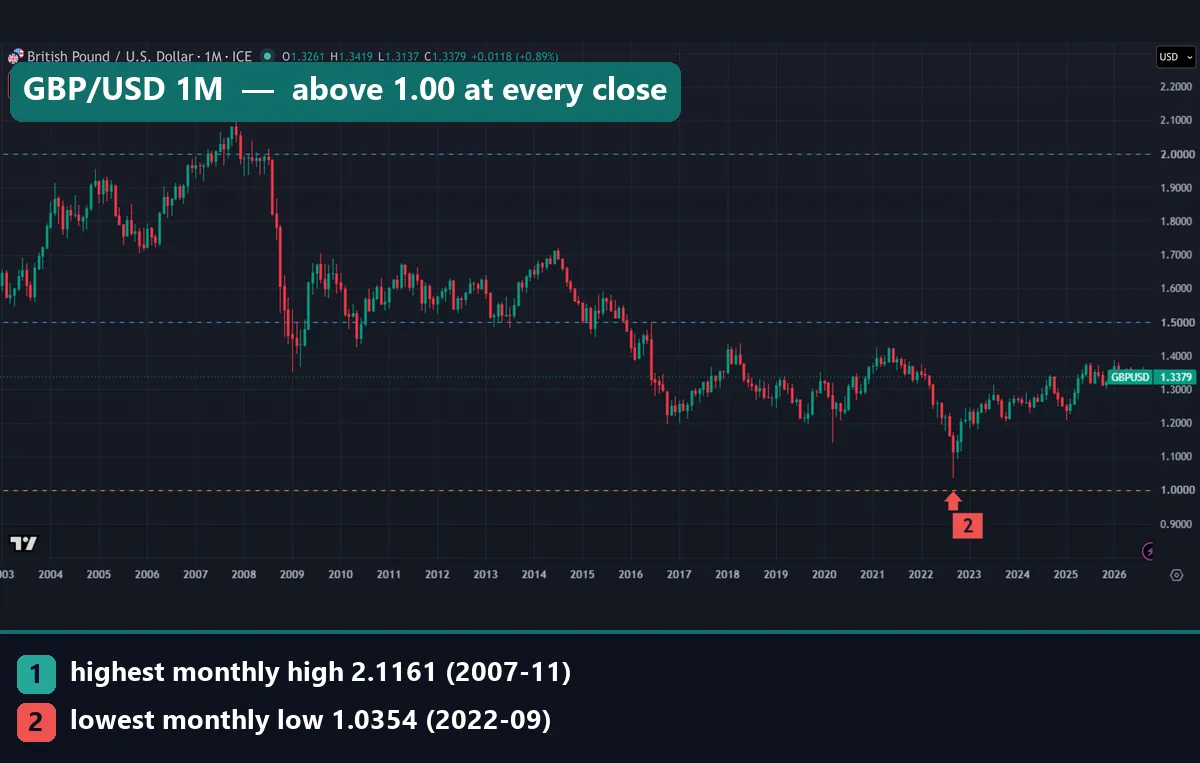
Trend. Is the pound gaining or losing against the dollar? Here the answer flips. The pound peaked at 2.1161 dollars in November 2007, so at about 1.338 it has lost roughly 37% of its dollar value since then.
Purchasing power. What does a pound buy in a British shop, compared with a dollar in an American one? An exchange rate cannot tell you. Statisticians use purchasing power parities instead, and the World Bank’s International Comparison Program produces them to compare economies in a common currency.
So the honest short answer has two parts. Per unit, a pound is worth more than a dollar. Over the last two decades, however, the dollar has been the better performer.
How the GBP/USD quote works
An exchange rate is the price of one money counted in another. In GBP/USD the pound is the base currency and the dollar is the quote currency:
GBP/USD = US dollars paid for 1 British pound
Turn the fraction over and you get the price of a dollar in pounds:
USD/GBP = 1 ÷ (GBP/USD)
At 1.3381, one dollar buys about 0.747 pounds. Dealers simply put the pound first by habit, and many call the pair “cable”. Our guide to trading slang explains where that nickname came from.
The pound sterling article on Wikipedia calls sterling the oldest currency in continuous use, split into 100 pence since 1971. It also ranks it fourth by trading volume in 2025, after the dollar, the euro and the yen. That depth is one reason GBP/USD sits among the major currency pairs.
A percentage change follows (new rate ÷ old rate - 1) × 100. Traders also count moves in pips. On this pair a pip in forex terms is 0.0001, so 1.3300 to 1.3400 equals 100 pips.
What moves the pound against the dollar
Interest rates. Higher yields tend to attract capital, so traders compare what Bank of England and Federal Reserve policy pays. Our page on the interest rate differential walks through that link.
Inflation. The Bank of England’s page on inflation and the 2% target explains that the Government sets the target and the Bank works to meet it. When UK prices run faster, markets guess how hard the Bank will respond. Our guide to how inflation affects forex follows that chain.
The dollar side. Any GBP/USD move can start in America. If the dollar rises against everything, the pound falls on this chart even when nothing changed in Britain. The dollar index in forex helps you spot those broad moves.
Fed decision days test that last point. In our MetaTrader 4 history, the GBP/USD range on those days was only 1.16 times a normal Wednesday’s. That was the smallest effect among the six dollar majors we checked, while EUR/USD came in at 1.49 times. So the pound reacts to the Fed, but its daily range widened less than its peers did.
How we tested
All TradingView figures come from one session on 23 October 2026, read from a TradingView web chart. The core series is FX_IDC:GBPUSD monthly, from November 2001 to October 2026: 300 bars, with ICE named as the source in the chart header. For close-ups we used OANDA:GBPUSD weekly and daily. For comparison we added FX_IDC:EURUSD monthly and OANDA:GBPJPY daily.
A month counts as “above 1.00” when its close sits above 1.0000, and the same rule applies at 1.50 and 2.00. Record highs and lows come from monthly highs and lows, so they include intraday spikes. The October 2026 bar had not closed on capture day, so its “close” is the price at the time of the pull. We drew both data charts ourselves from those closes.
The Fed-day test used Capital Point Trading’s MetaTrader 4 history, build 1471, with daily bars from June 2018 to August 2026 and decision dates from federalreserve.gov. Our editorial testing policy explains how we choose data and report its limits.
Test settings and headline numbers
No indicator inputs apply here. What matters is the feed, the timeframe and the threshold behind each count.
| Setting or measure | Value |
|---|---|
| Main symbol and timeframe | FX_IDC:GBPUSD, monthly |
| Window | November 2001 to October 2026 (300 monthly bars) |
| Monthly closes above 1.00 | 300 of 300 |
| Monthly closes above 1.50 | 154 of 300 (51.3%) |
| Monthly closes above 2.00 | 6 of 300 |
| Highest monthly high | 2.1161 (November 2007) |
| Lowest monthly low | 1.0354 (September 2022) |
| Latest monthly close | 1.3382 (October 2026, bar still open) |
| Latest daily close | 1.3381 (23 October 2026) |
| Close-up charts | OANDA:GBPUSD weekly and daily |
| Comparison charts | FX_IDC:EURUSD monthly, OANDA:GBPJPY daily |
The 300-of-300 figure counts month-end prices only. Even so, the lowest intraday print in the window, 1.0354, stayed 354 pips above 1.00.
Reading GBP/USD on a chart
The vertical axis shows dollars per pound, so a rising line means the pound is gaining. On our monthly capture at the top, the yellow dashed line marks 1.00 and the blue dashed lines mark 1.50 and 2.00. Marker 1 sits on the November 2007 high of 2.1161. Marker 2 points at the September 2022 low of 1.0354, the closest the pair came to the yellow line. After mid-2016, no monthly bar reaches the 1.50 line.
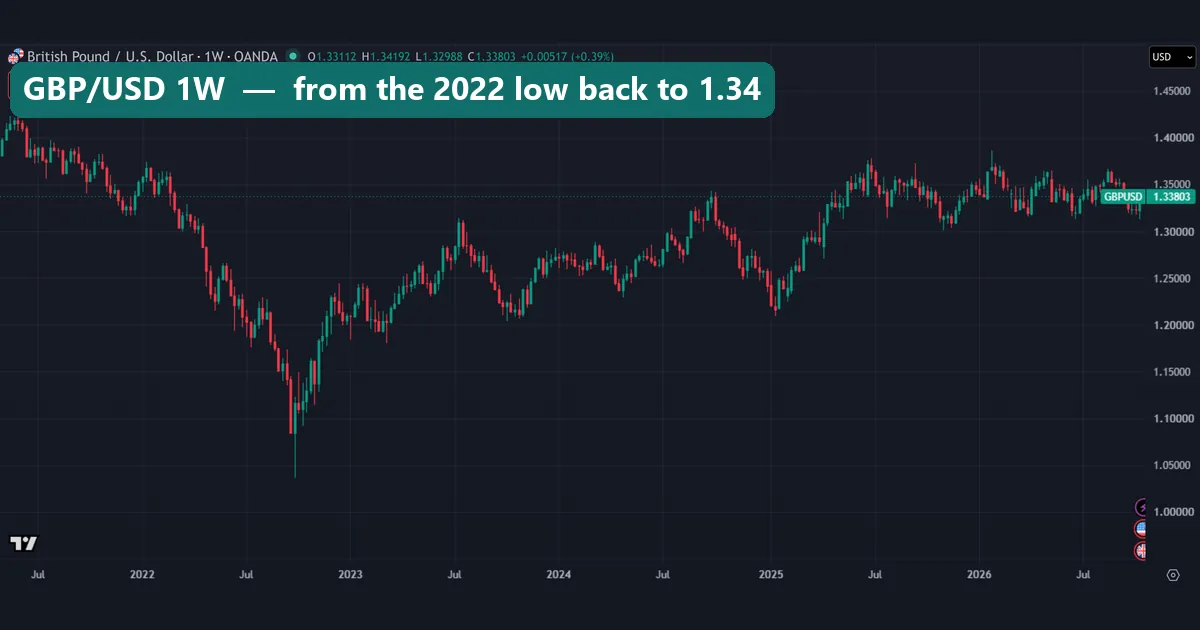
The weekly OANDA chart covers mid-2021 to October 2026. The bars start above 1.40, then slide through 2022 into a long wick below 1.05. Recovery came in steps. Dips near 1.21 in late 2023 and early 2025 held well above that low. Since mid-2025, most weekly bars have stayed between about 1.30 and 1.38.
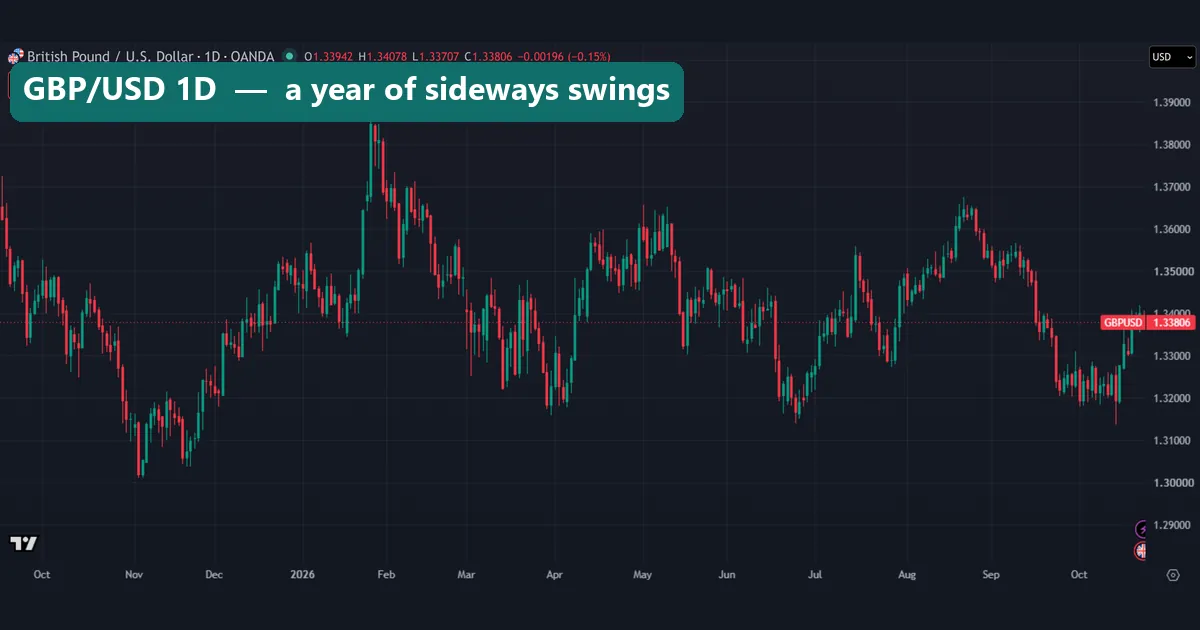
The daily chart covers the twelve months to 23 October 2026. The pound sank to near 1.30 in early November 2025, then spiked to about 1.39 at the end of January. After that it moved between roughly 1.31 and 1.37. The last bar opened at 1.33942 and closed at 1.33806, with a range of 37.1 pips. None of these swings came close to parity.
Worked example: 1,000 pounds at the top, the bottom and today
These conversions use mid-market quotes from our data. A bank or broker would add its spread on top.
November 2007, at 2.1161. 1,000 pounds converted to 2,116.10 dollars. Going the other way, 1,000 dollars bought only about 472.57 pounds.
September 2022, at 1.0354. The same 1,000 pounds fetched just 1,035.40 dollars, while 1,000 dollars bought about 965.81 pounds. Even then, a pound still bought slightly more than a dollar.
23 October 2026, at 1.3381. Today 1,000 pounds convert to 1,338.10 dollars, and 1,000 dollars buy about 747.33 pounds.
From top to bottom the rate fell 51.1%, or 10,807 pips. From the 2022 low it then climbed about 29.2%. Measured from the 2007 peak, though, the pound still sits about 36.8% lower. So “stronger per unit” and “weaker than it was” are both true.
Gold offers a neat cross-check. In October 2026 our FX_IDC monthly data priced an ounce at 4,022.7 dollars and at 3,006.39 pounds. Divide the first by the second and you get 1.338, the same GBP/USD rate. Two prices for one asset imply the exchange rate between the two currencies.
Is the pound stronger than the dollar every year?
Year-end prices make the long story easier to follow. Our first data chart shows the December close for each year from 2001 to 2025.
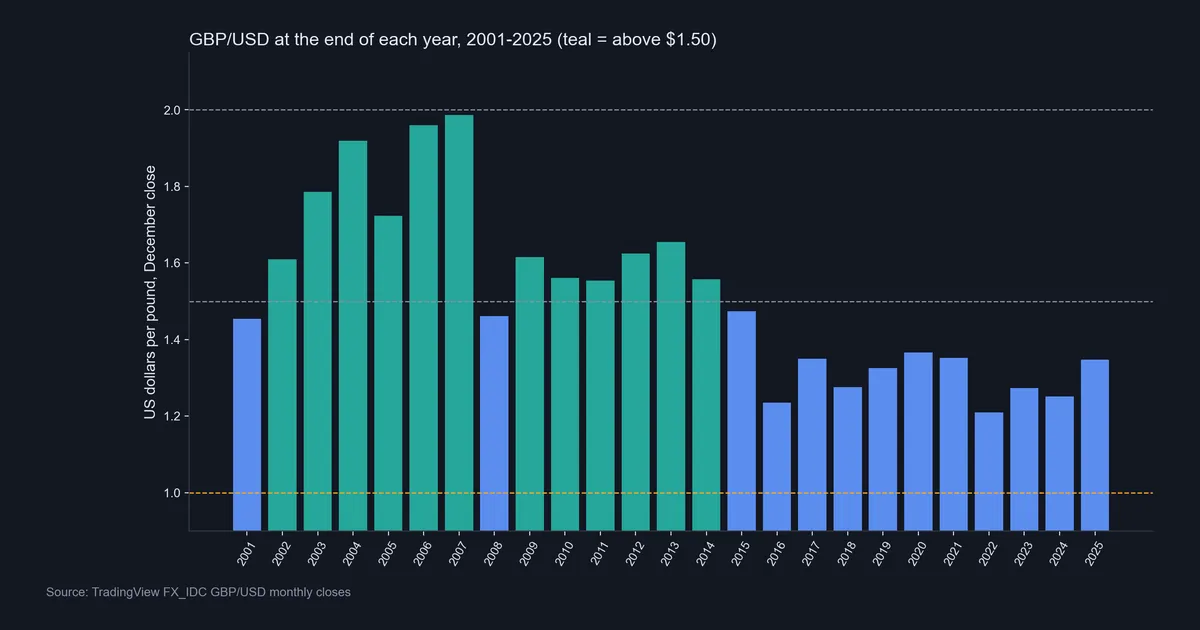
Every bar clears the yellow 1.00 line. The teal bars mark year-ends above 1.50: 2002 to 2007, then 2009 to 2014, twelve in all. The highest is 2007 at 1.9868. By contrast, 2022 ended at just 1.2094, about 39% lower. No year since 2014 has ended above 1.50, and 2025 closed at 1.3472.
Our second chart sorts all 300 monthly closes into price bands. The busiest band is 1.25 to 1.50, with 122 months. Next come 1.50 to 1.75 with 99 and 1.75 to 2.00 with 49. Only 24 months closed between 1.00 and 1.25, and just 6 above 2.00.
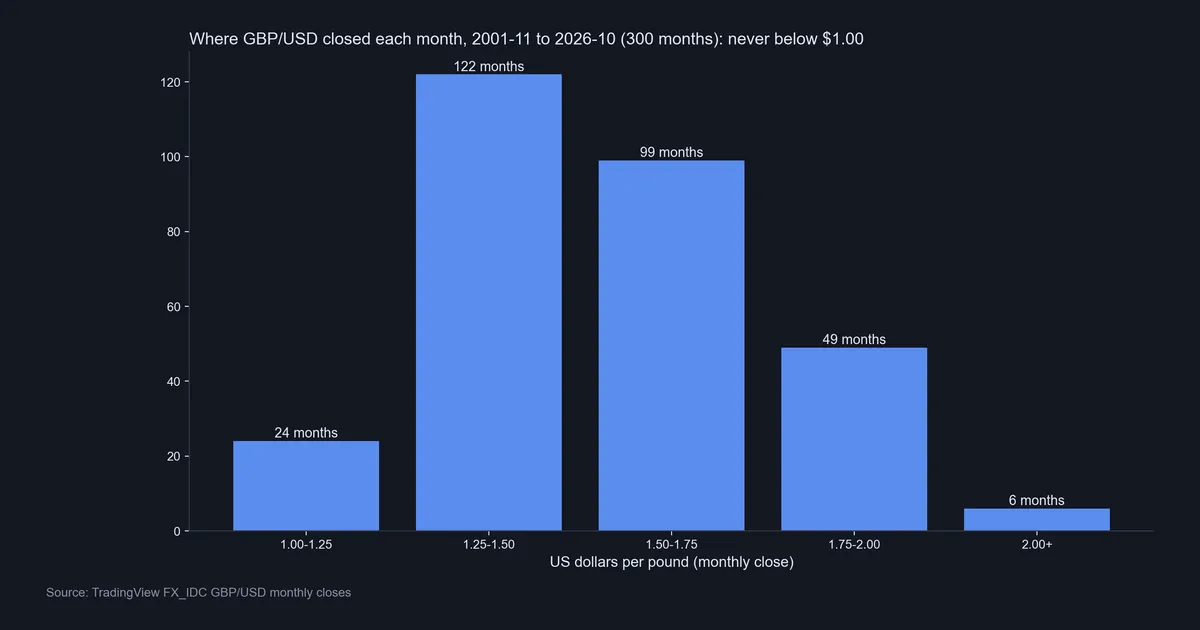
Read together, the charts show a level that reset lower twice, after 2008 and again after 2016, without ever crossing below the dollar. The two biggest monthly falls in our data were October 2008, down 9.9%, and June 2016, the month of the Brexit referendum, down 8.3%.
Download the complete indicator database
Put these concepts on your charts. One email unlocks the full library of 1,380+ indicators with compiled MT4 and MT5 files, plus my TradingView scripts. No paywall, no spam, unsubscribe any time.
Get free access to my indicator database
One email unlocks 1,380+ free MT4, MT5 and TradingView indicators — the complete library. No single-tool download; you get the whole database.
Where it fails: what the per-unit answer leaves out
Unit size is arbitrary. A higher price per unit says nothing about the size or health of an economy. If Britain swapped ten old pounds for one new pound, GBP/USD would read about 13.38 the next morning, yet no wage or rent would change. The Kuwaiti dinar is the most valuable currency in the world per unit, though Kuwait runs a far smaller economy than the United States.
It hides the trend. The pound kept its per-unit lead while losing about 37% of its dollar value from the 2007 peak.
It ignores what money buys. Measured in gold, both currencies shrank. From May 2008 to October 2026 the pound lost 85.1% of its gold purchasing power and the dollar 78.0%. Gold swings hard, so treat that as one yardstick, not a full inflation measure. Still, on it the dollar held up better.
One pair cannot rank currencies. A GBP/USD fall may reflect a strong dollar, a weak pound, or both. You need several pairs, or a currency strength meter, to tell which side moved.
Sources differ. The Federal Reserve’s H.10 historical rates for the pound list one rate per business day from January 2000. That series bottoms at 1.0703 on 26 September 2022, about 349 pips above our FX_IDC low, and peaks at 2.1104 on 8 November 2007. Neither source is wrong; each samples prices in its own way.
Strong against whom? The pound next to the euro and the yen
Strength only means something against a named rival, and the pound looks different against each one.
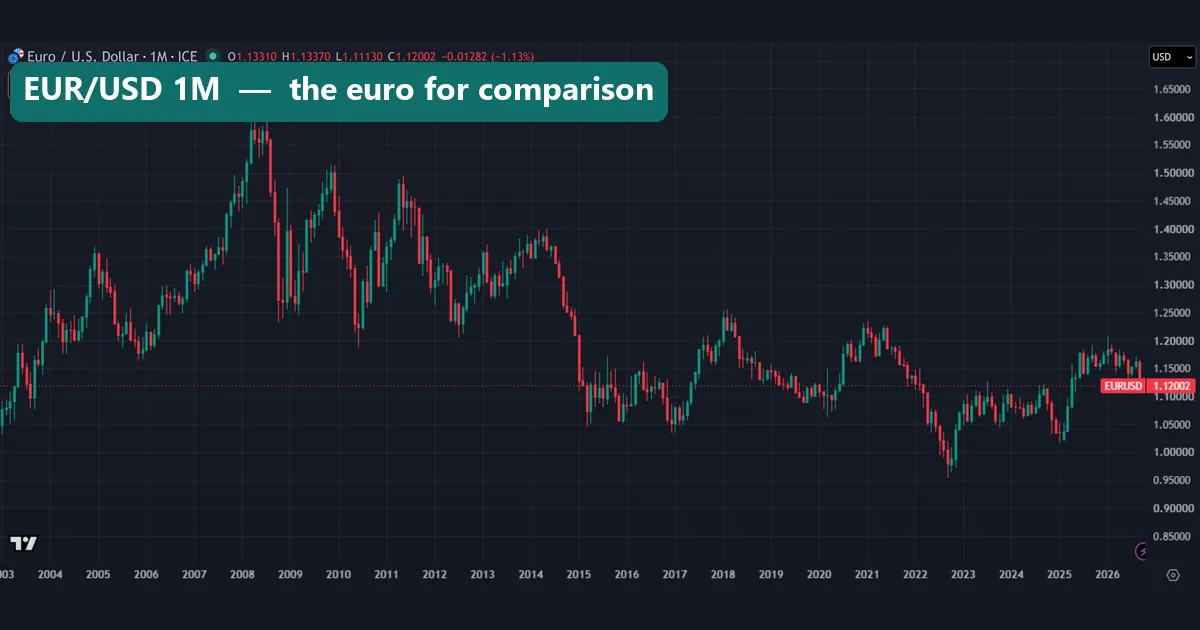
Start with the euro. Our FX_IDC EUR/USD monthly chart shows it dipping below 1.00 in 2022, which the pound never did on a monthly close. Our earlier count found 15 euro month-ends under parity since 2001. On capture day the euro read 1.12002 and the pound 1.3381, so one pound bought about 1.19 euros. In October alone the euro lost 1.13% against the dollar, while the pound gained 0.89%. Our guide on whether the euro is stronger than the dollar runs the same tests on that pair.
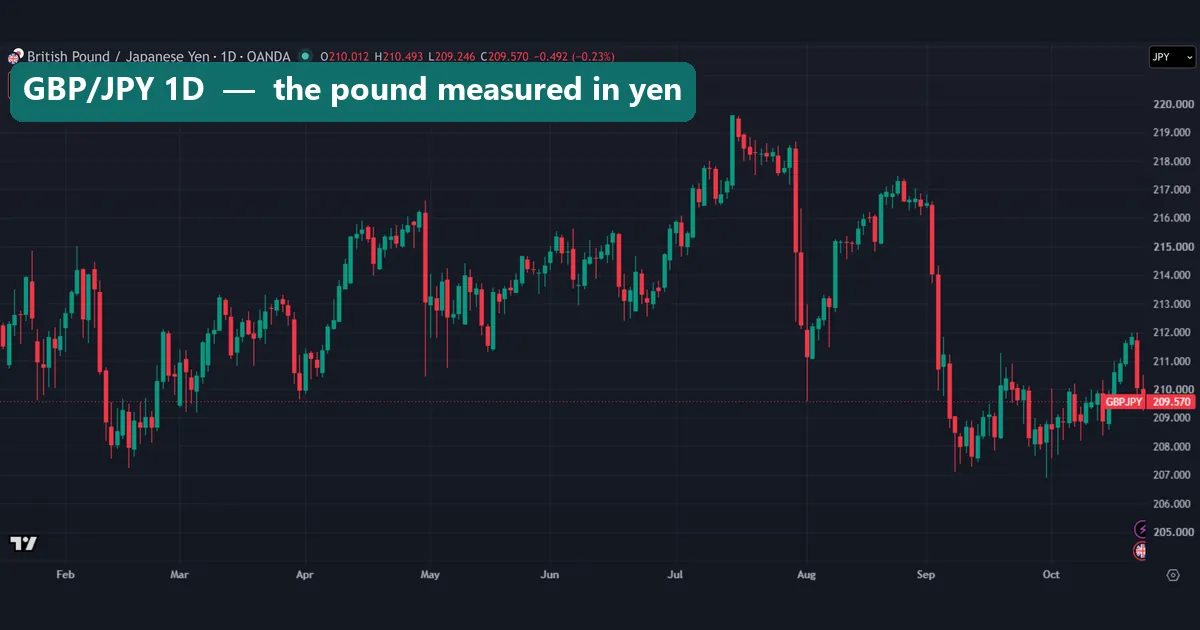
The yen tells a sharper story. From February to October 2026, our OANDA GBP/JPY daily chart priced a pound between about 207 and 220 yen, with 209.570 at capture. From late January 2021 to mid-October 2026, our weekly data show the pound down 2.7% against the dollar but the yen down 33.8%. Put together, a pound bought roughly 47% more yen at the end than at the start.
So the pound buys more than a dollar, more than a euro and over 200 yen, yet far fewer dollars than in 2007. That is why traders check several pairs before calling a currency strong. Our overview of the G10 currencies puts all ten side by side.
Common mistakes when comparing the pound and the dollar
1. Reading the rate as an economic scoreboard. A rate of 1.34 measures unit price, not growth, jobs or living standards. A fall in the rate does not mean the economy shrank by the same amount.
2. Mixing up the quote direction. 1.3381 dollars per pound and 0.747 pounds per dollar describe one market. Flip them by mistake and a gain looks like a loss. Our currency converter catches that error.
3. Treating 1.00 as a floor. Parity held at every monthly close in our data, but the 2022 low came within 354 pips of it. The euro showed in 2022 that a long-held level can still break.
4. Judging from one wick or one feed. The FX_IDC and Fed lows for September 2022 differ by about 349 pips. Before you quote a record, check whether it is a close or an intraday print, and which source it came from.
Where to go next
For the other end of the unit-value scale, read our guide to the weakest currency in the world. Then use our interest rate tracker to follow the central bank rates behind GBP/USD. To check our numbers, start with the Fed’s H.10 history and the Bank of England’s inflation page linked above, since both are primary sources.
FAQ: is the pound stronger than the dollar?
Is one pound worth more than one dollar today?
Yes. On 23 October 2026 the FX_IDC daily close was 1.3381, so one pound bought about 1.34 dollars.
Has the pound ever been worth less than a dollar?
Not in our data. All 300 monthly closes since November 2001 sat above 1.00, and the lowest monthly low was 1.0354. Our data do not reach back further, so we make no claim about earlier decades.
When was the pound strongest against the dollar?
In our FX_IDC data the highest monthly high was 2.1161, in November 2007. The Fed’s daily series peaks at 2.1104 on 8 November 2007.
Why is the pound worth more per unit if the US economy is larger?
Because unit size reflects history, not economic weight. A redenomination could change the quoted rate overnight without changing a single real price.
Is the pound stronger than the euro?
Per unit, yes. On capture day a pound bought about 1.34 dollars and a euro about 1.12, so one pound bought about 1.19 euros.
Is the dollar getting stronger than the pound?
Over the long run the dollar has gained, since the pound fell from 2.1161 in 2007 to about 1.338. Over the last twelve months, though, the pair moved sideways between roughly 1.30 and 1.39.
What does a GBP/USD rate of 1.34 mean?
It means one pound costs 1.34 US dollars. Flip the quote and one dollar costs about 0.747 pounds.
Can 25 years of GBP/USD data predict the next move?
No. These counts describe where the rate has been, not where it will go. Use them as background for your own plan, and size every position as if you could be wrong; results are not guaranteed; past performance is not indicative of future results.
Last updated: 23 October 2026.

About the author
Written by Dominic Walsh, a Forex trader and MT4/MT5 indicator, Expert Advisor and script developer. Every tool on forexmt4systems.com is tested on live charts before release and ships with ready-to-use compiled MT4 (.ex4) and MT5 (.ex5) files. Learn more about the trader and developer behind this site.
How we build, test and correct every tool: Editorial & Testing Policy. Trading carries risk; see the disclaimer.