
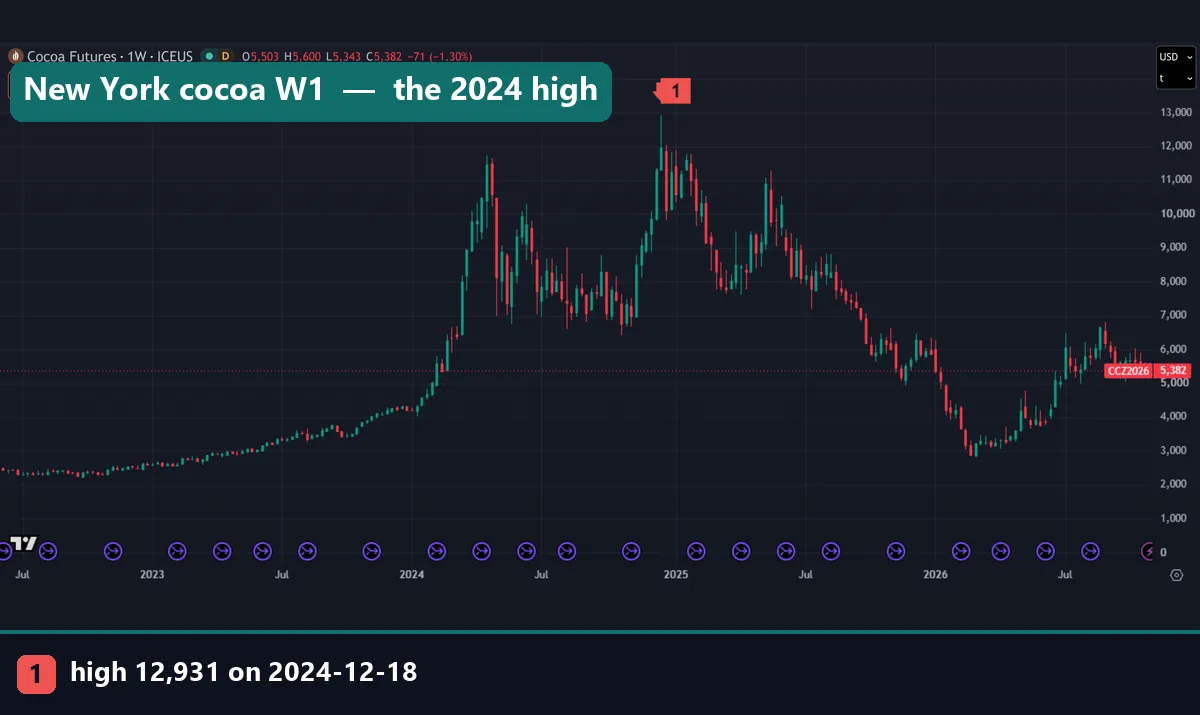
New York cocoa is the cocoa futures contract on ICE Futures U.S., priced in US dollars per tonne, and its chart changed character after 2023. It rose from 2,572 in January 2023 to a high of 12,931 on 18 December 2024, then fell 78.0% to 2,846 on 2 March 2026. This guide settles four things: what the contract is, what one point is worth, how far the daily range widened, and which big bars on a continuous chart you should not trust.
What New York cocoa actually is
New York cocoa is a futures contract, not a spot price. Each contract covers 10 metric tons. ICE’s Cocoa Futures contract page quotes it in dollars per metric ton and lists settlement as physical delivery. So a price of 5,438 means 5,438 US dollars per tonne, and one contract at that price covers $54,380 of cocoa.
The name also separates it from London cocoa, which trades on ICE Futures Europe and quotes in pounds per tonne. ICE’s delivery list for the New York contract starts with licensed warehouses in the Port of New York District. In short, these are two contracts in two currencies.
Cocoa is not a currency pair either. For the structural split, read our guide to the difference between forex and futures.
How the contract and the chart work
The contract math is short. The minimum move is $1 per tonne, which ICE states as $10 per contract. That gives one formula:
value change = price change per tonne x 10 tonnes x number of contracts
The chart takes more care. A futures contract expires, so no single contract can show you twenty years of history. Instead, the symbol we use, ICEUS:CC1!, joins front-month contracts into one line. TradingView’s help page on continuous futures says a 1! series follows the nearest expiry. It also calls these series synthetic and warns that rollover periods can cause sudden jumps or gaps.
That warning shapes every figure below. When the series moves to the next contract, the two contracts rarely share a price. So the line can step up or down although no single contract made that move. Our USOIL guide covers a related problem, where a CFD symbol and its future part ways.
What moves the price
Supply sits in few places. The World Bank’s July 2026 commodity note says Côte d’Ivoire and Ghana together produce about 60 percent of the world’s cocoa. So weather or disease in one region can reach a global price.
The rise has a sourced explanation. The ICCO’s November 2024 bulletin says weather, diseases and pests took a toll on the major producers in West Africa in the 2023/24 season. It put that season’s supply deficit at 478,000 tonnes. That figure was itself a revision, so treat it as an estimate.
The fall has one too. The same World Bank note ties the steep price drop to a sharp supply improvement for 2025-26, with favorable weather in West Africa and softer demand. Still, these are other people’s explanations. We did not test them against our price data, so read them as context and not as a signal.
How we tested
We pulled TradingView bars on 3 November 2026 and read the captures on the TradingView web chart. New York is ICEUS:CC1!, with daily bars from 17 December 2002 to 3 November 2026 and weekly bars from 11 October 1982 to 2 November 2026. London is ICEEUR:C1!, with daily bars from 6 February 2003 to 3 November 2026. Our captures use the D1 and W1 timeframes.
We measured three things. First, each day’s high minus low as a percentage of the close, then the median for each calendar year. Second, the largest close-to-close changes since 2023. Third, the correlation of daily changes between New York and London since 2023.
Everything here is prices only, before spread, commission, swap and financing. We placed no trades and ran no backtest. Also, the header row and price label on each capture show the live quote from capture day, so we never use them. Our editorial testing policy explains how we handle data like this.
Contract parameters
These details come from ICE’s contract page, linked above. ICE can change them, so check that page before you rely on any row.
| Parameter | New York cocoa (ICE Futures U.S.) |
|---|---|
| Contract size | 10 metric tons |
| Price quotation | Dollars per metric ton |
| Minimum move | $1.00 per metric ton, or $10.00 per contract |
| Contract months | March, May, July, September, December |
| Trading hours | 4:45 AM to 1:30 PM, New York time |
| Settlement | Physical delivery |
| Last trading day | One business day before last notice day |
| Group A growths | $160 per ton premium; includes Ghana, Ivory Coast, Nigeria |
| Group B growths | $80 per ton premium; includes Cameroon, Colombia, Venezuela |
| Group C growths | Delivered at par; includes Bolivia, Haiti, Malaysia |
Reading New York cocoa on a chart
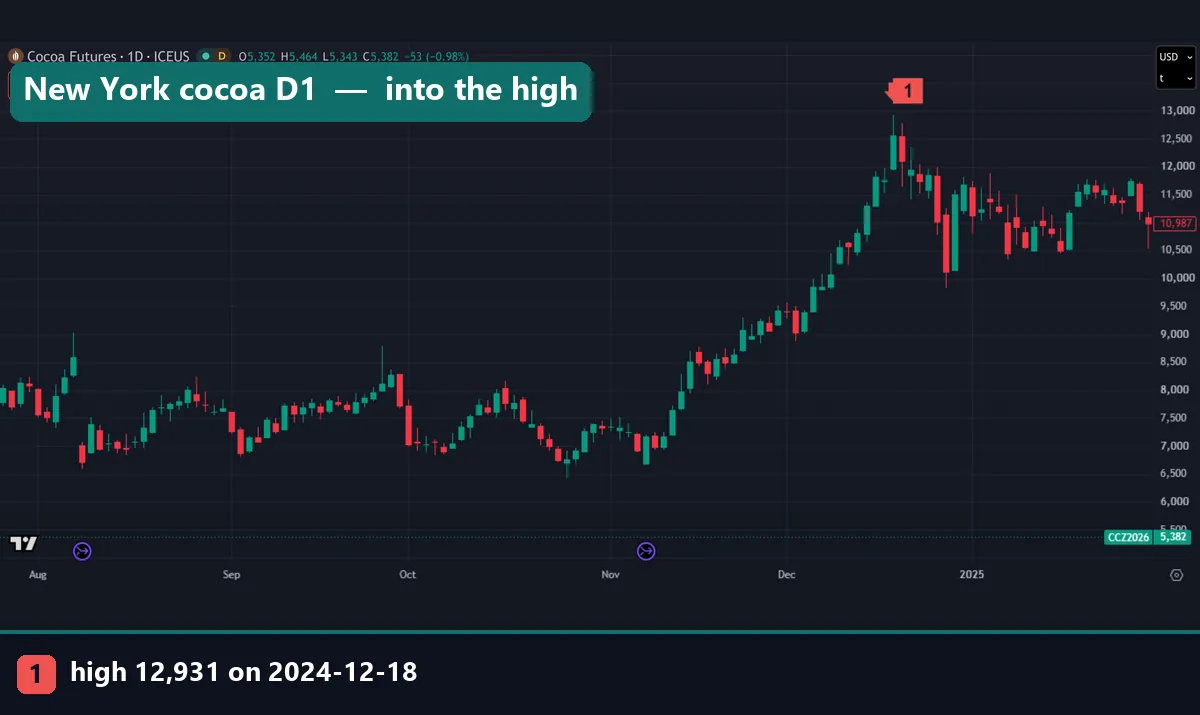
Start around the high. From below 7,000 in early November 2024, price climbs to the mark at 12,931 in about six weeks, then swings hard into January. That chop is close to what our whipsaw guide describes.
Next, compare two big bars. On 8 August 2024, at the far left, the bar opens far below the prior close, near 7,000 against near 8,600, and its body is small. A purple icon sits under it. These icons appear five times a year on our weekly capture, matching ICE’s five contract months, so we read them as contract-switch markers. Our data shows -21.8% close to close that day. We read most of it as a roll step, not a one-day crash, but we did not split it exactly.
Now take 30 December 2024, up 13.7%. That tall green bar opens near the prior close and moves inside its body, with no icon under it. So ask two questions of any big bar: did the move happen in the gap or the body, and does a marker sit under it? This is a rule of thumb, not proof.
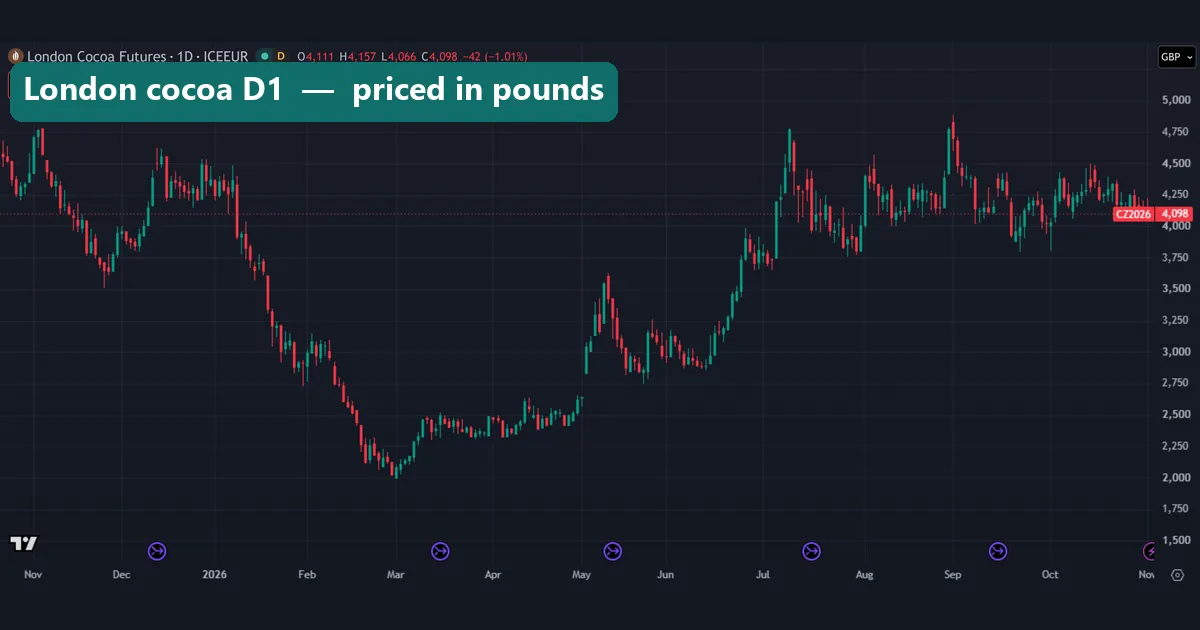
London is the second check. Its chart reads in pounds, as the GBP tag shows, and its low near 2,000 sits in early March 2026, like New York’s. Since 2023, across 948 days, the daily correlation was 0.88. So they usually agree, but not every day.
Worked example: the 2023 to 2026 swing per contract
Here is what the swing means for one contract, using the $10 point value and our measured prices. This is arithmetic on a continuous series, not the record of any real position.
| Leg | From | To | Points | Per contract | Change |
|---|---|---|---|---|---|
| January 2023 close to high | 2,572 | 12,931 (18 Dec 2024) | +10,359 | +$103,590 | 5.0x |
| High to low | 12,931 | 2,846 (2 Mar 2026) | -10,085 | -$100,850 | -78.0% |
| Low to last close | 2,846 | 5,438 (3 Nov 2026) | +2,592 | +$25,920 | +91.1% |
Now apply the daily range. At the January 2023 close of 2,572, the 2023 median range of 1.76% is about 45 points, or about $450 per contract. At the last close of 5,438, the 2026 median of 4.96% is about 270 points, or about $2,700. So a stop one median range away cost about six times more per contract. Price roughly doubled and the percentage range nearly tripled, and those two multiply.
That is why fixed lot habits break here. Our futures position size calculator and our guide to ATR position sizing cover the general method. However, neither one tells you where cocoa goes next.
How the daily range changed after 2023
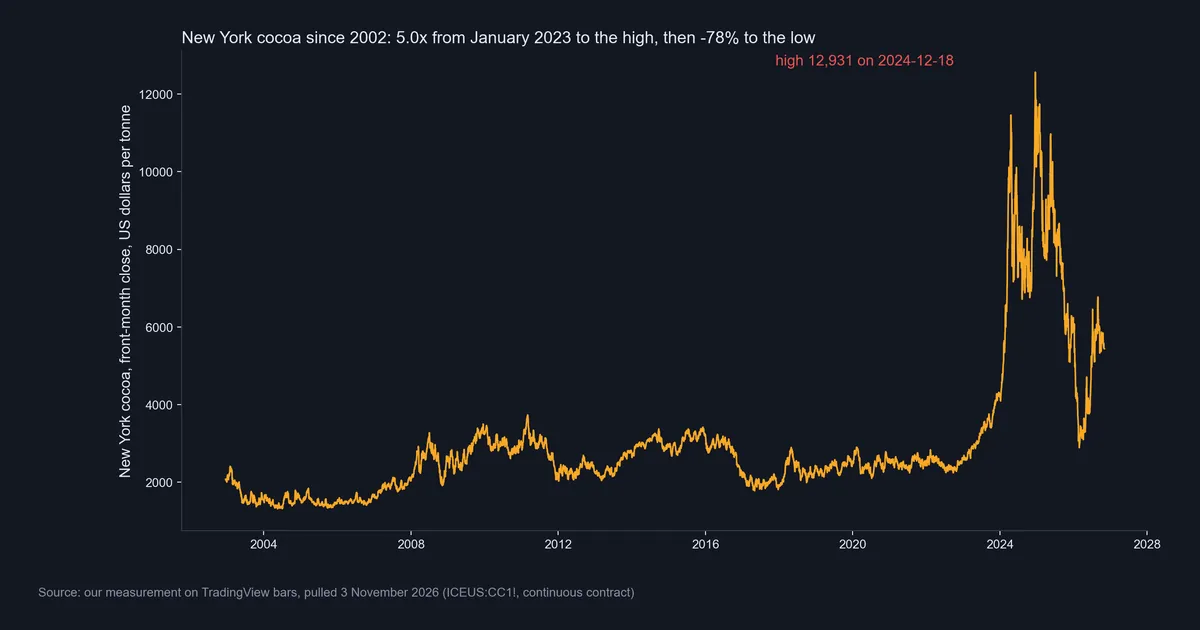
Our line chart adds context. It plots daily closes since December 2002, so its peak sits a little under the 12,931 label, which is an intraday high. Until late 2023 the line stays under about 4,000. Then it leaves that range within months.
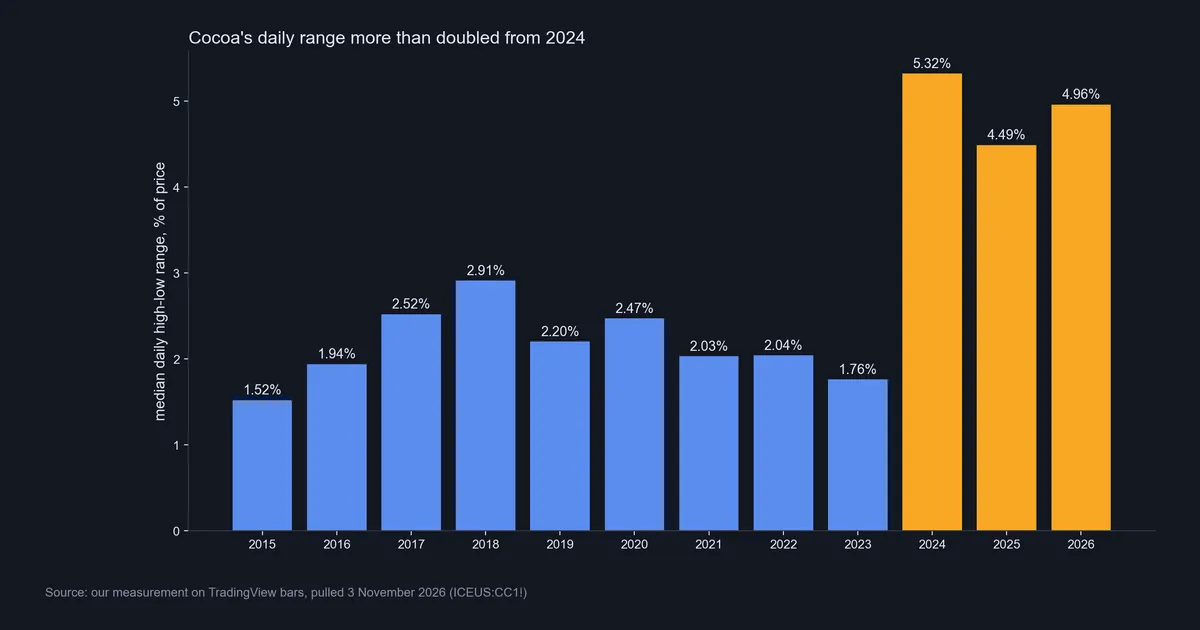
The bars show the range itself. From 2015 to 2023, the median daily range ran between 1.52% and 2.91%. Then it jumped to 5.32% in 2024, 4.49% in 2025 and 4.96% so far in 2026. It also did not shrink with the price, because the 2026 median sits above 2025’s even though price is far below the high. So a lower price did not mean a calmer market.
The largest close-to-close changes since 2023 all fall in 2024: -21.8% on 8 August, -19.4% on 13 May, -15.7% on 29 April, +13.7% on 30 December and +13.5% on 7 May. Any of them may include a contract roll. We did not separate roll steps from real moves, so do not read this list as five one-day events.
Download the complete indicator database
Put these concepts on your charts. One email unlocks the full library of 1,380+ indicators with compiled MT4 and MT5 files, plus my TradingView scripts. No paywall, no spam, unsubscribe any time.
Get free access to my indicator database
One email unlocks 1,380+ free MT4, MT5 and TradingView indicators — the complete library. No single-tool download; you get the whole database.
Where it fails
Roll steps stay in the data. We did not remove them, so the close-to-close list above can contain steps that no contract made. The range figures are less exposed, because each one uses the high and low of a single bar. Even so, TradingView itself says these series may not match traded prices.
The headline figures mix measures. The 5.0x runs from a close to an intraday high, and the 78.0% runs from an intraday high to an intraday low. Closes alone would give smaller numbers.
This is one episode. A single deficit and recovery gives no base rate. Nothing here says what follows the next deficit, or how long a wide range lasts.
A price line is not a position. A real holder rolls from contract to contract and pays costs along the way. We did not measure spreads, depth or slippage. Also, ICE’s session closes each day, so news can land while the market is shut.
The causes are borrowed. The crop explanations come from the ICCO and the World Bank. Our charts cannot confirm or reject them.
The 2026 low and the long view
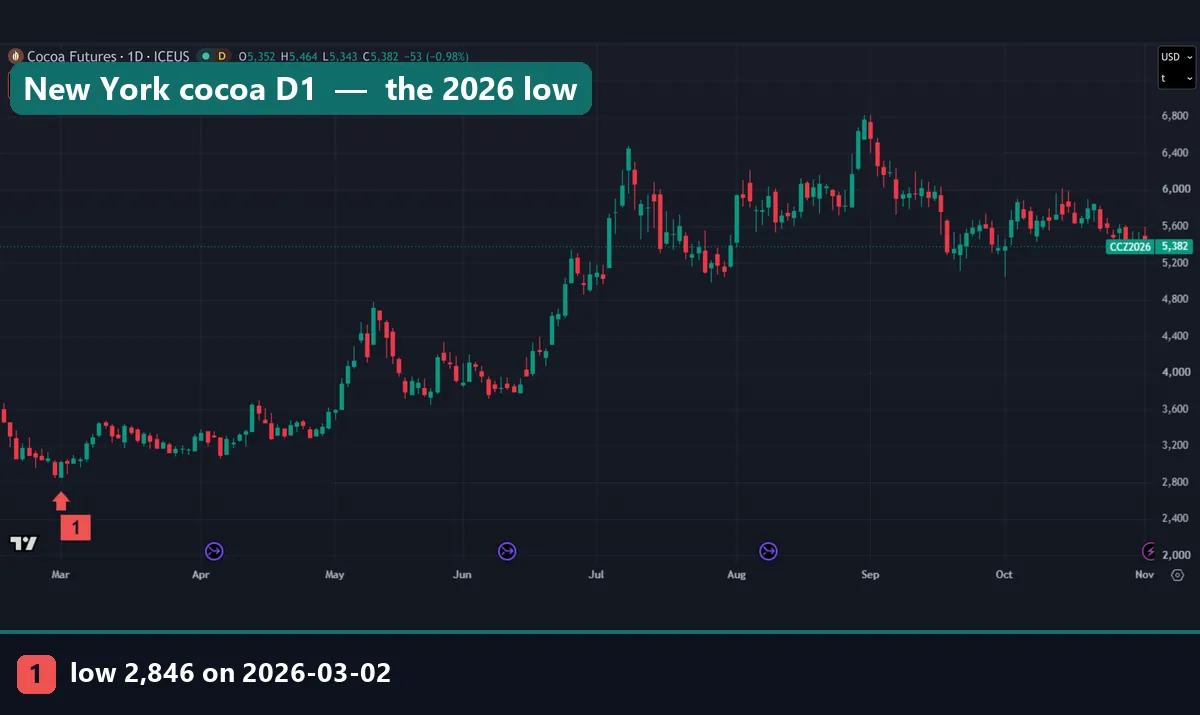
This daily capture starts near the low. Marker 1 sits on 2,846 on 2 March 2026. From there the chart climbs in stages: toward 4,800 in May, back near 3,800 in June, then up to around 6,800 by the start of September. Our last close, on 3 November 2026, is 5,438, which is 57.9% below the high. For scale, our market correction guide deals with far smaller falls.
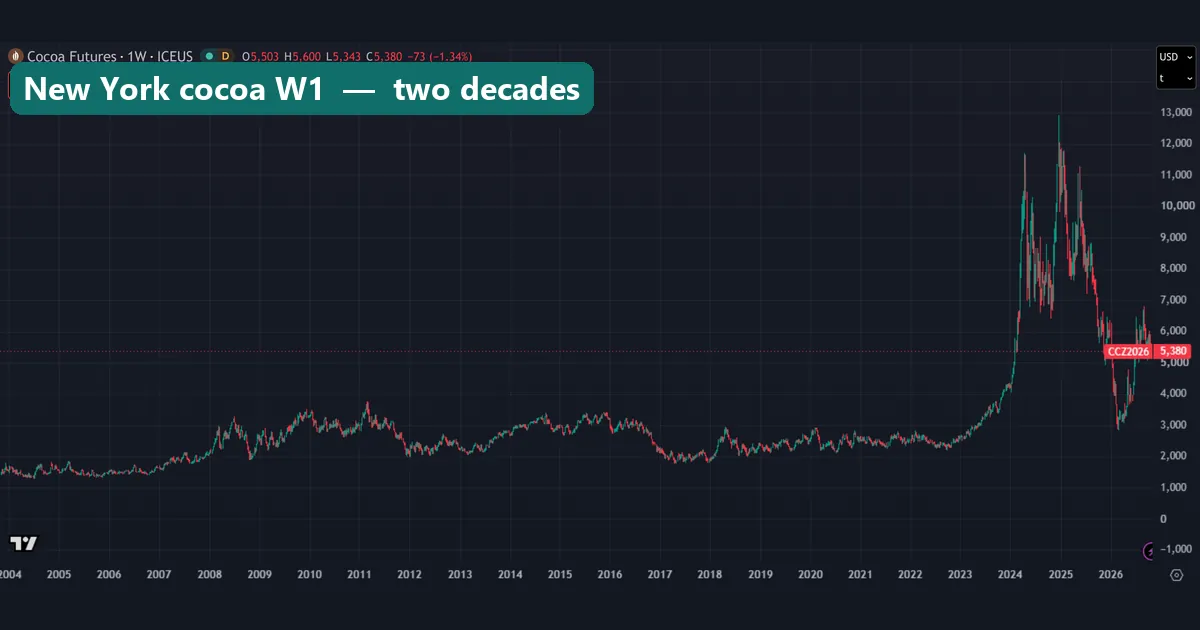
The weekly capture reaches back to 2004, although our weekly data begins in October 1982. From 2004 until late 2023, every weekly bar on this chart sits under 4,000, with a peak near 3,700 around 2011. So the 2,846 low went back inside that old range. Yet the last close of 5,438 sits above every bar before late 2023. In short, the fall looks severe from the high and the price still looks elevated from the long view. Neither reading is a forecast.
Common New York cocoa mistakes
- Reading a continuous chart as one contract. The series joins several contracts, so a gap on a switch day may be no loss to anyone. Check the bar and the marker first, as we did with 8 August 2024.
- Comparing New York and London prices directly. New York’s high is 12,931 dollars and London’s is 10,265 pounds. So the gap between 5,438 and London’s last close of 4,138 mixes cocoa with the exchange rate.
- Sizing stops from an old range. A 1.76% habit from 2023 sits inside normal noise at 4.96%. Our piece on ATR stop distance shows how to tie a stop to current range instead.
- Treating the crop story as a timing tool. The ICCO bulletin described the deficit about three weeks before the December 2024 high. Likewise, the World Bank note on recovering supply came four months after the March 2026 low. A true explanation can arrive at a poor moment for a trade.
Why a forex reader might care
Keep this small. Our guide to commodity currencies covers names such as the Australian and Canadian dollars, and cocoa is not part of that story. We measured no link to any currency. The one direct angle is Ghana, so readers of our African currencies guide may watch it. Even so, we claim no correlation with the cedi.
Two wider lessons do carry over. First, cocoa shows what a change in range does to a fixed stop, and that logic applies to any pair. Second, spot forex has no contract rolls, so a futures chart brings a new data problem. If you reach cocoa through a CFD, that product has its own price, financing and rules, so read the provider’s own page.
Where to go next
- Our guide to crude oil on TradingView applies the same care with rolls to another futures market.
- The piece on forex and commodity correlations shows how to test a link yourself.
- Our walkthrough of the TradingView chart helps you load ICEUS:CC1! and ICEEUR:C1!.
Our four outside sources are ICE, the ICCO, the World Bank and TradingView, each linked where we use it above.
FAQ: New York cocoa questions
What is New York cocoa?
It is the cocoa futures contract on ICE Futures U.S. Each contract covers 10 metric tons, quotes in US dollars per tonne and settles by physical delivery.
How does New York cocoa differ from London cocoa?
London trades on ICE Futures Europe and quotes in pounds per tonne. Our daily correlation between the two since 2023 is 0.88 across 948 days, but their prices need a currency conversion before you compare them.
How much is one point of cocoa worth?
One dollar per tonne is the minimum move, and it is worth $10 per contract. So a 270-point day, about the 2026 median at the last close, is about $2,700 per contract.
What is the TradingView symbol for New York cocoa?
We use ICEUS:CC1!, the continuous front-month series. London is ICEEUR:C1!. Our captures also show the contract behind the series on capture day, such as CCZ2026.
What is the highest price New York cocoa has reached?
In our daily data the high is 12,931 on 18 December 2024, an intraday figure. The last close was 5,438 on 3 November 2026.
Why did cocoa rise and then fall?
The ICCO cites weather, diseases and pests in West Africa during 2023/24, with a large supply deficit. Later, the World Bank tied the fall to better supply and softer demand. We report these views, but we did not test them.
Is New York cocoa a forex market?
No. It is a futures contract on a physical crop, with set trading hours and delivery months. Forex readers may still learn from its range and its roll steps.
Can these charts tell me where cocoa goes next?
No. Our figures describe the past, before costs, and they rest on one unusual episode. They say nothing about the next crop or the next price, and results are not guaranteed; past performance is not indicative of future results.
Last updated: 3 November 2026.

About the author
Written by Dominic Walsh, a Forex trader and MT4/MT5 indicator, Expert Advisor and script developer. Every tool on forexmt4systems.com is tested on live charts before release and ships with ready-to-use compiled MT4 (.ex4) and MT5 (.ex5) files. Learn more about the trader and developer behind this site.
How we build, test and correct every tool: Editorial & Testing Policy. Trading carries risk; see the disclaimer.