
A market correction is a fall of at least 10% from a recent closing high, but that rule comes from stock indexes and fits currencies and gold badly. This guide settles what a correction means in forex and gold, and how deep and long they run. We measured every 5% drop on 23 currency pairs from 2018 to 2026, and on gold since 2021. In short, 5% is already a big move for a pair, and about half of those drops went past 10%.
What a market correction is
A correction is a drop from a recent peak that stops short of a full change of trend. For stock indexes, the usual line is a 10% fall from a closing high to a later closing low. The market correction entry on Wikipedia sets out that convention.
A deeper fall gets a different name. The SEC’s investor site says a bear market occurs when a broad index falls 20% or more over at least two months. See the bear market entry on Investor.gov. So in stock language, 10% to 20% is a correction, and 20% or more is a bear market.
A pullback is a smaller dip inside a trend, and no official line separates the two. In this guide, a dip becomes a correction once a close sits 5% below the peak close. Elliott wave traders use the word too, but they mean the counter-trend legs of a wave count. Our guide to Elliott corrective patterns covers that meaning.
How a correction is measured: the formula
First, track the running peak, which is the highest close so far. Next, a correction starts on the first close that sits a set percentage below that peak. It ends when a close gets back to the peak or above it. The depth compares the peak close with the lowest close in between:
depth % = (peak close - lowest close) / peak close x 100
Durations count bars: trading days on daily data, weeks on weekly data.
The rule uses closes, not wicks, so a spike that closes lower does not set the peak. It also says nothing about cause. A correction describes a price path; it is not a signal.
Forex adds one twist. A pair is a ratio, so a fall in EURUSD is also a rise in the dollar against the euro. Every FX correction is a rally for the other currency. Our guide to the dollar index in forex shows the dollar’s side of the move.
Why 10% is too big a bar for forex
On currency pairs, a 10% rule hides most of the action. Across our 23 pairs, we found 59 drops of 5% or more in about eight years. That is 0.41 per pair per year. Only 28 of the 59 went on to reach 10%, so a stock-style rule would have missed 31 large moves.
The count varies by pair. AUDCAD had none, and EURUSD, GBPUSD and AUDUSD had one each. The yen crosses led: AUDJPY, GBPJPY and NZDJPY had seven each, while USDJPY and CADJPY had five. These are classic carry pairs, and our guide to a carry trade unwind explains why they can drop fast.
Gold sits in the middle. On weekly closes since January 2021, gold had seven corrections of 5% or more, and two of them passed 10%. So we used 5% for both and flag the 10% cases.
If you set your own threshold, our list of the most volatile forex pairs helps: the wilder the pair, the higher the bar.
How we tested
We coded the rule above and ran it on two data sets.
- Forex: daily closes for 23 pairs from MetaTrader 4, build 1471, on the Capital Point Trading server, from 12 June 2018 to 24 August 2026. Threshold 5%, and we flag drops that reached 10%.
- Gold and EURUSD, weekly: OANDA weekly closes on the TradingView web chart, from the week of 17 January 2021 to the week of 11 October 2026.
- Charts: the TradingView web chart with OANDA data, captured on 15 October 2026.
- Trades: none. We describe price paths, so spread, swap and commission do not apply.
Our MT4 gold history only runs from December 2025 to August 2026, which is too short, so gold figures come from TradingView. Our editorial testing policy explains how we choose data and report results.
Market correction thresholds: stocks, forex and gold
| Setting | Stock convention | Our forex test | Our gold test |
|---|---|---|---|
| Correction threshold | 10% from a closing high | 5% below the peak close | 5%, with 10% shown too |
| Bear market line | 20% or more | Not used | Not used |
| Price used | Closing prices | Daily close | Weekly close |
| End | A new closing high | A close back at the peak | Same as forex |
| Depth | Closing high to closing low | Peak close to lowest close | Same as forex |
| Time unit | Days | Trading days | Weeks |
| Data | A broad stock index | 23 pairs, June 2018 to August 2026 | OANDA gold, January 2021 to October 2026 |
Two settings matter most: the threshold decides what counts, and the bar size decides where the peak sits. The gold example below shows both.
Reading a market correction on a chart
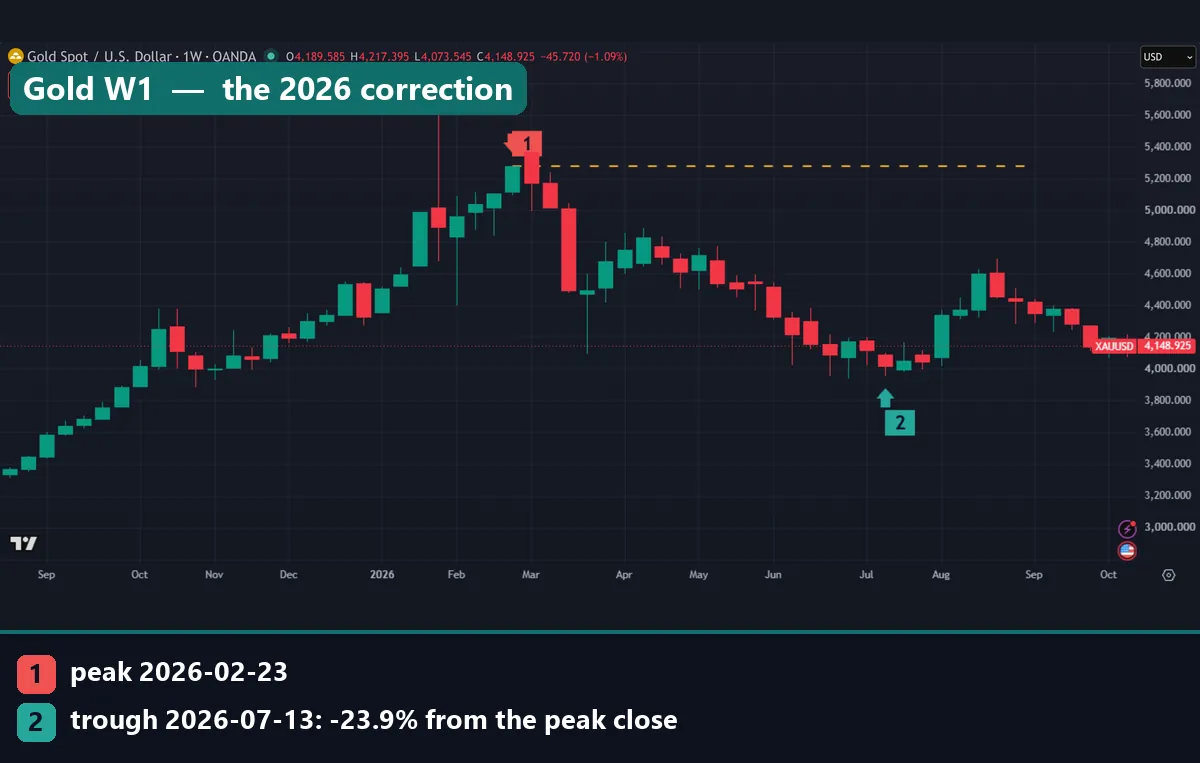
On our charts, marker 1 sits on the peak close and marker 2 on the lowest close. The yellow dashed line runs right from the peak close. While price stays under it, the correction has not ended. Our guide to peaks and troughs shows how to mark swing points.
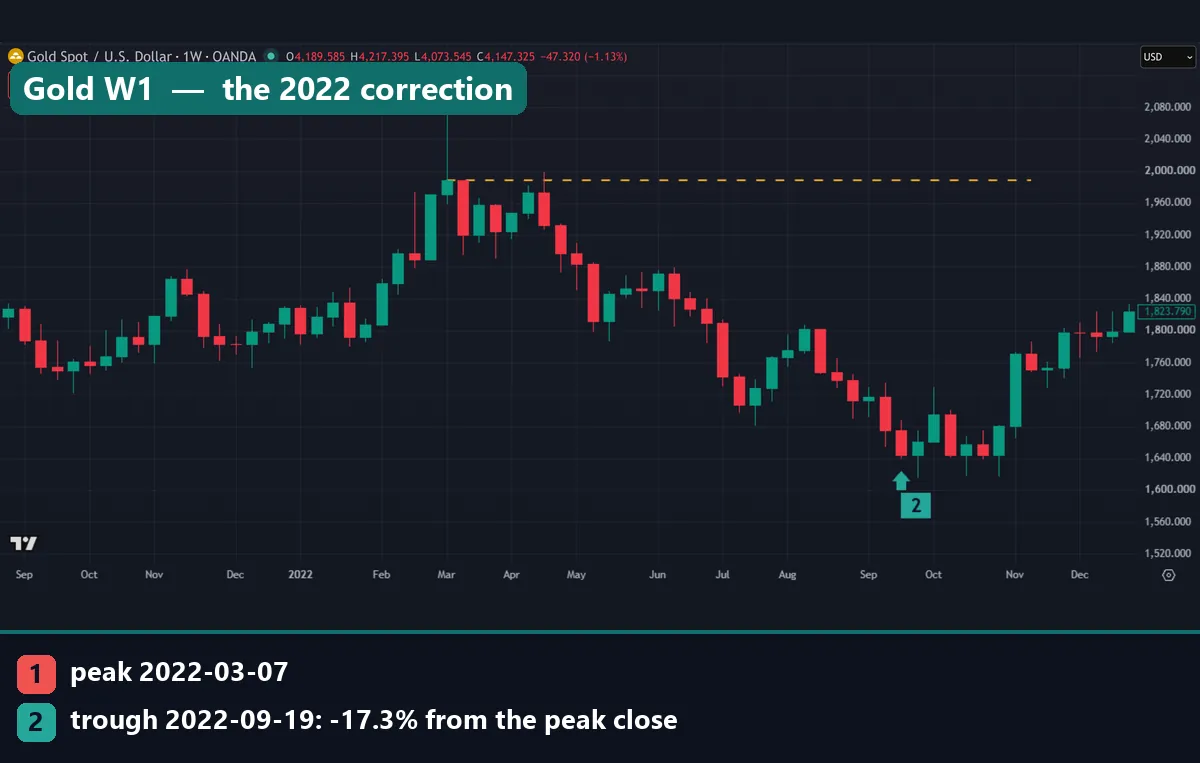
Gold in 2022 shows a full cycle. The peak close came in the week of 7 March 2022, at $1,988.52. Price then slid for 28 weeks to a low close of $1,643.925 in the week of 19 September, a fall of 17.3%. A week in April poked through the line with its wick but not its close, so the peak stayed put. Gold closed back above the line 56 weeks after the peak.
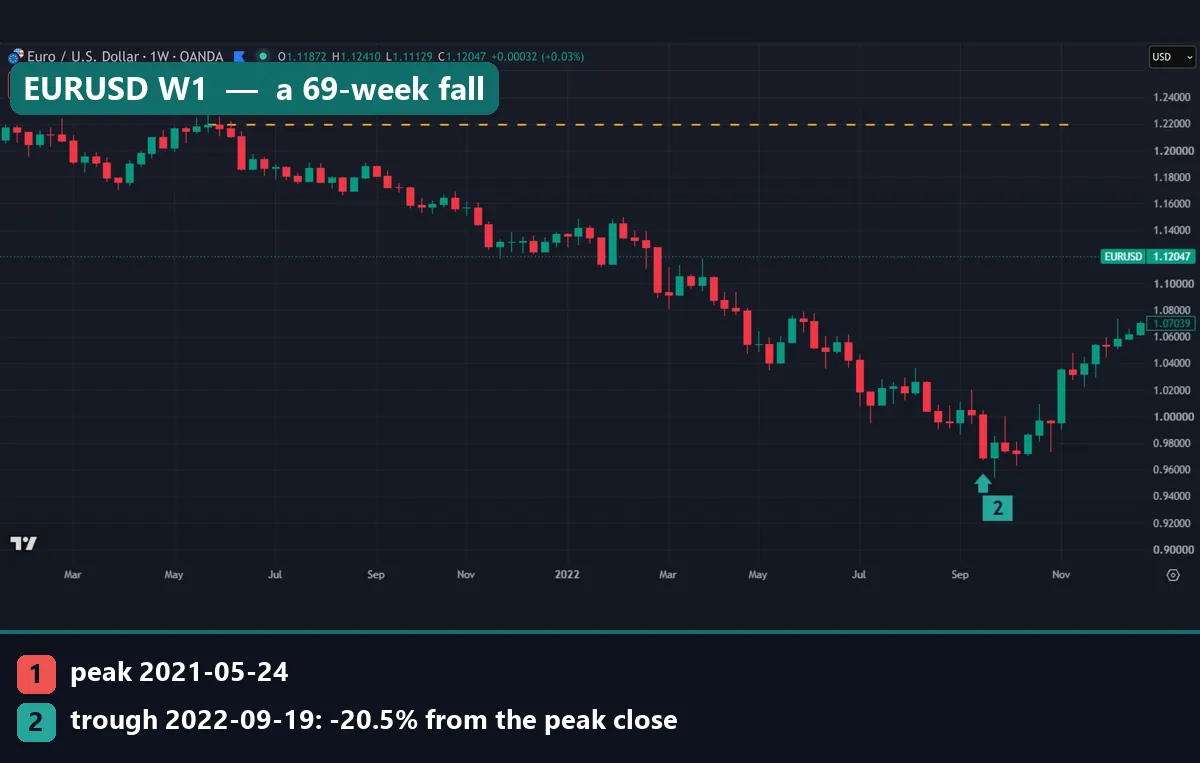
EURUSD shows a slow grind instead. On weekly closes, the peak came in the week of 24 May 2021, at 1.21921. The low close arrived 69 weeks later, in the week of 19 September 2022, at 0.96914. That is a 20.5% fall, past the bear market line by the stock yardstick. Unlike gold, EURUSD had not closed back above 1.21921 by the week of 11 October 2026.
Seen from the other side, the dollar gained on the euro for 69 weeks. The Federal Reserve’s H.10 dollar index tables track the dollar against a broad basket.
Worked example: the 2026 gold correction, measured two ways
Back to the opening chart. Gold’s highest weekly close came in the week of 23 February 2026, at $5,278.51 (marker 1). The lowest weekly close since then came in the week of 13 July, at $4,017.315 (marker 2). Plug both into the formula:
(5,278.51 - 4,017.315) / 5,278.51 x 100 = 23.9%
The fall took 20 weeks. By stock rules, that is past the 20% bear market line. Gold’s other six corrections since 2021 were milder, from 5.9% to 17.3%.
Next, run the same rule on daily closes. The daily peak close came on 28 January 2026, at $5,418.545. The daily low close came on 16 July, at $3,976.58. That gives 26.6% over 120 trading days. Same fall, different peak date, deeper reading.
Why the gap? A weekly bar keeps only the last close of the week. Gold’s late January spike, the tall wick on the opening chart, faded by the end of that week. So the weekly series never saw $5,418.545.
Depth also sets the climb back. To get from $4,017.315 to $5,278.51, gold needs a rise of 31.4%, because 5,278.51 / 4,017.315 is about 1.314. At the last weekly close on our chart, $4,148.925, it still sat well under the dashed line. Our guide on how to recover from a drawdown applies the same math to an account.
What 59 forex corrections looked like
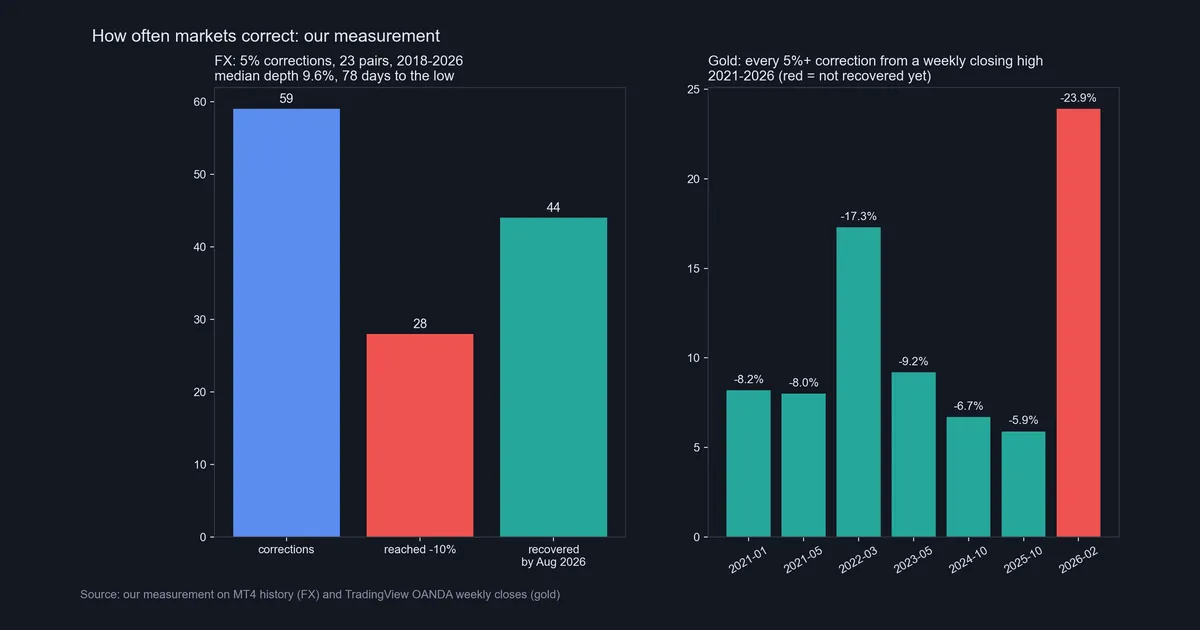
The left panel sums up our forex count. Of 59 corrections, 28 reached 10%, and 44 had regained their peak close by 24 August 2026. That is 47.5% and 74.6%. The median correction fell 9.6% and took 78 trading days to reach its low. For those that recovered, the median trip from peak back to peak took 168 trading days.
The right panel lists every 5% gold correction since January 2021. Six of the seven recovered; only the one from February 2026 had not.
Speed varied a lot. In mid-2024, GBPJPY fell 11.8% in 19 trading days. By contrast, EURUSD’s only 5% correction in our MT4 data took 449 trading days, from 6 January 2021 to 27 September 2022, and fell 22.2%.
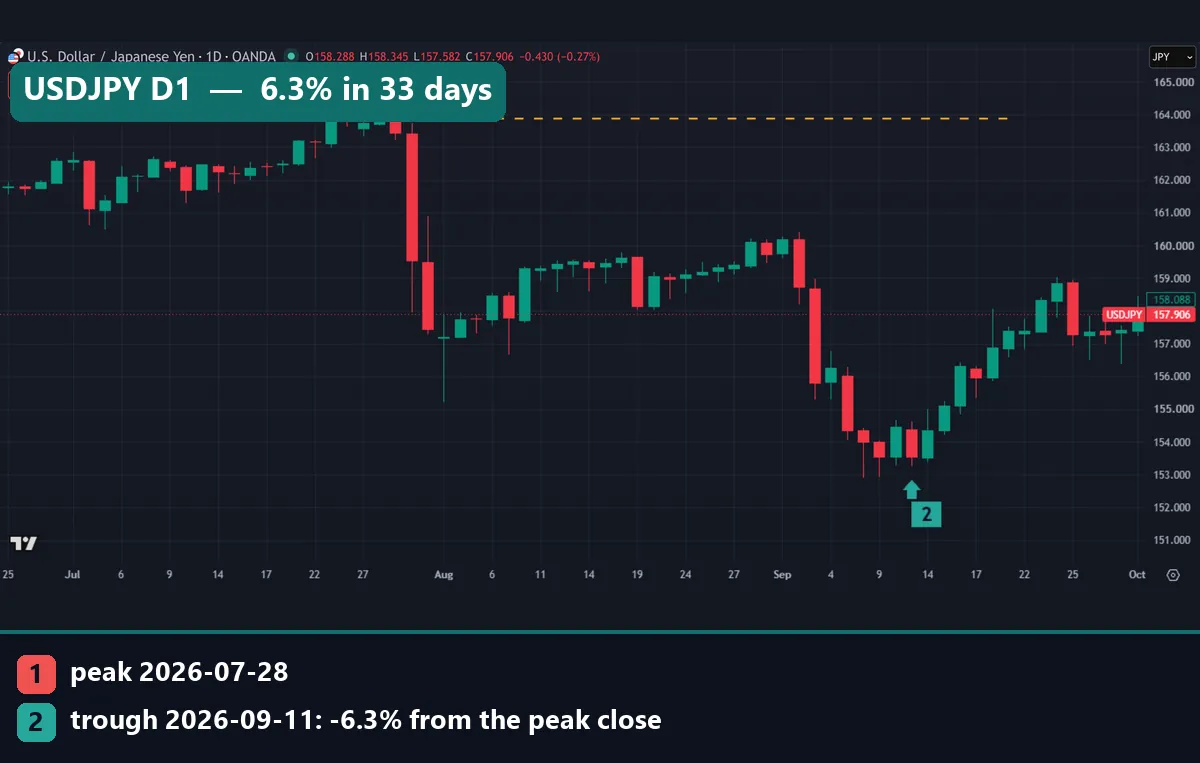
USDJPY shows how fast an FX correction can form. The peak close came on 28 July, at 163.869. Two large red bars followed, and the pair then spent August climbing back toward 160. In early September a second drop took it to a low close of 153.533 on 11 September. That is 6.3% in 33 trading days, yet a 10% rule would not see it.
Download the complete indicator database
Put these concepts on your charts. One email unlocks the full library of 1,380+ indicators with compiled MT4 and MT5 files, plus my TradingView scripts. No paywall, no spam, unsubscribe any time.
Get free access to my indicator database
One email unlocks 1,380+ free MT4, MT5 and TradingView indicators — the complete library. No single-tool download; you get the whole database.
Where it fails
A correction label is easy to apply after the fact and hard to use in real time.
You only know the low later. On the day a pair first closes 5% below its peak, nothing tells you which kind of drop it is. AUDUSD’s 2026 drop has gone no deeper than 5.1% so far, while EURUSD’s 2021 drop went on to 22.2%. Both looked the same at the 5% mark.
The threshold is a cliff. A 4.9% drop does not count, but 5.1% does. Pick 6% and our count changes.
Bar size and start date move the answer. Gold reads 23.9% on weekly closes and 26.6% on daily closes. Also, EURUSD’s MT4 peak came on 6 January 2021, but our TradingView weekly series starts in mid-January. So it reports a May 2021 peak and a 20.5% fall.
The recovery figure is cut off. 74.6% had regained the peak by August 2026, but a correction that began in 2025 has had little time. Some of the 15 open cases may recover later, and some may not.
The events overlap. At least five of the pair corrections in our data bottomed on 26 or 27 September 2022, EURUSD and GBPUSD among them. Pairs that share a currency fall together, so 59 events tell you less than the count suggests. Our guide to backtest sample size explains why.
We tested no trades. A rule that bought every 5% dip would have bought EURUSD early in a fall that reached 22.2%. Do not assume such a rule works.
Two small corrections: GBPJPY and AUDUSD
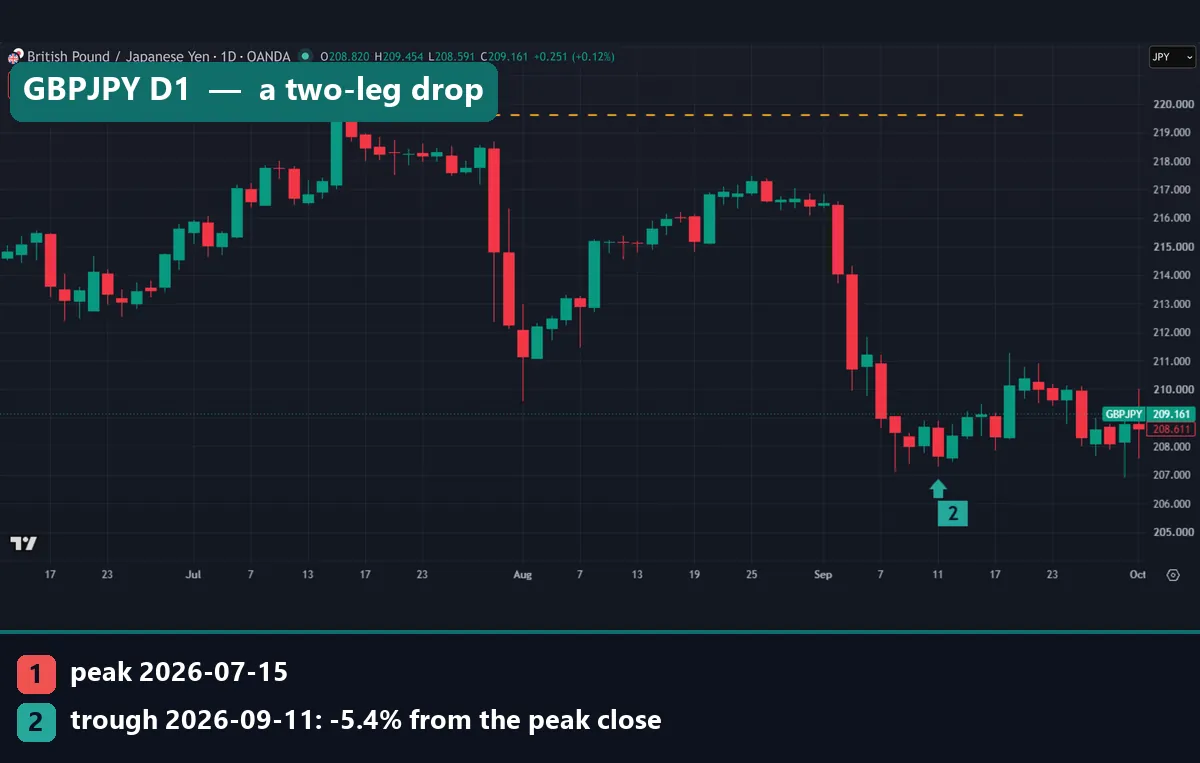
GBPJPY shows a correction in two legs. The peak close came on 15 July 2026, at 219.593. A sharp drop at the end of July took the pair toward 212. Then it rallied back near 217 in late August without reaching the line. A second drop in early September set the low close on 11 September, at 207.675: 5.4% in 42 trading days. It traded near 209 at our capture.
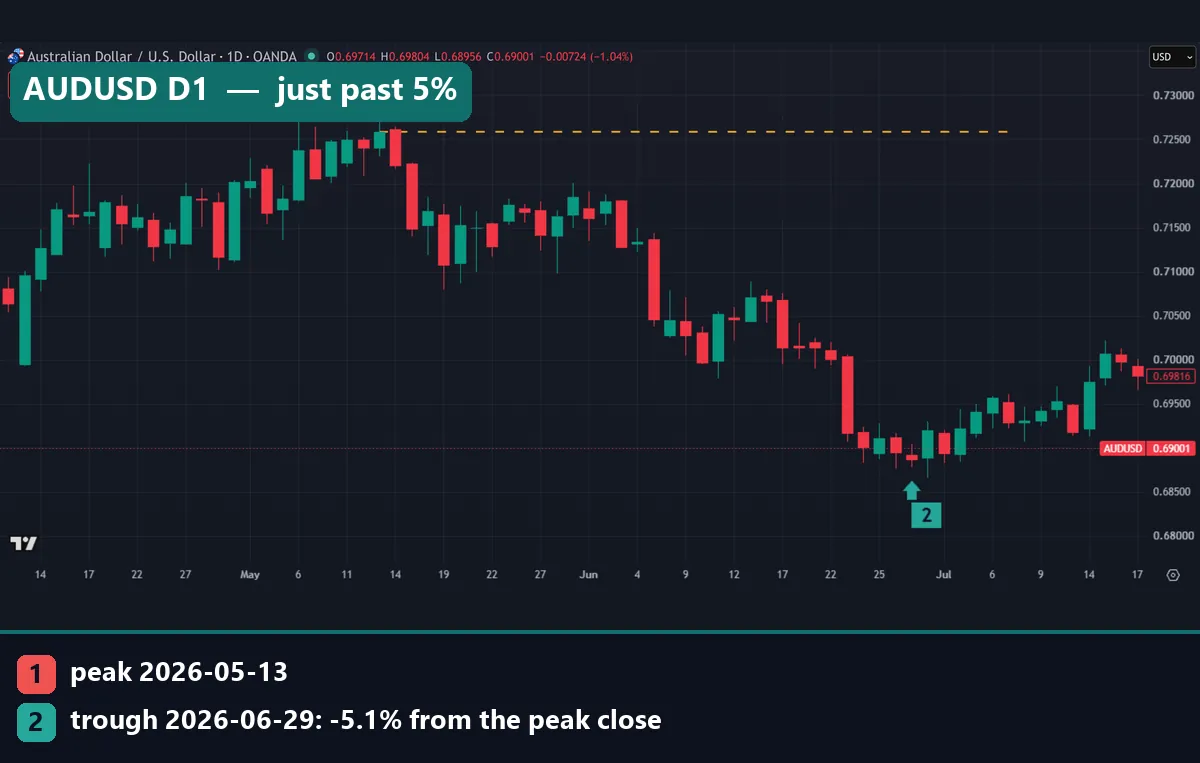
AUDUSD barely made the cut. The peak close came on 13 May 2026, at 0.72582. The pair then slipped to a low close of 0.68869 on 29 June, a fall of 5.1% in 33 trading days. By mid-July it had bounced toward 0.70. With a 5.5% threshold, this drop would not count at all.
Common mistakes when reading a correction
- Using the stock rule on currencies. A 10% bar misses USDJPY’s 6.3% drop in 2026 and 31 of our 59 FX corrections. Set the bar per market.
- Measuring from the wick. The rule runs on closes. Mix a wick high with a close low and the depth grows. Mixing daily and weekly data moves it too.
- Expecting a neat stopping point. About half of our 5% corrections went on to 10%. A Fibonacci retracement measures a pullback against the prior swing, which is a different yardstick.
- Assuming price always comes back. A quarter of our FX corrections had not regained the peak by August 2026, and the rest took a median of 168 trading days. Read our guide to drawdown in trading for the cost of that wait.
Where to go next
Read next:
- Trend following trading explains why trend traders sit through corrections.
- The trend pullback strategy covers entries on smaller dips inside a trend.
- Our drawdown calculator shows the gain you need to recover any loss.
- Safe haven currencies explains why gold, the franc and the yen draw buyers in stress.
For outside data, check the gold price history at the World Gold Council.
FAQ about market corrections
What is a market correction?
It is a fall from a recent closing high that ends when price closes back at that high. For stock indexes the usual line is 10%, and 20% or more counts as a bear market.
What counts as a correction in forex?
No official rule exists. We used 5% on daily closes, because even that is rare: 0.41 such drops per pair per year in our data.
How long does a market correction last?
In our forex data, the median correction took 78 trading days from peak to low. The ones that recovered took a median of 168 trading days to regain the peak.
How often do currency pairs have a correction?
About 0.41 times per pair per year from 2018 to 2026. The yen crosses had the most, and AUDCAD had none.
What is the difference between a correction and a bear market?
Size. By the stock convention, a 10% to 20% fall is a correction, and 20% or more is a bear market. EURUSD’s 20.5% weekly fall from 2021 to 2022 would pass that line.
Is a correction the same as a pullback?
Not quite. A pullback is a smaller dip inside a trend. No official line separates them, so we used a close 5% below the peak close.
Did gold have a correction in 2026?
Yes. On weekly closes, gold fell 23.9% from the week of 23 February to the week of 13 July 2026. On daily closes the fall was 26.6%.
Can you tell when a correction will end?
No method in this guide can. Our numbers describe past corrections, and the next one can be shallower, deeper or longer; results are not guaranteed; past performance is not indicative of future results.
Last updated: 15 October 2026.

About the author
Written by Dominic Walsh, a Forex trader and MT4/MT5 indicator, Expert Advisor and script developer. Every tool on forexmt4systems.com is tested on live charts before release and ships with ready-to-use compiled MT4 (.ex4) and MT5 (.ex5) files. Learn more about the trader and developer behind this site.
How we build, test and correct every tool: Editorial & Testing Policy. Trading carries risk; see the disclaimer.