
A trend pullback strategy buys a dip inside an uptrend, or sells a bounce inside a downtrend, and then rides the trend’s next leg. We wrote one version as an exact rule and ran it on 23 currency pairs of daily MT4 history, 1,737 trades in all. This guide settles what the rule is, how to read it on a chart, and what the numbers say. The short answer: the rule lost 20.1R before costs, and only 12 of the 23 pairs finished positive.
What a trend pullback strategy actually is
A pullback is a short move against the main trend. In an uptrend, price dips for a few bars, then turns back up. In a downtrend, price bounces, then falls again. A trend pullback strategy tries to enter at the end of that dip, so the trader joins the trend at a better price than a breakout buyer would get.
Every version needs three parts. First, a trend filter that says which side to trade. Next, a pullback test that says the dip has happened. Finally, a trigger that says the dip is over. Most traders build all three from moving averages, because they are simple and every platform has them.
That is also the weak spot. A pullback and the start of a reversal look the same for the first few bars. So the strategy is really a bet that most dips in a trend will end before the trend does. It is a cousin of trend-following trading, but it enters earlier and with a tighter stop.
How the rule works, step by step
We used one fixed rule, with no tuning per pair. Here it is for longs. Shorts are the mirror image.
- Trend filter: the close and the 50 EMA are both above the 200 SMA.
- Pullback: a daily bar closes below the 20 EMA.
- Trigger: the first close back above the 20 EMA. Then we enter at the next bar’s open.
- Stop: just beyond the lowest low of the pullback.
- Target: 2R, so twice the distance from entry to stop.
- Time exit: close the trade after 20 bars if neither level is hit.
- Spacing: one trade per 5 bars at most.
The EMA formula is EMA = alpha x close + (1 - alpha) x previous EMA, where alpha = 2 / (N + 1). For the 20 EMA that gives alpha = 2 / 21, so each new close carries about 9.5% of the weight. That is why the 20 EMA hugs price while the 200 SMA barely moves. Our guide on SMA vs EMA covers the difference in more detail.
R is the risk unit: the price gap between entry and stop. A trade that hits the stop loses 1R. A trade that hits the target makes 2R. R puts every pair on one scale; see R-multiples in trading.
How we tested the trend pullback rule
We ran the rule on MT4 terminal history from Capital Point Trading, MetaTrader 4, build 1471. The data covers 23 FX pairs on the daily (D1) timeframe, from 12 June 2018 to 24 August 2026. That is 37,748 daily candles in total. We read the raw .hst files on 5 October 2026 and applied the rule bar by bar.
Then we drew the chart examples on a TradingView web chart with OANDA data on 5 October 2026. Those cover EURUSD, GBPUSD, USDCHF, GBPJPY and gold (XAUUSD), all on the daily chart. The position boxes are TradingView’s long and short position tools. We drew each one with our rule’s entry, stop and 2R target. Gold was not part of the 23-pair test, so its chart is an illustration only.
One limit matters a lot. This MT4 history does not store usable spreads. So every result here is before spread, swap and commission. Real costs would push every figure lower. Our guide to backtesting costs explains why that gap matters.
Our full method and how we handle results that look bad are on the editorial testing policy page.
Settings we used
These are the exact inputs. We did not optimize them.
| Setting | Value | What it does |
|---|---|---|
| Fast average | EMA 20 (close) | Defines the pullback and the trigger |
| Trend average | EMA 50 (close) | Must sit on the trend side of the 200 SMA |
| Slow average | SMA 200 (close) | Sets the trend direction |
| Timeframe | D1 | One bar per trading day |
| Entry | Next bar’s open | After the first close back across the 20 EMA |
| Stop | Beyond the pullback extreme | Defines 1R |
| Target | 2R | Twice the stop distance |
| Time exit | 20 bars | Closes trades that stall |
| Spacing | One trade per 5 bars | Stops stacked entries in one pullback |
On TradingView, the three lines are the built-in EMA and Moving Average studies. In MT4, they are the standard Moving Average indicator, set to Exponential or Simple. The 20 EMA guide shows how that one line behaves on its own.
Reading a trend pullback on a chart
Start with the order of the lines. In our charts the yellow line is the 20 EMA, purple is the 50 EMA and blue is the 200 SMA. For a long, the purple line should sit above the blue one. For a short, it should sit below.
Next, look for a close on the wrong side of the yellow line. That close is the pullback. Then wait for the first close back on the trend side. The position box starts at the open of the next bar.
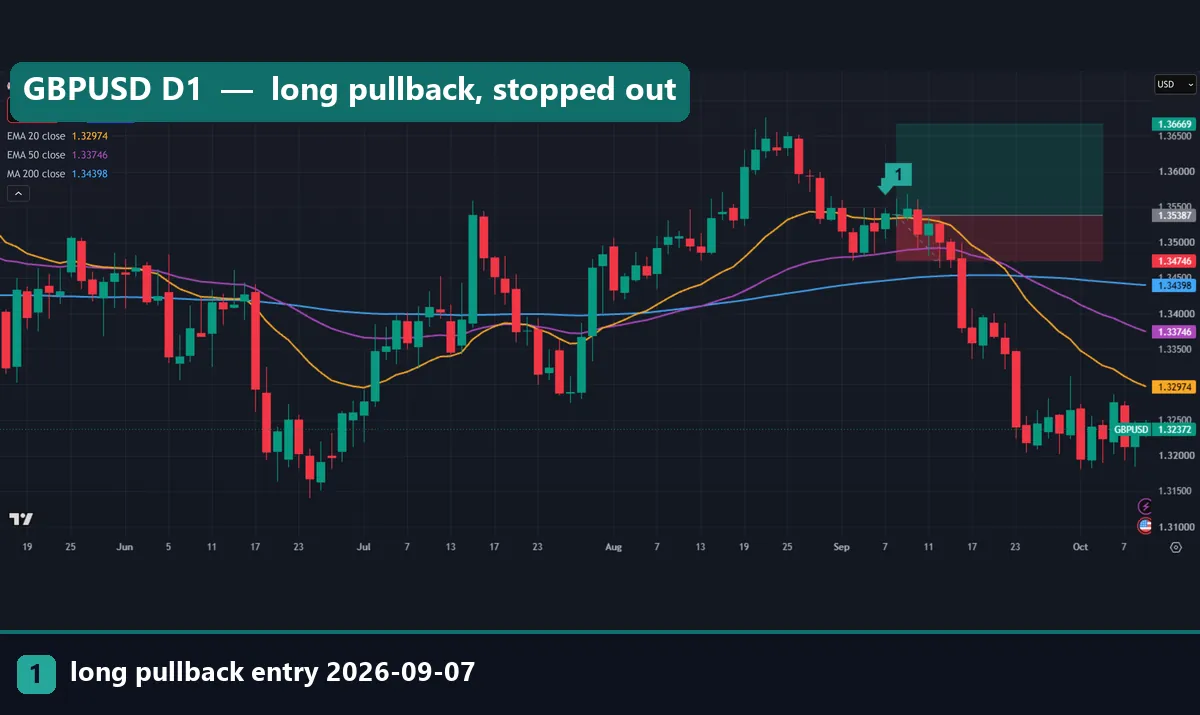
The GBPUSD chart above shows a long signal dated 7 September 2026. The 50 EMA was above the 200 SMA, and price had dipped and closed back above the 20 EMA. Entry was 1.35387, the stop 1.34746 and the target 1.36669. Price stalled for a few days, then fell through the stop. It is a clean signal and a clean loss. Both happen often with this rule.
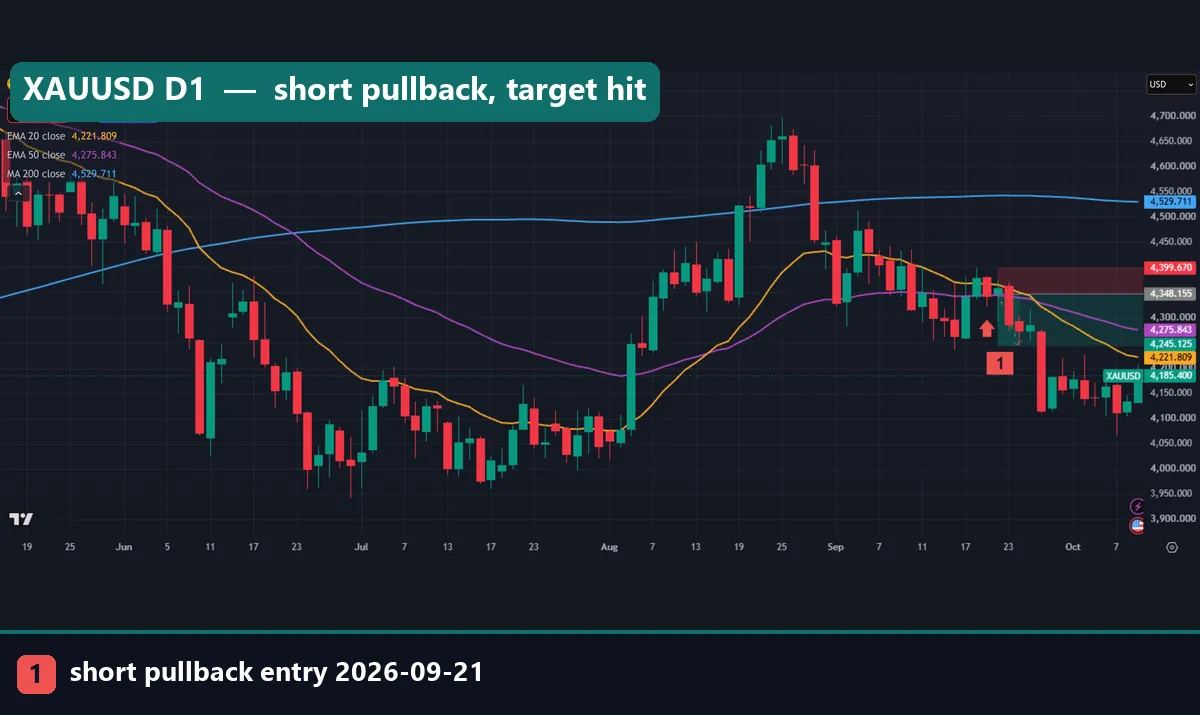
The gold chart shows a short signal dated 21 September 2026. The 50 EMA was well below the 200 SMA. Entry was $4,348.16, the stop $4,399.67 and the target $4,245.13. So the risk was about $51.52 per ounce and the target about $103.03 away. Price dropped through the target within days.
Worked example: EURUSD short, September 2026
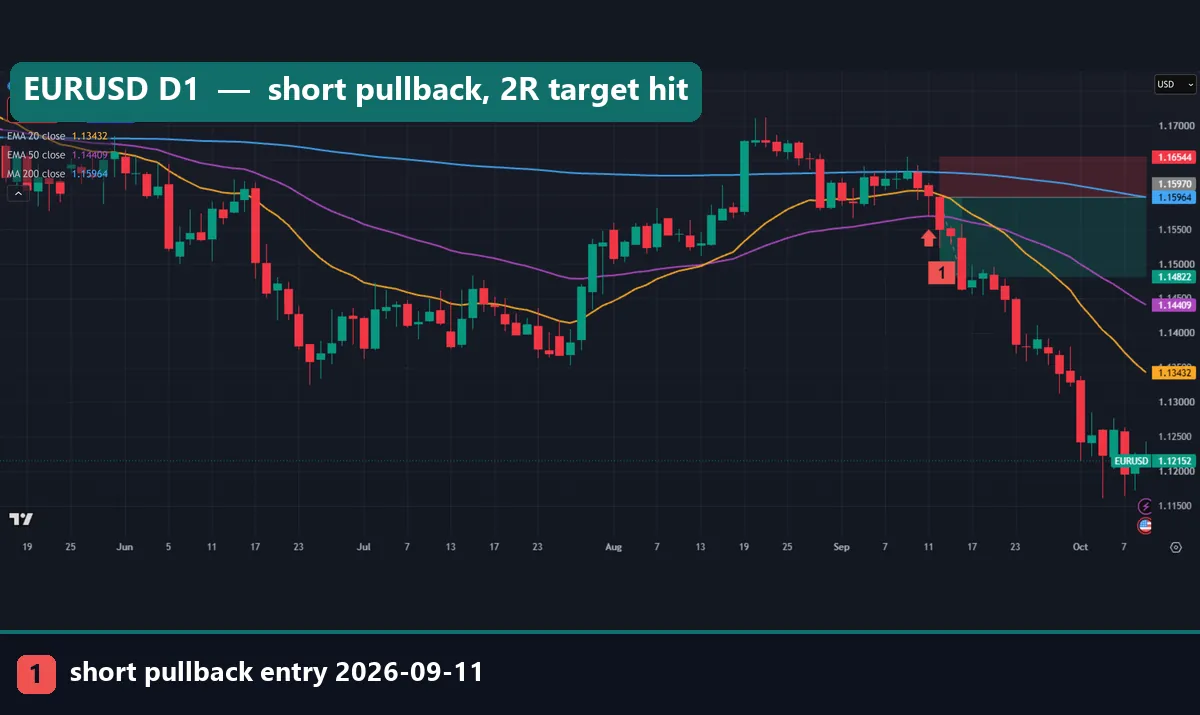
The first chart in this guide shows the cleanest trade we have.
- Trend: on the signal bar, the close and the 50 EMA were both below the 200 SMA. So only shorts were allowed.
- Pullback: price had bounced and closed above the 20 EMA.
- Trigger: the bar dated 11 September 2026 closed back below the 20 EMA.
- Entry: the next daily open, at 1.15970.
- Stop: 1.16544, above the bounce high. That is 57.4 pips of risk, or 1R.
- Target: 1.14822, which is 2R or 114.8 pips below entry.
Price fell for several days in a row and reached 1.14822. The trade booked +2R before costs.
However, one good trade proves very little. Our image set has five setups: three hit the target and two hit the stop. We picked those charts to show the mechanics, not to show a typical run. To size a trade like this one, use a position sizing method so that 1R is a fixed share of the account.
What 1,737 trades showed
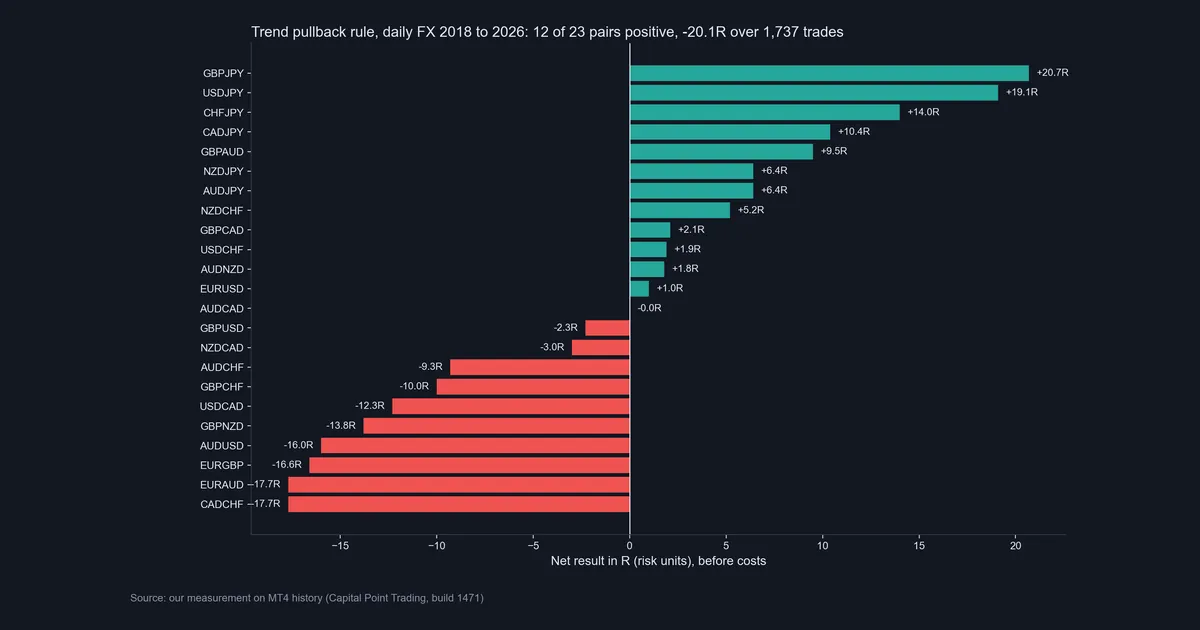
Across all 23 pairs, the rule took 1,737 trades and finished at -20.1R before costs. That is about -0.01R per trade, so close to zero. In short, there was no edge in the full sample.
Still, the spread between pairs was wide. GBPJPY made +20.7R over 86 trades and USDJPY +19.1R over 66 trades. At the other end, CADCHF and EURAUD each lost 17.7R, and EURGBP lost 16.6R over 82 trades. Twelve pairs ended positive and eleven did not.
There is one pattern worth a look. All six yen pairs in the test finished positive. That is a modest lean, and we have not tested it out of sample. Two pairs also had very few trades: AUDCAD with 7 and NZDCAD with 6. Those two results say almost nothing. See backtest sample size.
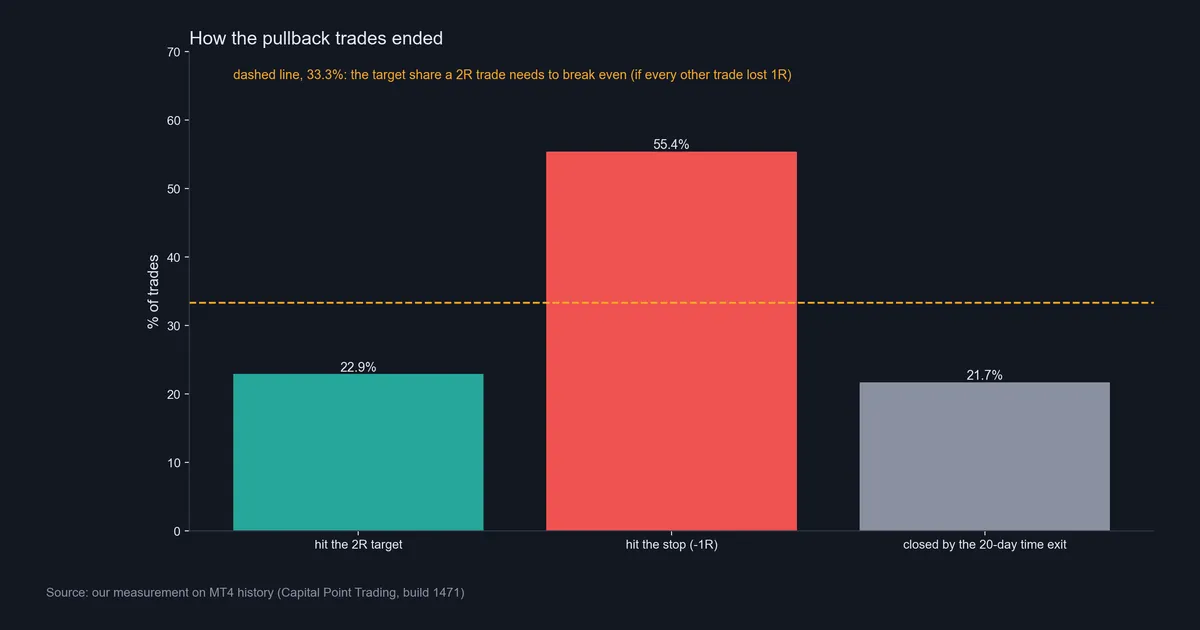
The second chart shows how trades ended. Only 22.9% hit the 2R target. Another 55.4% hit the stop. The other 21.7% closed at the 20-bar time exit. Overall, 38.5% of trades made money, counting the time exits that closed in profit.
Why 38.5% profitable trades still lost money
A 2R target needs fewer winners than a 1:1 trade. If every trade either made 2R or lost 1R, you would break even with one target in three, which is 33.3%. That is the dashed line in the chart above.
But our target share was 22.9%, well below that line. The time exits helped on balance, because enough of them closed in profit. Even so, they only pulled the total back to near zero. So the 38.5% figure looks fine on its own, yet it hides how few trades reached the full 2R.
This is why the share of trades that made money tells you little without the size of each win and loss. Trading expectancy joins both into one number. You can also run your own figures through our expectancy calculator. Our risk-reward ratio guide covers the same break-even sums for other targets.
Then add costs. The result was already about -0.01R per trade before spread and swap. Any real cost makes it worse. On a tight-stop pair, a full spread can be a noticeable slice of 1R.
Download the complete indicator database
Put these concepts on your charts. One email unlocks the full library of 1,380+ indicators with compiled MT4 and MT5 files, plus my TradingView scripts. No paywall, no spam, unsubscribe any time.
Get free access to my indicator database
One email unlocks 1,380+ free MT4, MT5 and TradingView indicators — the complete library. No single-tool download; you get the whole database.
Where it fails
The rule fails in four clear ways.
It cannot tell a dip from a turn. The trigger fires on the first close back across the 20 EMA. Yet that same close also appears just before many trends roll over. The GBPUSD and GBPJPY losses both look like this: a neat signal, then a reversal.
The trend filter is slow. The 200 SMA moves very little from day to day. So the rule can keep taking trades in the old direction for weeks after a trend has ended. Our GBPUSD chart shows one such late signal.
Ranges cut it to pieces. When price chops around the 20 EMA, the rule sees a pullback and a trigger every few bars.
Stops sit at obvious places. The stop goes just past the pullback’s extreme. That is where many traders put theirs, so a small push beyond it can end the trade before the move resumes.
Finally, the result changes a lot by pair. A strategy that loses 17.7R on one pair and makes 20.7R on another with the same rule is not stable. Choosing the good pairs after seeing these results would be curve fitting, not a fix.
One clean win and one clean loss
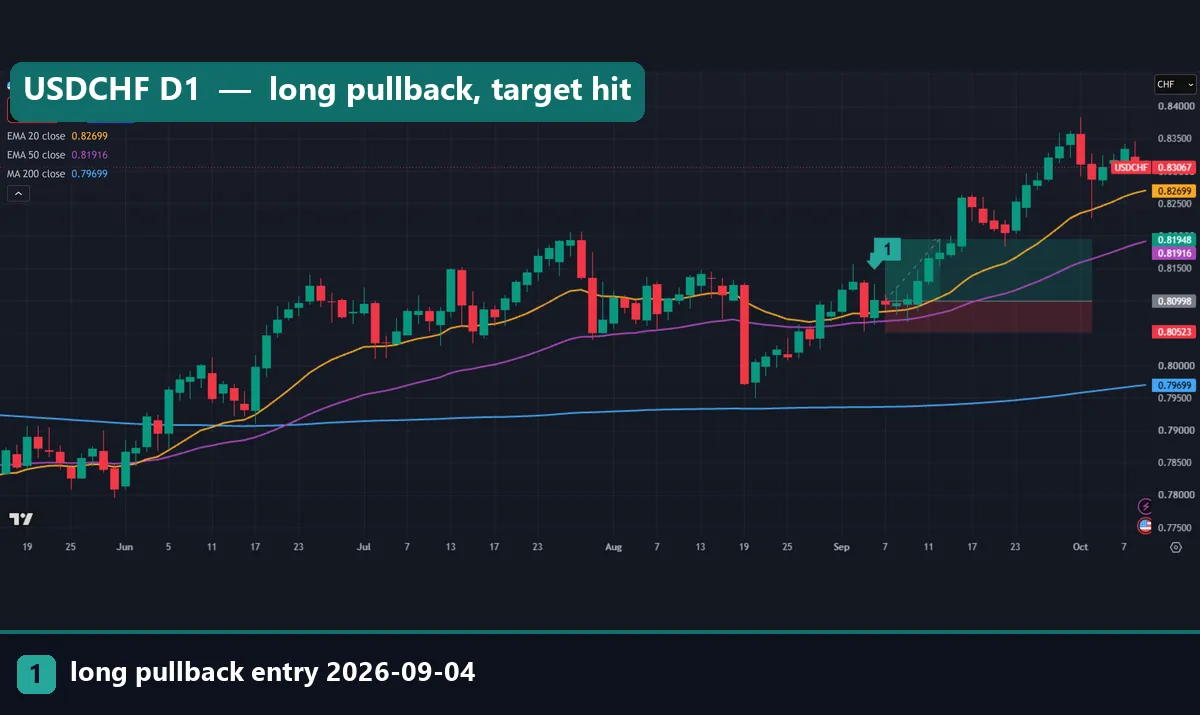
The USDCHF chart shows a long signal dated 4 September 2026. All three lines were stacked in order, with the 50 EMA far above the 200 SMA. Entry was 0.80998, the stop 0.80523 and the target 0.81948. That is 47.5 pips of risk and 95 pips of target. Price climbed steadily and reached the target in under two weeks.
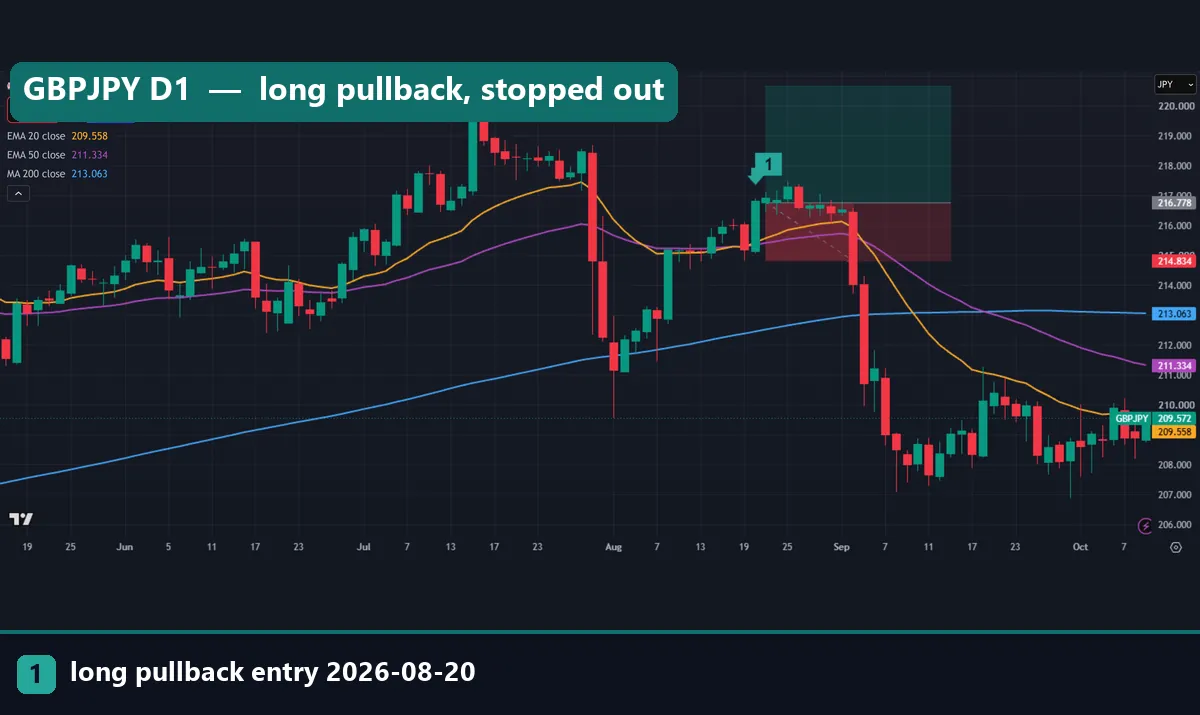
The GBPJPY chart shows the opposite. The long signal is dated 20 August 2026. Entry was 216.778, the stop 214.834 and the target 220.666, so the stop sat 1.944 yen away. Price went sideways for about two weeks, then broke down hard through the stop. After that, the 20 EMA crossed below the 50 EMA and the whole trend turned. Yet GBPJPY was still the best pair in the full test, which shows how noisy single trades are.
Common mistakes with pullback trading
1. Judging the rule by its best charts. Our five sample charts went three wins and two losses. The full test lost money.
2. Ignoring costs. A rule near -0.01R per trade before costs cannot survive spread and swap. Check costs before anything else.
3. Moving the stop wider after entry. It changes 1R mid-trade and breaks every number in your plan. Our guide on how to use a stop loss covers this.
4. Trading every pair the same way. Results ranged from -17.7R to +20.7R by pair. If you want to keep only some pairs, test that choice on fresh data first, for example with walk-forward analysis.
Where to go next
If you want to build on this rule, change one thing at a time and test it on data you did not use to design it. Our moving average crossover strategy guide tests a related entry with the same honest method. For a wider view of swing setups, read how to swing trade forex.
For outside reading, StockCharts explains both average types in its moving averages lesson at StockCharts ChartSchool. BabyPips has a short pullback definition at BabyPips Forexpedia. The history of the wider idea is in trend following trading on Wikipedia. And if you code the rule in MT4 or MT5, the iMA function in the MQL5 documentation returns the moving averages it needs.
FAQ about the trend pullback strategy
What is a trend pullback strategy?
It is a method that waits for a trend, then enters after a short move against it ends. Our version used the 20 EMA, 50 EMA and 200 SMA on daily charts, with a stop past the pullback and a 2R target.
Did the trend pullback rule make money in your test?
No. Across 1,737 trades on 23 FX pairs from June 2018 to August 2026, it lost 20.1R before costs. Only 12 of the 23 pairs finished positive.
Which pairs did best?
GBPJPY made +20.7R over 86 trades and USDJPY +19.1R over 66 trades. All six yen pairs were positive. That lean is modest, and we have not tested it out of sample.
How often did the 2R target get hit?
In 22.9% of trades. Another 55.4% hit the stop, and 21.7% closed at the 20-bar time exit. A pure 2R-or-1R system needs 33.3% target hits just to break even.
Why use the 200 SMA as the trend filter?
It is slow and widely watched, so it gives a clear trend side. The cost is lag: it keeps pointing the old way for weeks after a trend turns, and that can produce late losing signals.
Do the results include spread and swap?
No. The MT4 history we used does not store usable spreads, so every figure is before spread, swap and commission. Real results would be lower.
Can I use this rule on lower timeframes?
We only tested it on the daily chart. Lower timeframes have more noise and higher costs per R, so test any change on fresh data before trusting it.
Is a trend pullback strategy safe for beginners?
It is easy to learn, but our test found no reliable edge, so treat it as a study tool, size every trade small and keep a hard stop; results are not guaranteed; past performance is not indicative of future results.
Last updated: 5 October 2026.

About the author
Written by Dominic Walsh, a Forex trader and MT4/MT5 indicator, Expert Advisor and script developer. Every tool on forexmt4systems.com is tested on live charts before release and ships with ready-to-use compiled MT4 (.ex4) and MT5 (.ex5) files. Learn more about the trader and developer behind this site.
How we build, test and correct every tool: Editorial & Testing Policy. Trading carries risk; see the disclaimer.