
The 20 EMA is the short-term trend line most traders reach for first. It sits close enough to price to be useful intraday, yet far enough away to filter ordinary noise. This guide covers how the average is built, why the number 20 became a default, the pullback entry it supports, and the market conditions where it stops working entirely.
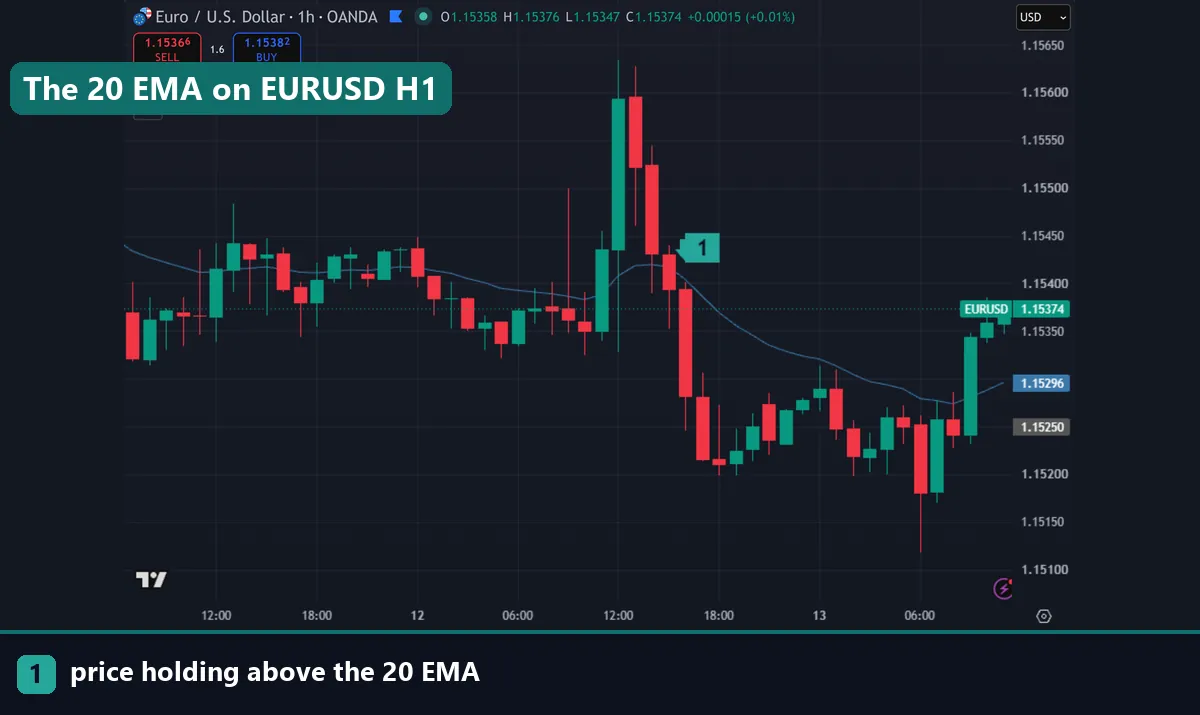
How the 20 EMA is calculated
An exponential moving average weights recent prices more heavily than old ones. A simple moving average treats every bar in the window equally, so a large candle twenty bars ago still carries full weight. The exponential version fades that influence smoothly.
The maths uses a smoothing constant. For a 20-period average that constant is 2 divided by 21, which is roughly 0.0952. Each new value is the current close multiplied by that constant, plus the previous EMA multiplied by the remainder.
EMA = (close × 0.0952) + (previous EMA × 0.9048)
The recursion means the average never fully forgets older data, it simply weights it less each bar. In practice the 20 EMA turns faster than a 20-period simple average and hugs price more closely during a trend.
Why 20 became the default
Twenty is roughly one month of trading days, which is where the convention started. On intraday charts it has no calendar meaning at all, yet it survived because the period sits in a useful middle ground.
Shorter averages such as the 9 or 10 track price so closely they offer little filtering. Longer ones such as the 50 or 200 define the bigger picture but sit too far away to guide an intraday entry. The 20 lands between the two, close enough to be touched during normal pullbacks and far enough to ignore single-bar spikes.
There is nothing magic in the number. A 21 EMA behaves almost identically, and many traders use it because 21 is a Fibonacci number. The difference over a hundred trades is negligible.
The pullback entry
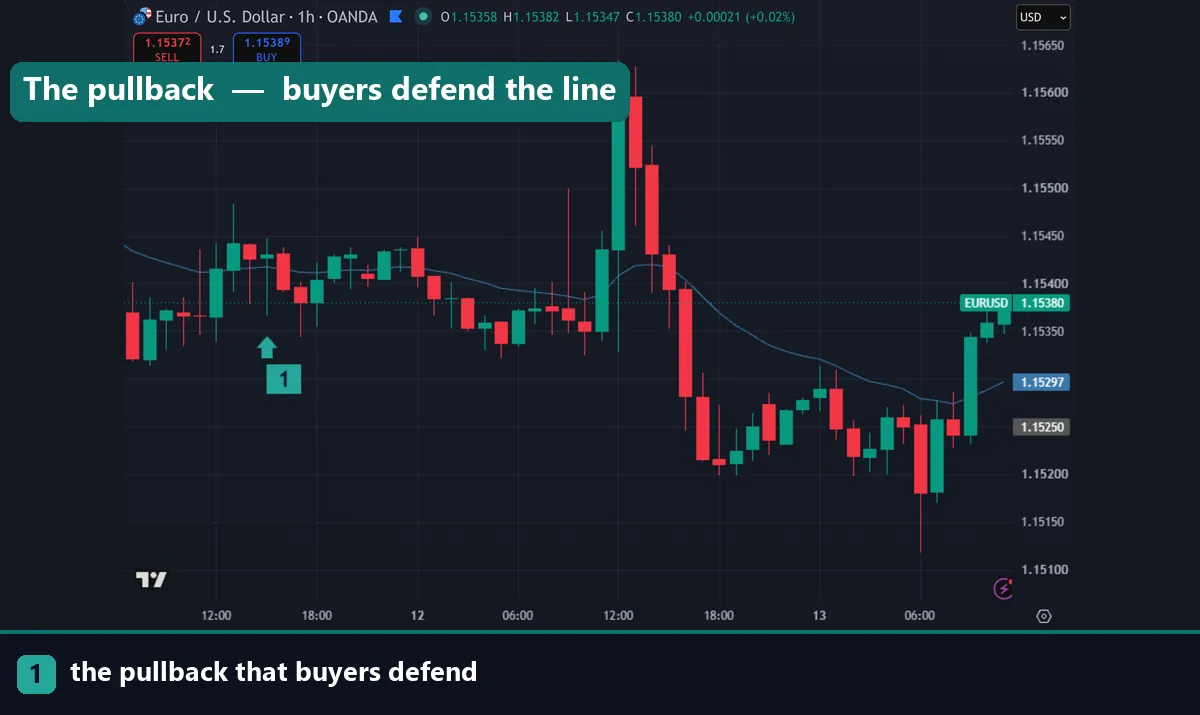
The most common use of the 20 EMA is a trend-continuation entry. The sequence has three parts and each one matters.
First, establish that a trend exists. Price should be making higher highs and higher lows, sitting above a rising 20 EMA. A flat average means no trend, and the setup does not apply.
Second, wait for price to pull back to the average. The best versions touch it and stall rather than slicing through. A rejection candle at the line, such as a pin bar with a long lower wick, adds weight.
Third, take the entry on the resumption rather than the touch itself. Buying the moment price reaches the average means guessing that it will hold. Waiting for a candle to close back in the trend direction costs a few pips and removes most of the guesswork.
The stop belongs beyond the swing low that formed at the pullback, not immediately under the average. Our guide on how to use ATR as a stop loss gives a volatility-based alternative.
The 20 EMA with a slower average
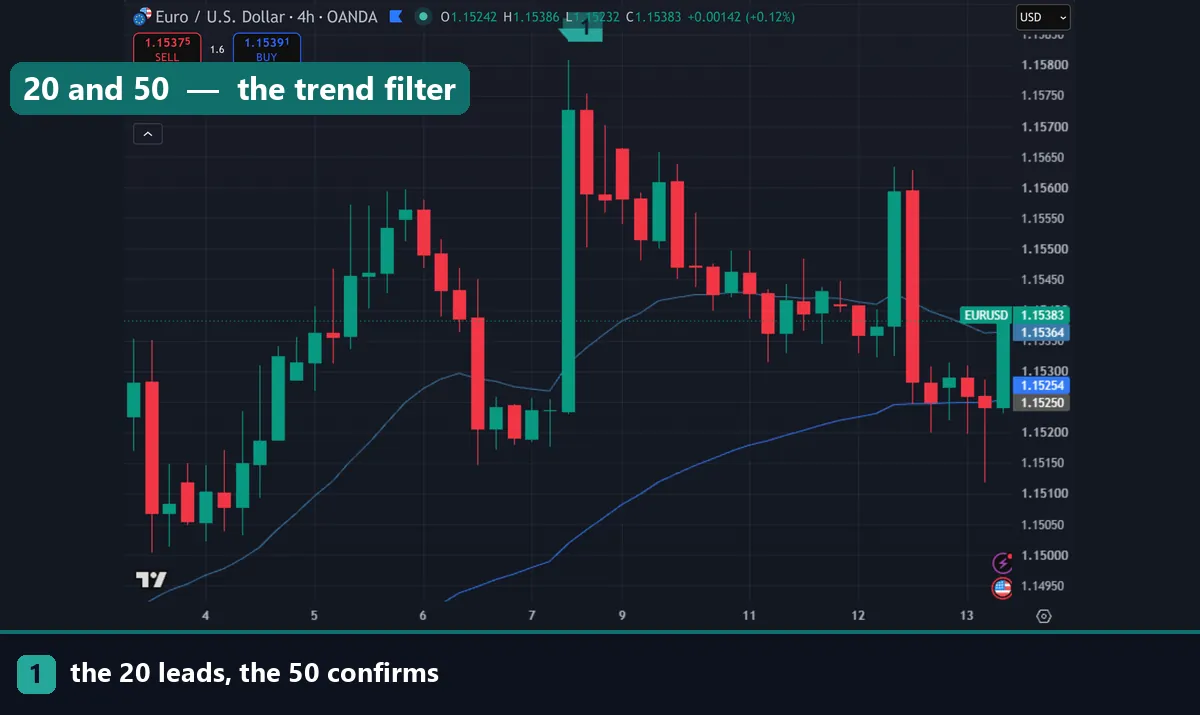
Pairing the 20 with a slower average turns it from a line into a system. The 20 and 50 combination is the most widely used on intraday charts.
The 20 leads and the 50 confirms. When the 20 sits above the 50 and both point up, you have a trend worth trading in one direction only. A cross of the 20 through the 50 flags a possible change of regime, though it always arrives after the move has begun.
Adding a 200 EMA gives a third layer. Many traders use it purely as a filter: longs only above it, shorts only below. That single rule removes a large share of counter-trend trades. Full rule sets live in our EMA trading strategies guide.
Where the 20 EMA fails
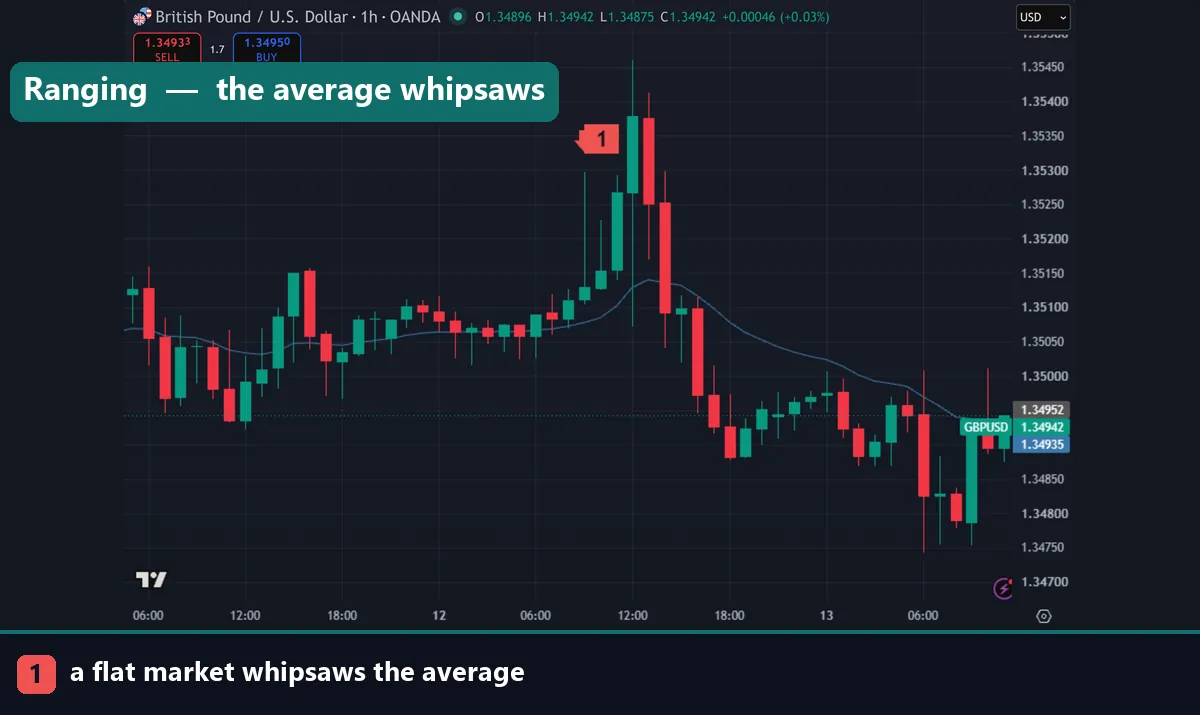
Every moving average has the same weakness, and pretending otherwise costs money. In a ranging market the 20 EMA sits in the middle of the range while price crosses it repeatedly. Each cross looks like a signal and almost none of them lead anywhere.
The lag is structural too. The average is built from closed bars, so it always turns after price does. At a genuine reversal you will be late by several bars, which is the price you pay for the smoothing that makes it useful the rest of the time.
Gaps and news spikes distort it as well. One outsized candle drags the average enough to change its slope, and it takes several bars to settle. Around a scheduled release, the line tells you about the spike rather than the trend.
A simple test keeps you honest. If the 20 EMA is roughly flat and price has crossed it three or more times in the last twenty bars, the market is ranging and the pullback setup is off the table.
Download the complete indicator database
Put these concepts on your charts. One email unlocks the full library of 1,380+ indicators with compiled MT4 and MT5 files, plus my TradingView scripts. No paywall, no spam, unsubscribe any time.
Get free access to my indicator database
One email unlocks 1,380+ free MT4, MT5 and TradingView indicators — the complete library. No single-tool download; you get the whole database.
Settings worth changing, and settings worth leaving
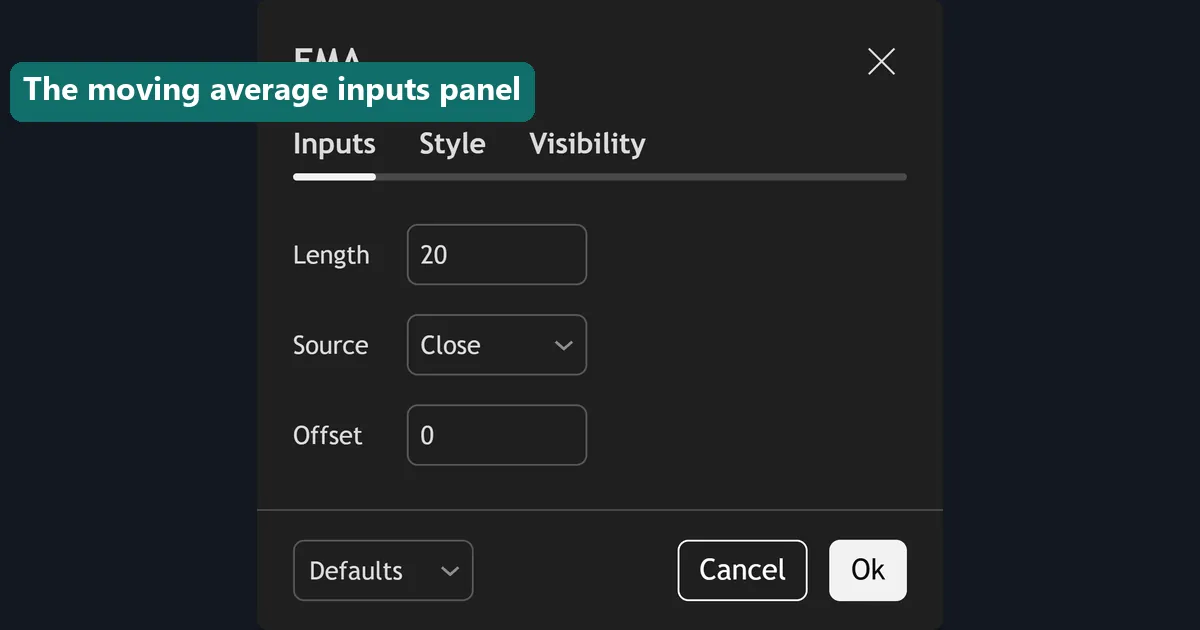
Two inputs matter. The length is the obvious one, and moving between 18 and 22 makes very little difference to results. If the 20 feels too slow for your style, the meaningful change is to 9 or 10, not to 19.
The source matters more than people expect. Most platforms default to the close, which is the right choice for most work. Switching to the median price, meaning the average of the high and low, produces a slightly smoother line that ignores where the bar closed. Some traders prefer it in choppy conditions.
Timeframe changes the character more than either input. A 20 EMA on H4 covers a little over three days and defines a genuine swing trend. The same average on M5 covers under two hours and reacts to almost everything. Pick the timeframe that matches your holding period, then leave the length alone.
Common mistakes with the 20 EMA
Four repeat. Trading every cross of price through the line is the most costly, since in a range that means constant losses. Using it as exact support or resistance comes second: it is a moving reference, not a level, and price routinely overshoots it. Third, traders apply the pullback setup in a flat market where no trend exists. Fourth, they keep changing the length after losing runs instead of questioning the market condition.
Where to go next
The 20 EMA works best inside a wider method. Our forex currency trading strategies show complete rule sets built around trend filters, and forex swing trading strategies apply the same ideas on higher timeframes. For tools that complement a moving average, see the best day trading technical indicators. To load a custom EMA variant, follow how to install MT4 and MT5 indicators. For further reading, Investopedia explains the exponential moving average at Investopedia. For the wider family of averages, see the moving average article on Wikipedia.
FAQ
What is the 20 EMA used for?
It marks the short-term trend and acts as a dynamic reference during pullbacks. Traders use it to define direction, to time continuation entries when price returns to the line, and as a filter alongside slower averages.
Is the 20 EMA better than the 20 SMA?
Neither is better; they behave differently. The exponential version weights recent bars more heavily, so it turns sooner and hugs price more closely. The simple version is smoother and less reactive around single large candles.
Which timeframe suits the 20 EMA?
H1 and H4 are the common choices, because the average then covers a meaningful window without reacting to every spike. On M5 it moves too fast for most methods, and on the daily chart it defines a multi-week trend.
Should I use 20 or 21 for the period?
The difference is negligible over a large sample. Twenty comes from the trading-month convention and 21 from the Fibonacci sequence. Pick one and keep it, since switching between them adds nothing.
How do I avoid false signals in a range?
Check the slope first. A flat average with price crossing it repeatedly means no trend, so the pullback setup does not apply. Wait for a clear sequence of higher highs and higher lows before trading the line.
Can I trade using only the 20 EMA?
It gives direction, not a complete method, and it lags at every turn. Pair it with structure, a level or a momentum tool. Trading involves risk, results are not guaranteed, and past performance is not indicative of future results.

About the author
Written by Dominic Walsh, a Forex trader and MT4/MT5 indicator, Expert Advisor and script developer. Every tool on forexmt4systems.com is tested on live charts before release and ships with ready-to-use compiled MT4 (.ex4) and MT5 (.ex5) files. Learn more about the trader and developer behind this site.
How we build, test and correct every tool: Editorial & Testing Policy. Trading carries risk; see the disclaimer.