
A moving average crossover strategy buys when a fast average crosses above a slow one and sells when it crosses back below. We ran three popular pairs of averages on 23 daily FX pairs from 2018 to 2026, and this guide settles what they did. The short answer: none of the three made money on most pairs, even before costs. Most trades lost, and a few large trends paid for the rest.
What a moving average crossover strategy is
A moving average smooths price into one line. A crossover system uses two of them. The fast line has a short length, so it reacts quickly. The slow line has a long length, so it lags. When the fast line moves above the slow line, the recent average price is higher than the older one. That is the buy signal, often called a golden cross. When it moves below, that is the sell signal, or death cross.
In its pure form the system is always in the market. A golden cross closes the short and opens a long. Then a death cross closes the long and opens a short. There is no stop loss and no target. The next cross is the exit.
The idea is simple trend following. You will never catch the top or the bottom. Instead, you aim to hold the middle of a long move. If you want the basics of the lines first, read our page on how moving averages are calculated. Also see the wider topic of trend following trading, which this system is a small part of.
How it works: the formula behind a cross
Two kinds of average cover most crossover setups. A simple moving average (SMA) adds the last n closes and divides by n. Every close in the window has the same weight.
An exponential moving average (EMA) gives more weight to recent bars. Its formula is EMA = alpha x close + (1 - alpha) x previous EMA, where alpha = 2 / (n + 1). For a 9-period EMA, alpha is 0.2. For a 50-period EMA, it is about 0.039. That is why the EMA turns sooner than an SMA of the same length. Our guide to SMA vs EMA compares the two in more depth.
A cross happens on bar t when the fast line is above the slow line on that bar, but was at or below it on the bar before. In Pine Script terms, that is ta.crossover(fast, slow). The reverse test gives the death cross.
One point matters a lot. The cross is only final when the bar closes. During the bar, both averages move with every tick. A cross can appear at midday and vanish by the close. For that reason, our test only acts on a closed bar and enters at the next open. The MetaTrader function that returns these lines is documented in the iMA reference in the MQL4 documentation.
How we tested it
We ran the test on daily history from a MetaTrader 4 terminal, build 1471, with Capital Point Trading data. It covers 23 FX pairs from 12 June 2018 to 24 August 2026, a total of 37,748 daily candles.
The rule was the same for every pair. First, we went long while the fast average sat above the slow one. Next, we went short while it sat below. Then we switched at the next daily open after a close-confirmed cross. Returns are percent of price, summed over all trades. They are before spread, swap and commission, so they flatter the system.
We tested three common pairs of settings: SMA 50/200, EMA 20/50 and EMA 9/21. The two slower systems produced results on 22 pairs. EMA 9/21 produced results on all 23.
The chart images come from a TradingView web chart with OANDA data, captured on 5 October 2026. They show EURUSD and GBPUSD on the daily chart, and USDJPY and GBPUSD on the hourly chart. The cross dates in our labels come from those same OANDA bars. Our full method is on the editorial testing policy page.
Settings and parameters we tested
| Input | What it does | Our test |
|---|---|---|
| Fast length | Short average that triggers the cross | 50, 20 or 9 |
| Slow length | Long average that sets the trend | 200, 50 or 21 |
| Average type | SMA weights bars equally; EMA favours recent bars | SMA for 50/200, EMA for the others |
| Source | Price fed into the average | Close |
| Confirmation | When a cross counts | Bar close, act at next open |
| Exit | What ends a trade | The opposite cross only |
| Timeframe | Bar size | Daily |
| System | Trades | Profitable trades | Pairs positive | Median pair net |
|---|---|---|---|---|
| SMA 50/200 | 195 | 27.7% | 6 of 22 | -5.1% |
| EMA 20/50 | 730 | 25.5% | 8 of 22 | -6.4% |
| EMA 9/21 | 1,754 | 28.5% | 8 of 23 | -6.4% |
Reading the crosses on a chart
A cross looks clear on a finished chart. In real time it is much less clear. Look at GBPUSD on the daily chart below. The 50 and 200 SMAs crossed down on 9 July 2026 and back up on 2 September 2026. For most of that summer, the two lines ran almost on top of each other. Price swung above and below both of them.
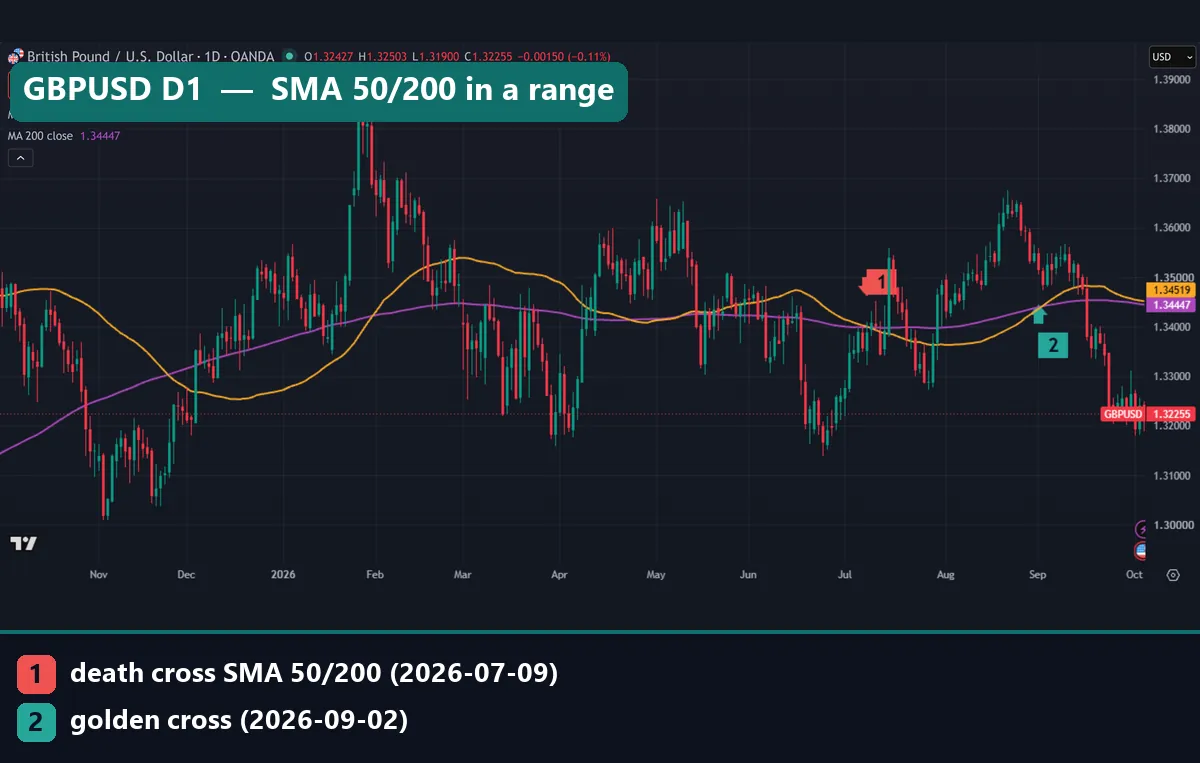
On the day of the death cross, the 50 SMA stood at 1.33972 and the 200 SMA at 1.33987. That is a gap of only 1.5 pips. In other words, a tiny change in price would have flipped the signal. When two averages are that close, the cross tells you the market is flat, not that a trend has begun.
Faster averages cross far more often. Next, look at USDJPY on the hourly chart with EMA 9 and EMA 21. There was a death cross at 05:00 UTC on 2 October. Then came another death cross at 00:00 UTC on 5 October, and a golden cross just two hours later at 02:00.
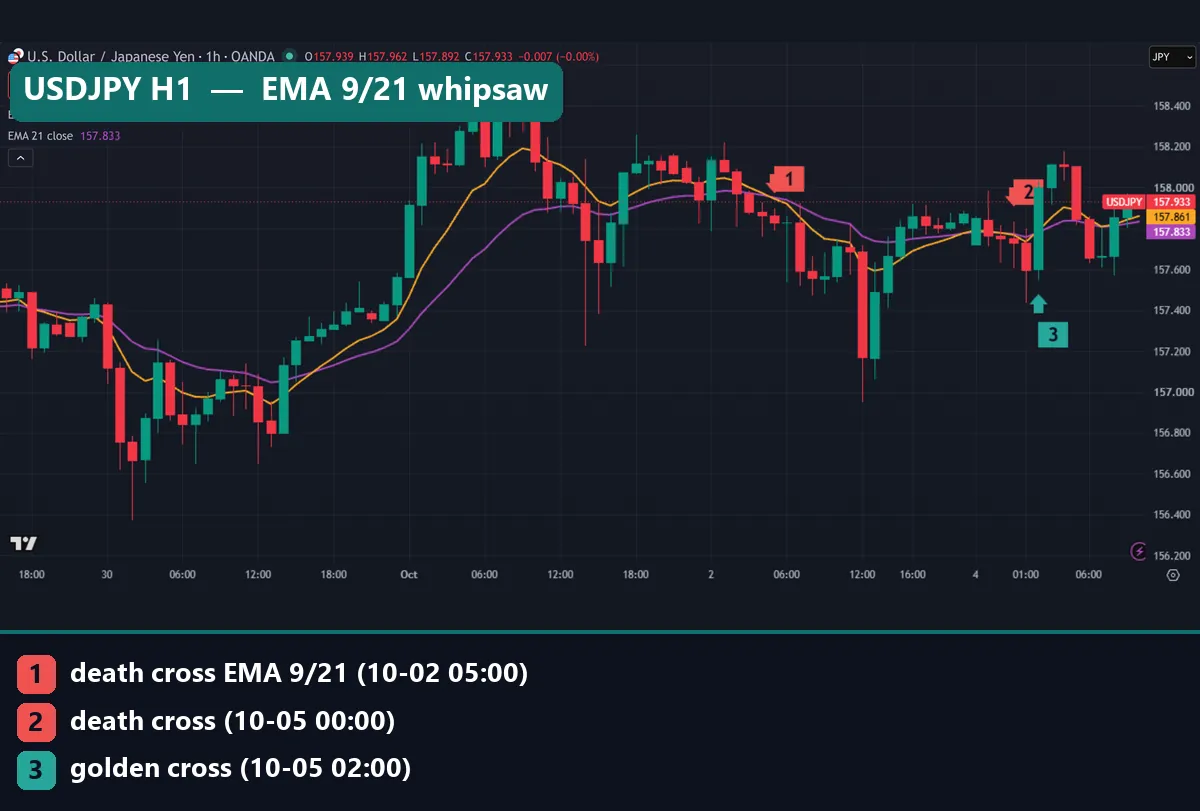
That is the whipsaw problem in one picture. Each flip costs a spread.
Worked example: EURUSD EMA 20/50 on the daily chart
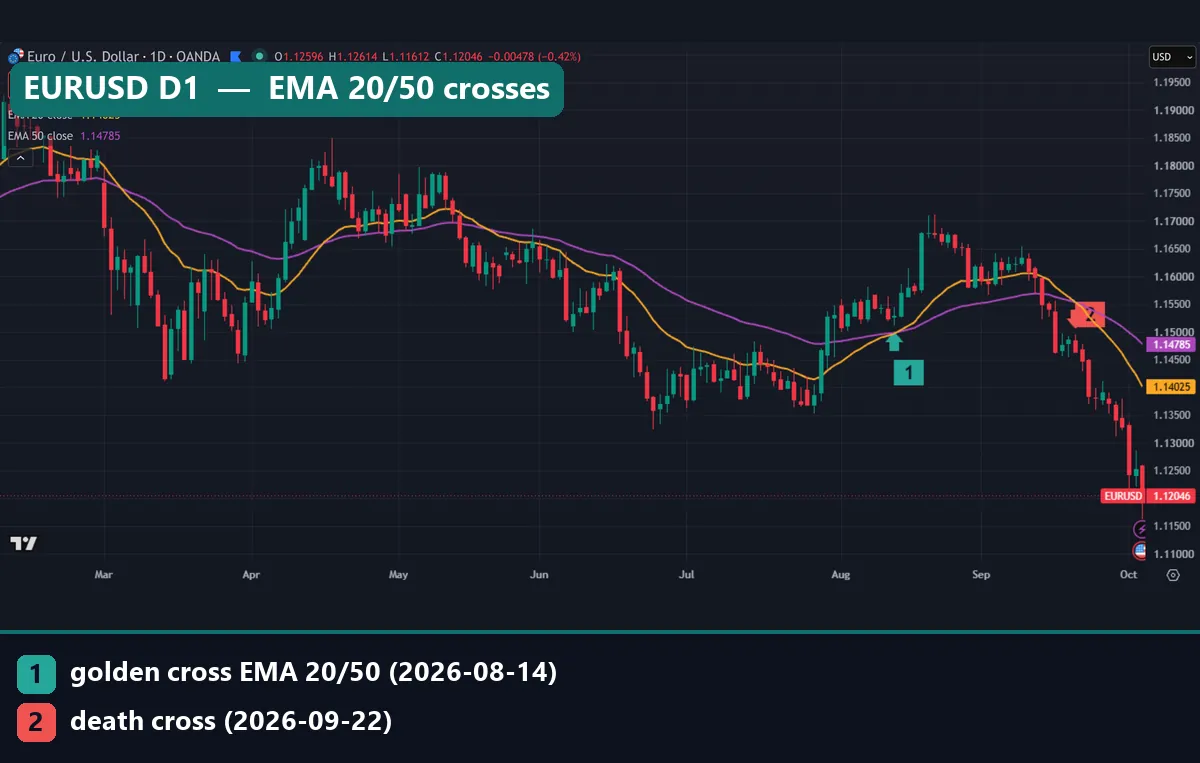
Go back to the first chart, EURUSD daily with EMA 20 and EMA 50. Here is how one full trade played out, using the OANDA bars from our capture.
- On 14 August 2026 the EMA 20 closed at 1.15035, just above the EMA 50 at 1.15011. That is a golden cross. The day closed at 1.15704.
- Price then rallied. On the chart, it reached about 1.17 in the second half of August.
- However, the system has no target, so it held on. Price fell back through September.
- On 22 September 2026 the EMA 20 closed at 1.15441, below the EMA 50 at 1.15492. That is the death cross. The day closed at 1.14486.
So, measured from close to close, the long lost 1.15704 minus 1.14486, which is 121.8 pips. Our rule enters at the next open, so the exact figure would differ a little. But the lesson holds. The trade was well in profit near 1.17 and still ended as a loss, because the exit only comes after the slow line turns.
Then the new short worked. At our capture on 5 October, EURUSD traded at 1.12046. That is the pattern of the whole test. A loser, then a winner, and the result depends on how big the winner is.
What our test found across 23 pairs
The first chart shows the net result for each pair and each system. Bars to the right of zero made money before costs. Bars to the left lost.
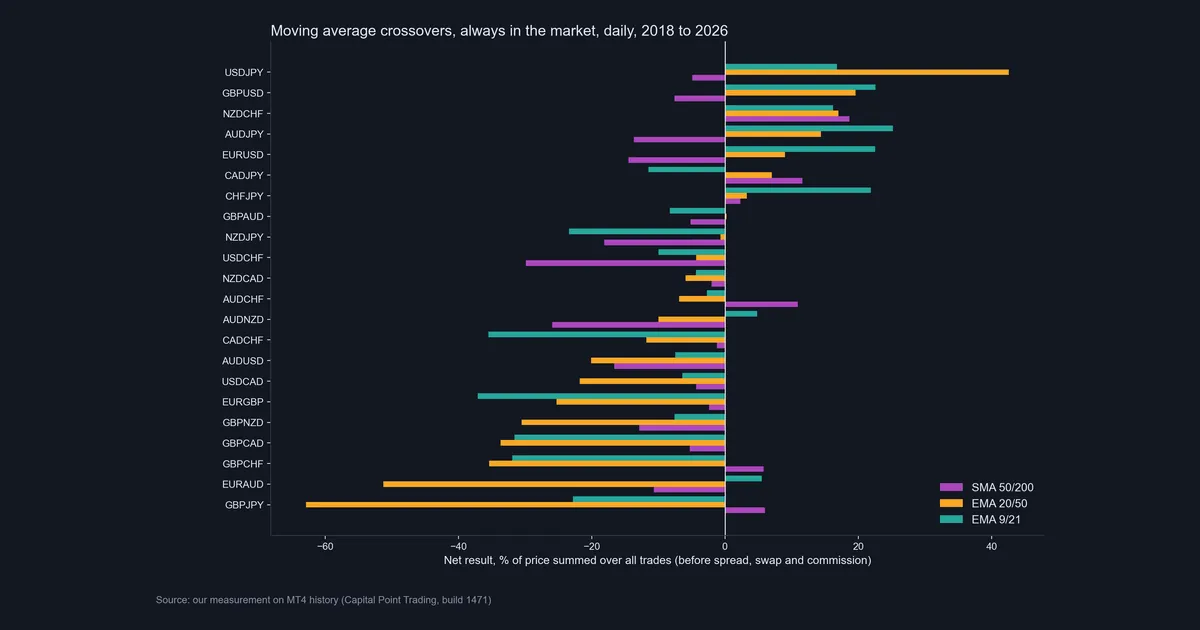
Most bars sit on the left. The best single result was EMA 20/50 on USDJPY at +42.6%, over 23 trades. Yet the same system lost 62.9% on GBPJPY and 51.3% on EURAUD. Also, a pair that worked with one setting often failed with another. EURUSD gained 22.5% with EMA 9/21 but lost 14.5% with SMA 50/200.
Next, the second chart compares the three systems side by side.
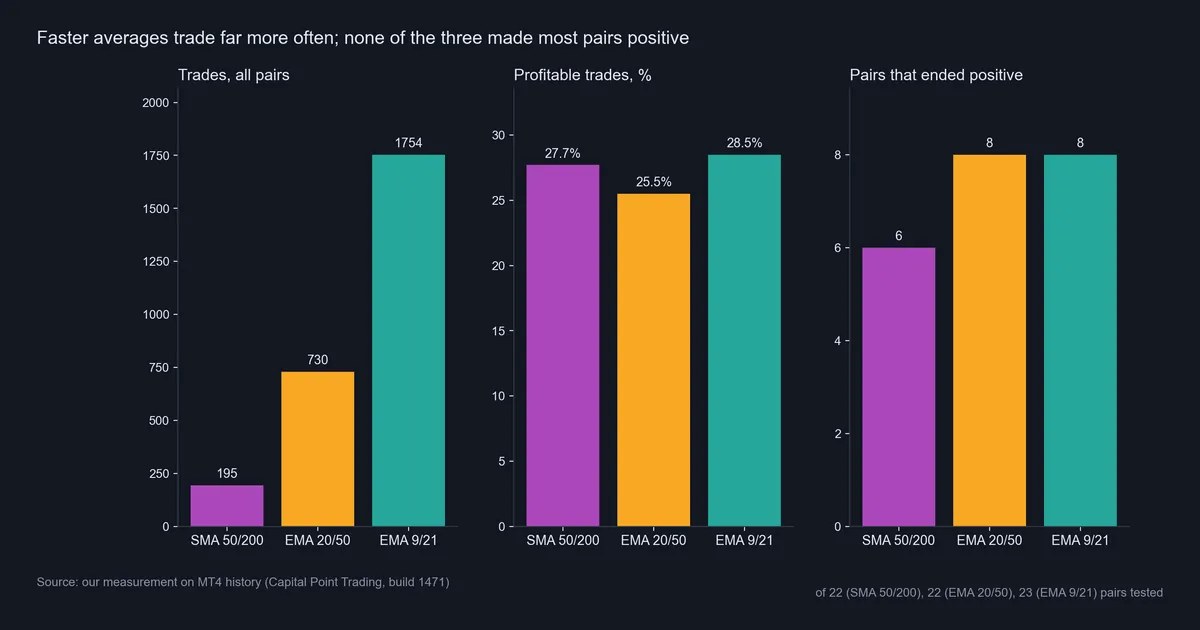
Faster averages traded far more: 195 trades for SMA 50/200, 730 for EMA 20/50 and 1,754 for EMA 9/21. Even so, the share of trades that made money stayed between 25.5% and 28.5%. In short, roughly three trades in four lost money.
The typical trade lost, too. Across all 67 pair and system results, only one had a positive median trade: SMA 50/200 on NZDCHF, at +1.23%. Every other median was below zero. So the systems lived on a few large trends, such as the +26.7% EMA 20/50 trade on USDJPY. Without those, nothing was left.
Download the complete indicator database
Put these concepts on your charts. One email unlocks the full library of 1,380+ indicators with compiled MT4 and MT5 files, plus my TradingView scripts. No paywall, no spam, unsubscribe any time.
Get free access to my indicator database
One email unlocks 1,380+ free MT4, MT5 and TradingView indicators — the complete library. No single-tool download; you get the whole database.
Where it fails
The method has clear weak spots, and our data shows each of them.
- Ranges. When price moves sideways, the averages wind around each other. The GBPUSD summer above is a typical case. Each cross is a coin flip that costs money.
- Whipsaws. Many trades end within days. With EMA 9/21, 43.5% of USDJPY trades lasted under 10 bars, and on CADCHF it was 53.4%. Even the slow SMA 50/200 had 29.4% of GBPCAD trades end within 10 bars.
- Lag. The exit only comes after the trend has turned. As the EURUSD example shows, a large open profit can turn into a loss before the cross arrives.
- Costs. Our figures are before costs. Every one of the 1,754 EMA 9/21 trades would pay a spread. Since the system is always in the market, it also pays or earns swap every night. Costs would make every result here worse.
- Drawdowns. The summed drawdown on GBPJPY with EMA 20/50 reached 62.9%.
- Small samples. SMA 50/200 gave only 1 to 17 trades per pair in eight years. NZDCAD produced one trade. Results that small say almost nothing.
Setting the averages up on TradingView
On TradingView, each average is a separate study. You add the built-in EMA (or Moving Average for the SMA) twice, then set each one’s length. The settings dialog is short, as the screenshot shows.
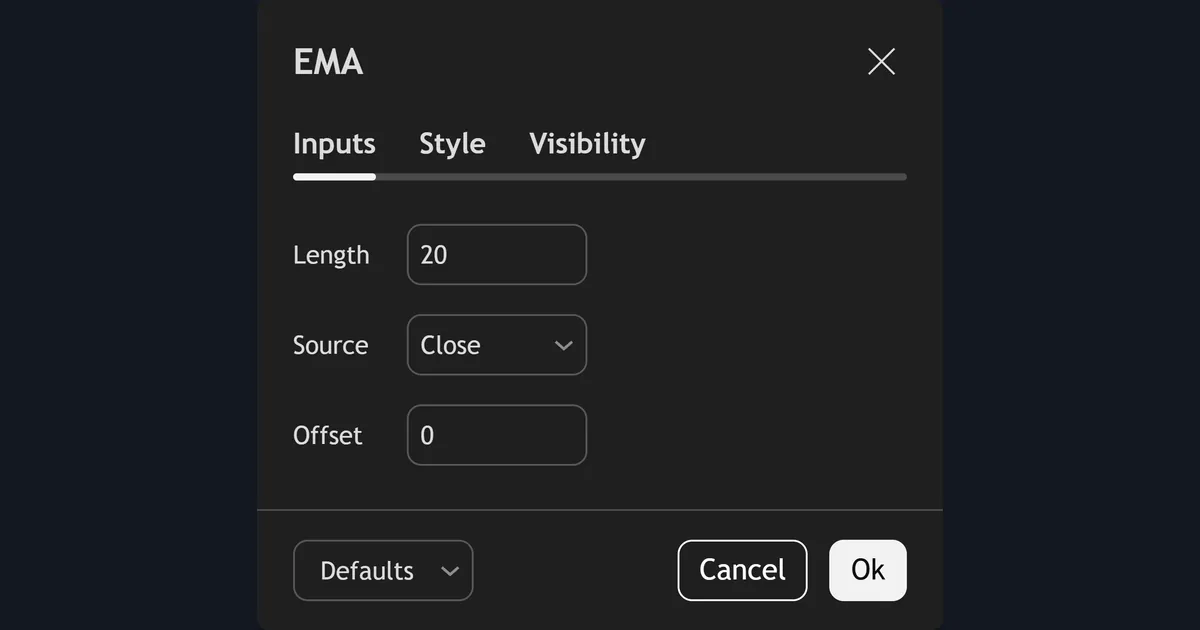
There are three inputs. Length is the number of bars. Source is the price used, which is Close by default. Offset shifts the line left or right on the chart. Leave Offset at 0. The EMA help page in TradingView’s support centre lists the same inputs.
On MetaTrader 4, you would attach the Moving Average indicator twice and set the period and method. If you would rather have the cross marked for you, our moving average crossover alert indicator draws arrows and sends one alert per closed bar.
An hourly whipsaw on GBPUSD
The hourly chart shows the same problem at a faster pace. Here is GBPUSD with EMA 20 and EMA 50, as captured on 5 October 2026.
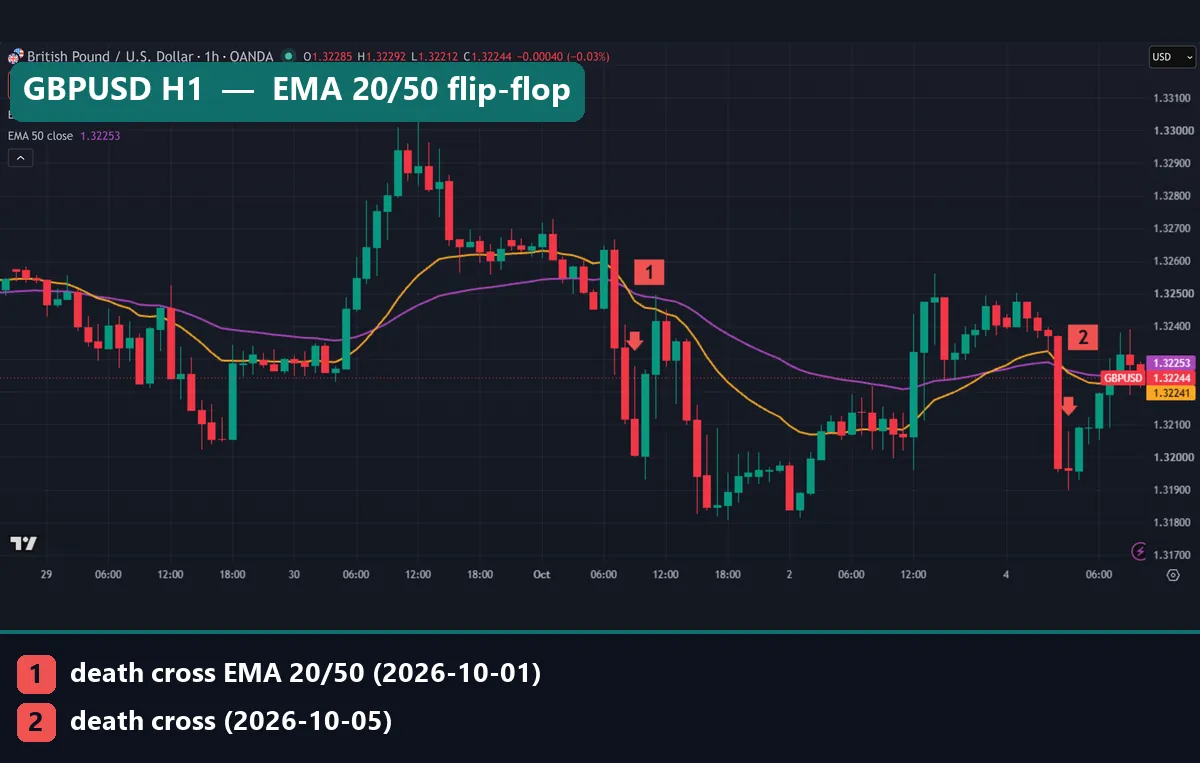
The death cross on 1 October came at 09:00 UTC, with a close of 1.32006. Then a golden cross followed at 20:00 UTC on 2 October, at 1.32405. After that, another death cross printed at 03:00 UTC on 5 October, at 1.31961. So the short lost about 40 pips from close to close. Next, the long lost about 44 pips.
By the time of capture, the EMA 20 sat at 1.32241 and the EMA 50 at 1.32253. The lines were tangled again, which is the setup for the next whipsaw.
Common mistakes with crossover systems
- Acting on an open bar. A cross that appears mid-bar can vanish at the close. Wait for the bar to finish, then act.
- Tuning lengths until the past looks good. In our test the best pair changed with every setting. Picking the winner after the fact is curve fitting, and it rarely holds up on new data.
- Ignoring costs. A fast system with hundreds of trades can look fine before costs and lose after them. Read our note on transaction costs in backtests before you trust any result.
- Trading it with no risk plan. The pure system has no stop, so one trade can run deep against you. Size each position so that a long losing streak, which this method produces often, stays small. Our guide to drawdown in trading explains why.
Where to go next
If you still want to work with crosses, treat them as a trend filter rather than a full system. For example, our guide to the 20 EMA looks at how price behaves around a single average. Our MACD crossover strategy page covers a close cousin, since MACD is the gap between two EMAs. Also, if you plan to test your own version, start with how many trades a backtest needs. Then compare Ichimoku and moving averages as trend tools.
For outside reading, Arthur Hill’s notes on moving average crossovers at StockCharts ChartSchool test similar rules on stocks. The golden cross entry at Investopedia covers the common naming.
FAQ: moving average crossover strategy
Does a moving average crossover strategy work in forex?
Not on most pairs in our test. On 23 daily FX pairs from 2018 to 2026, each of the three systems ended positive on only 6 to 8 pairs, and that was before costs.
What are the best moving averages for a crossover?
Our data shows no clear best. SMA 50/200, EMA 20/50 and EMA 9/21 all had profitable trades between 25.5% and 28.5%, and the best pair changed with each setting.
Is EMA or SMA better for crossovers?
The EMA reacts sooner because it weights recent closes more, so it gives earlier signals but also more whipsaws. Neither type fixed the core problem in our test.
What is a golden cross and a death cross?
A golden cross is the fast average closing above the slow one, read as bullish. A death cross is the reverse. The terms are most often used for the 50 and 200 day averages.
Why did most trades lose money?
Because the averages lag and cross back and forth in ranges. Many trades ended within 10 bars, and only large trends paid for the run of small losses.
Should I use a higher timeframe to cut whipsaws?
Slower settings did trade less: SMA 50/200 made 195 trades against 1,754 for EMA 9/21. Even so, it ended positive on only 6 of 22 pairs, and its samples per pair were small.
Do crossover signals repaint?
The line on a closed bar does not change. The current bar does, so a cross can appear and vanish while the bar is open. Act only on closed bars.
Can I add filters to improve the results?
You can test filters, such as a trend or volatility rule, but each one adds a chance of curve fitting, so check any filter on data you did not tune it on; results are not guaranteed; past performance is not indicative of future results.
Last updated: 5 October 2026.

About the author
Written by Dominic Walsh, a Forex trader and MT4/MT5 indicator, Expert Advisor and script developer. Every tool on forexmt4systems.com is tested on live charts before release and ships with ready-to-use compiled MT4 (.ex4) and MT5 (.ex5) files. Learn more about the trader and developer behind this site.
How we build, test and correct every tool: Editorial & Testing Policy. Trading carries risk; see the disclaimer.