
A whipsaw is a trade signal that reverses soon after you act on it, so you sell a drop and then buy back the rise. This guide settles three things: how often it happens, what it costs, and whether the popular fixes work. We counted 1,754 EMA 9/21 crosses on 23 FX pairs of daily bars. Within 10 bars, 41.0% had flipped back, and those flips made up 63.0% of all losses. The filter that cut flips the most also had the worst average result of the three we tried.
What a whipsaw is
The whipsaw definition at Investopedia describes a price that moves one way, then quickly changes and moves the other way. That is the market’s half of the story. The trader’s half is a rule: it fired, a position went on, and then the same rule fired the opposite way.
So a whipsaw takes a choppy chart plus a rule that acts on it. We use the moving average cross all through this guide because its rule is exact and easy to count. But breakout entries and oscillator levels can get caught the same way.
We also needed a number for “soon”. Here, a cross flipped when the opposite cross came 10 bars or fewer later. Ten bars is our own line, not a market standard. On daily charts it means about two trading weeks. We report 3, 5 and 20 bars too, so you can move the line yourself.
How it works: a late signal on both sides
A moving average cross compares two lines. The exponential version uses the formula on StockCharts ChartSchool’s moving averages page, and the signal comes from the gap between the lines.
k = 2 / (n + 1)
EMA = (close - previous EMA) x k + previous EMA
Cross = (EMA 9 - EMA 21) changes sign on a closed bar
So k is 0.2 for the 9 and about 0.091 for the 21. The fast line gives the latest close a bit over twice the weight. When the gap between the lines reaches zero, the cross fires. For the background, our guide to how moving averages work starts from the basics.
Both lines look backward. TradingView’s Help Center page on moving averages calls them lagging because they react to events that have already happened. The average age of the data in an EMA works out to (n – 1) / 2 bars: 4 bars for the 9 and 10 bars for the 21. Our page on leading and lagging indicators covers that trade-off.
That lag is why a flip hurts twice. A down cross fires after price has already fallen, so you sell low. If price then turns, the up cross fires only after a rise, so you buy back high. You pay the delay at the entry and again at the exit. Then you pay the spread on top.
How we tested
We read daily history for 23 FX pairs from MetaTrader 4, build 1471, on a Capital Point Trading terminal. The window runs from 12 June 2018 to 24 August 2026. That terminal has been offline since late August 2026, so the data stops there.
A cross means the fast average closes on the other side of the slow one. Each cross goes on at the next open and comes off at the next open after the opposite cross. We left out the last cross of each series, since it has no result. Results are in ATR(14) at the cross, which lets a yen cross and a euro pair share one table. Our guide to what ATR means in trading explains the unit. Every result comes before spread, swap and commission.
We repeated the count on H1 for EURUSD, GBPUSD, USDJPY and XAUUSD, but those windows are short. The three FX pairs start on 22 December 2025 and stop in August 2026. Gold runs from 1 July 2025 to 20 August 2026.
The chart images come from the TradingView web chart with OANDA daily bars, so that feed differs from the MT4 history. Treat them as pictures of the pattern, because the counts all come from MT4. Our editorial testing policy sets out how we run and report tests like this one.
Settings we compared
Here is each setting we used, so you can rerun the test on your own data.
| Setting | Value | What it decides |
|---|---|---|
| Fast pair | EMA 9 and EMA 21 | Most signals, shortest holds |
| Middle pair | SMA 20 and SMA 50 | Fewer signals |
| Slow pair | SMA 50 and SMA 200 | Fewest signals |
| Flip line | 3, 5, 10 and 20 bars | What counts as “soon” |
| Result unit | ATR(14) at the cross | Puts all pairs on one scale |
| Sideways test | Previous 40 bars no wider than 6 ATR | Splits narrow markets from wide ones |
| Trend filter | Close on the trade’s side of SMA 200 | Longs above it, shorts below it |
| Delay filter | Fast line still on the new side 2 bars later | Entry moves 2 bars later |
| Gap filter | Lines at least 0.25 ATR apart 2 bars later | Entry moves 2 bars later |
The EMA pair reacts faster for two reasons: shorter periods and more weight on recent closes. Our comparison of SMA and EMA explains that difference, and our 20 EMA guide looks at a single line on its own.
Reading a whipsaw on a chart
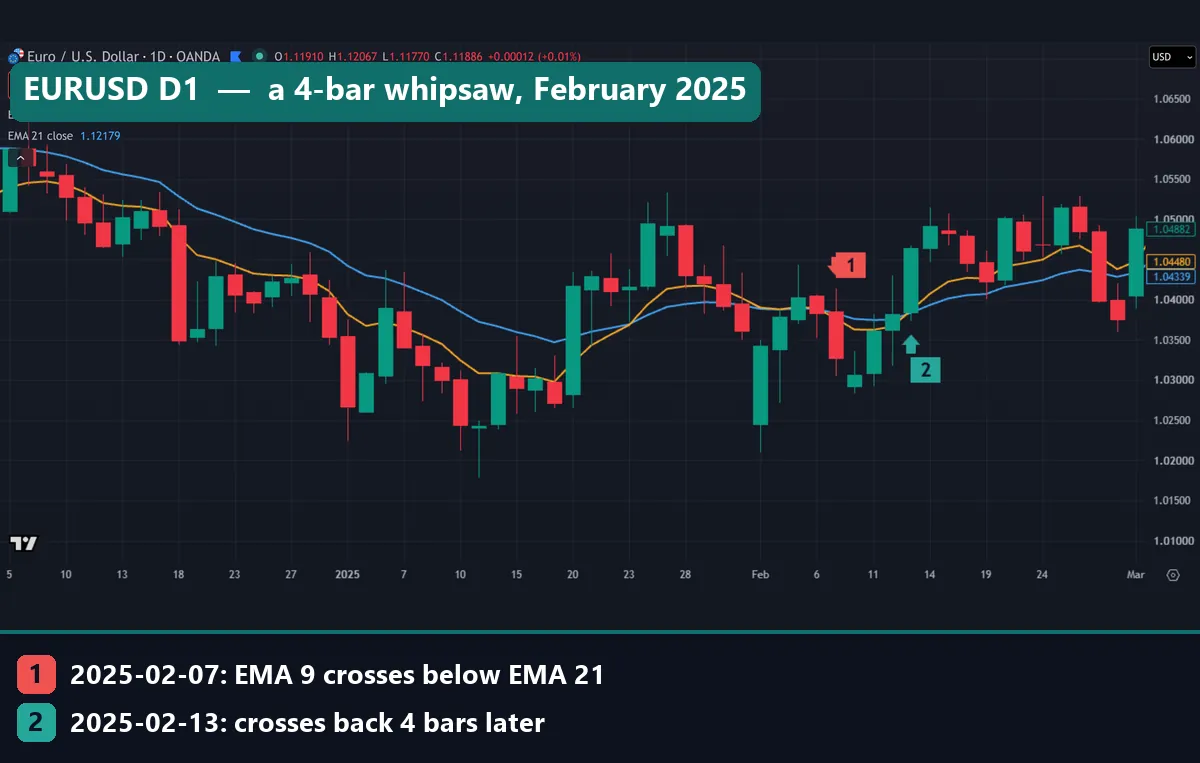
In our captures, the gold line is EMA 9 and the blue line is EMA 21. Marker 1 is the cross and marker 2 is the cross back, with the dates in the strip under each image. Ignore the prices in the top-left legend, since they belong to the latest bar at capture and not to the window on screen. The SELL and BUY boxes are TradingView’s trading buttons, not signals from us.
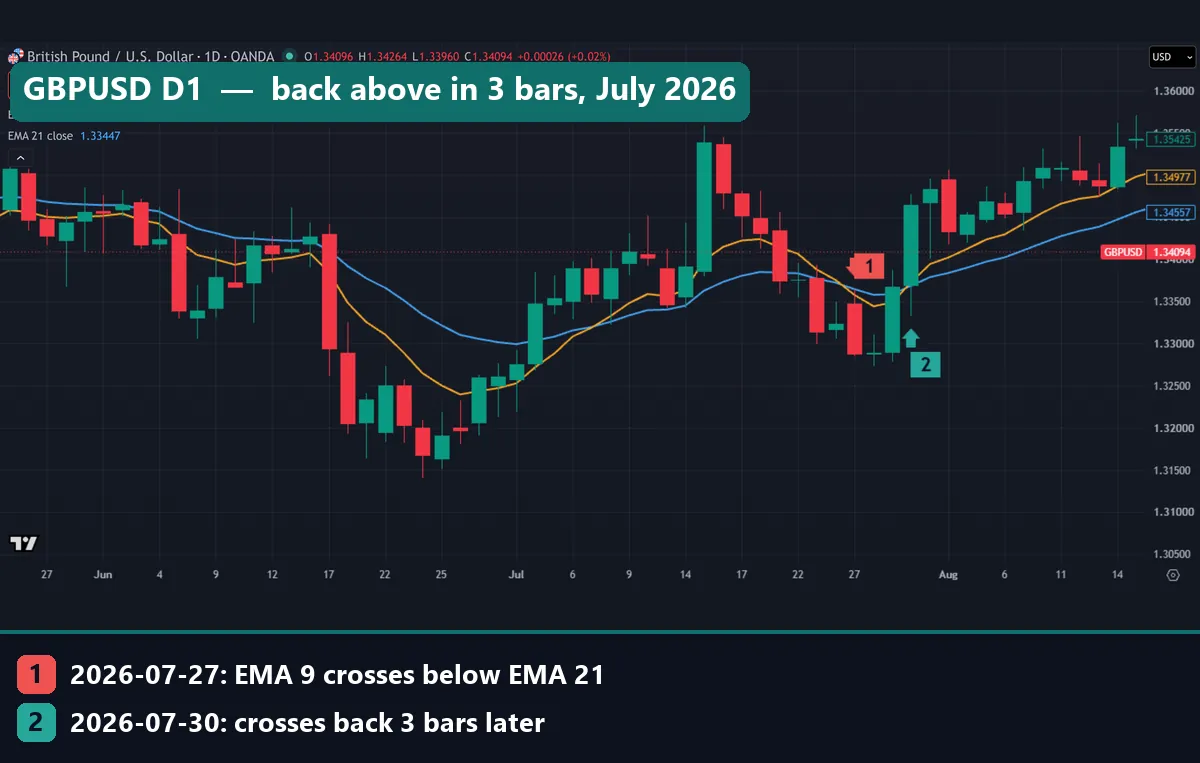
On GBP/USD, the gold line slips under the blue on 27 July 2026, and three bars later it sits back above. Now look at the distance between the lines. It never opens far, and two green candles pull the gold line back. That thin gap is worth noticing, because our gap filter below uses it.
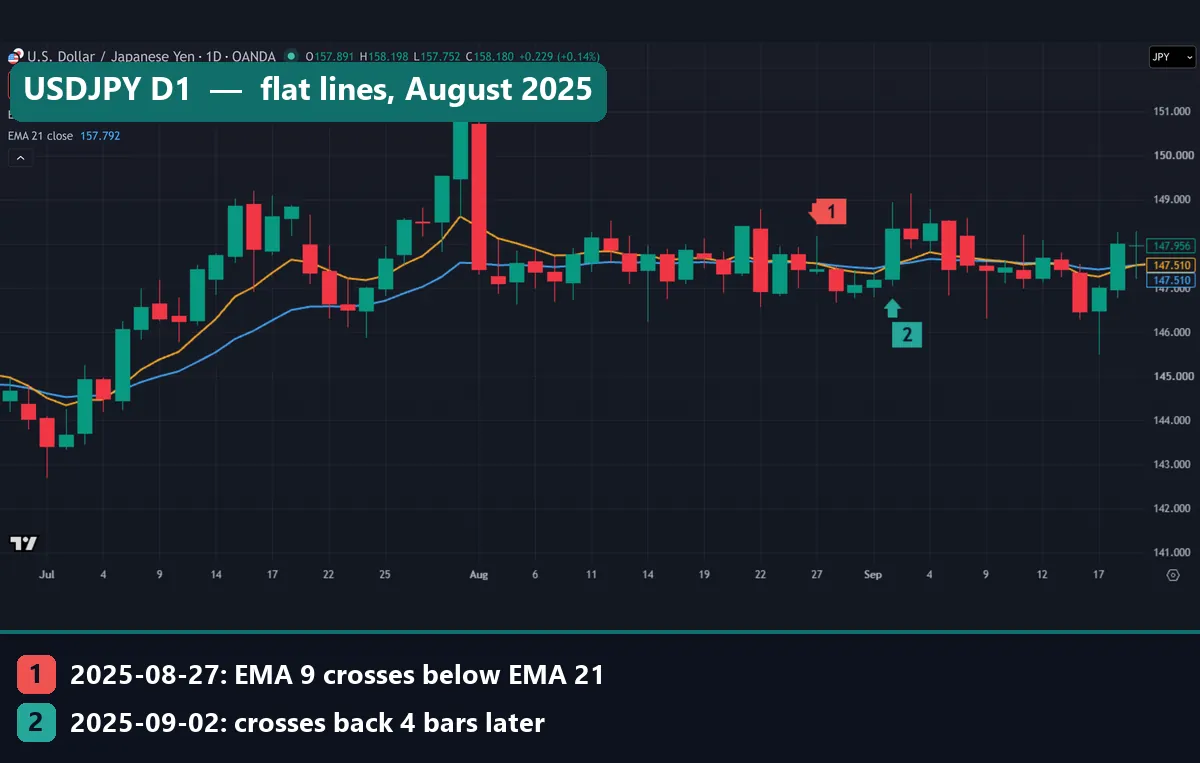
USD/JPY shows the picture most traders have in mind. From mid-August into mid-September 2025, the two lines nearly sit on top of each other while price chops between about 146 and 149. The cross on 27 August 2025 flips back on 2 September, four bars later. At the right edge of the window, both line tags read 147.510. One chart proves little, so we test flat markets later.
Worked example: one flip, then all 1,754
Start with the first image. On 7 February 2025, EMA 9 closed below EMA 21 on OANDA’s EUR/USD daily chart. Our rule sells the next open, near 1.029 on 10 February. On 13 February the lines crossed back, with price closing near 1.046 and both lines still near 1.0385. That close sat about 80 pips above the lines, so the exit signal came late too. The rule buys the next open, also near 1.046. That leaves about 170 pips against you in four bars, before costs.
Now take the whole sample. This table adds up the two groups of EMA 9/21 crosses, using the means from our test, also before costs.
| Group | Crosses | Mean result | Sum |
|---|---|---|---|
| Flipped within 10 bars | 719 | -1.405 ATR | about -1,010 ATR |
| Lasted longer | 1,035 | +0.808 ATR | about +836 ATR |
| All crosses | 1,754 | -0.099 ATR | about -174 ATR |
So the longer crosses paid for most of the flips, but not all of them. The median cross lost 0.859 ATR, and only 28.4% of crosses ended with a gain. Trend systems often have that shape: many modest losses and a few large gains. Our guide to trading expectancy shows how to judge it.
The sums also show how close the total sits to zero. With those two means held still, flips could make up 36.5% of crosses and the total would break even. The real figure was 41.0%. That makes filtering look easy, but the next sections show why it was not.
Slower averages flip less but did not do better
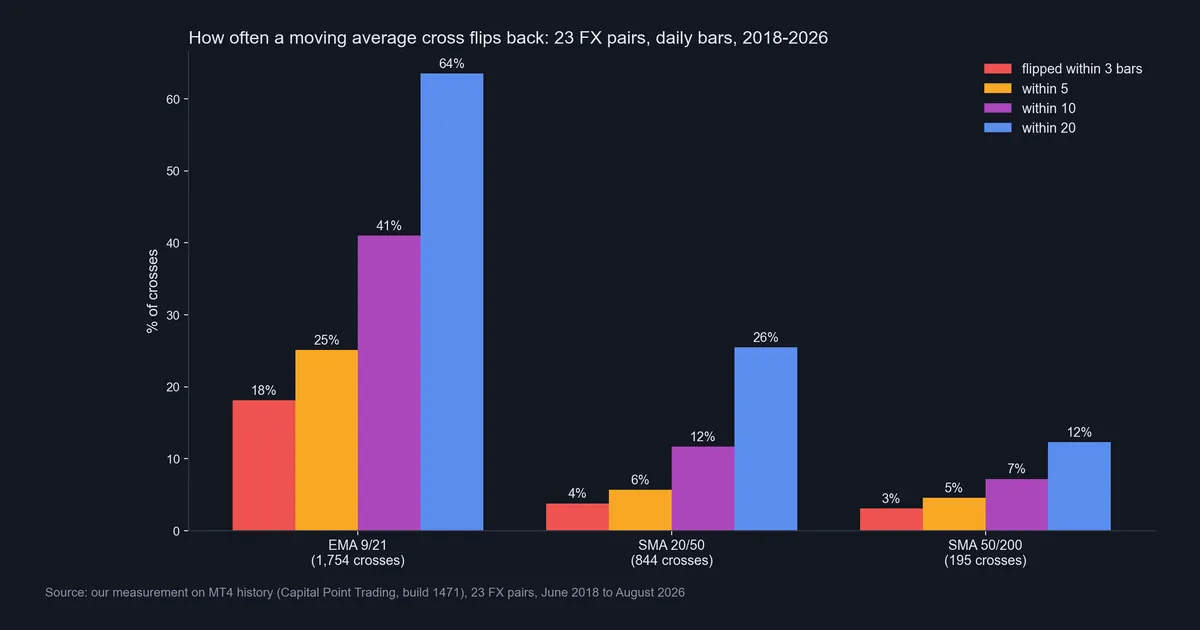
The obvious fix is to slow the averages down. That does cut flips, as the chart shows. But look at the last column of this table.
| Pair | Crosses | Median bars to next cross | Flipped within 3 / 5 / 10 / 20 bars | Ended with a gain | Mean / median result |
|---|---|---|---|---|---|
| EMA 9/21 | 1,754 | 14 | 18.1 / 25.1 / 41.0 / 63.5% | 28.4% | -0.099 / -0.859 ATR |
| SMA 20/50 | 844 | 35 | 3.8 / 5.7 / 11.7 / 25.5% | 32.5% | -0.343 / -1.039 ATR |
| SMA 50/200 | 195 | 90 | 3.1 / 4.6 / 7.2 / 12.3% | 27.7% | -0.850 / -2.308 ATR |
The slower pairs lost more on average, so slower is not automatically better. A cross held for a median 90 bars can drift further in ATR than one held for 14, though, so these means are not strictly like for like. Also, 195 crosses is a small count. Even so, nothing here suggests that slowing down solves the problem. Our moving average crossover strategy guide tests these systems in more depth.
What our three filters did
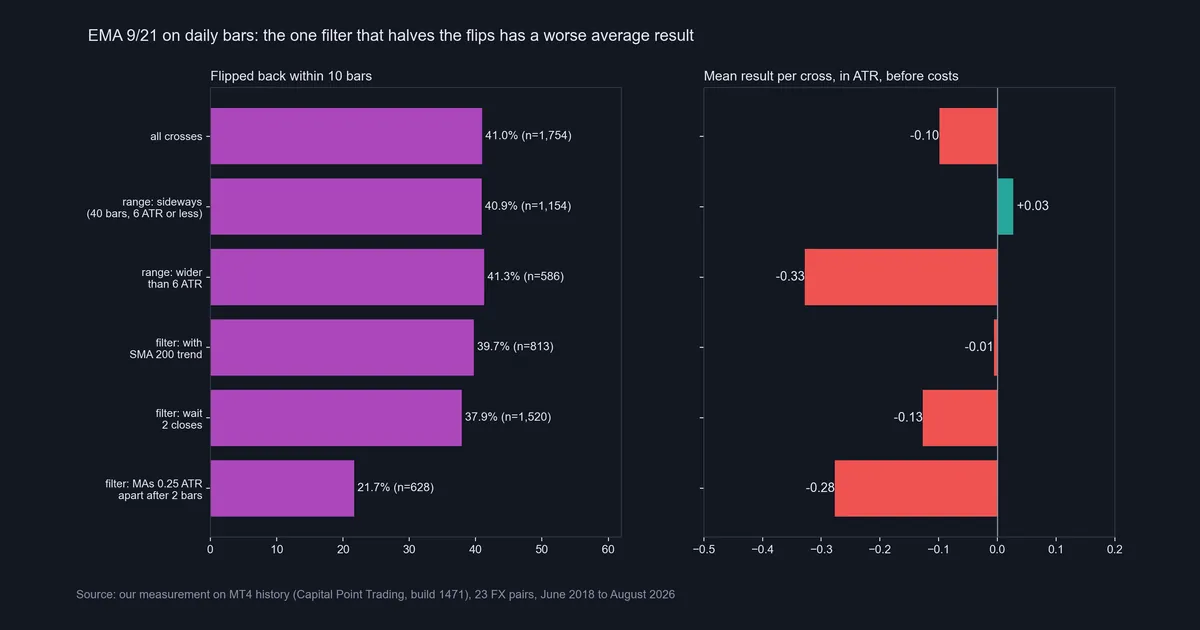
ChartSchool suggests a price or time filter to help prevent whipsaws. We tried one of each, plus a trend filter. The delay and gap filters enter two bars later, and the flip clock and the result restart there.
| Filter on EMA 9/21 | Crosses | Flipped within 10 bars | Mean result | Mean of flips | Mean of longer crosses |
|---|---|---|---|---|---|
| None | 1,754 | 41.0% | -0.099 | -1.405 | +0.808 |
| With the SMA 200 trend | 813 | 39.7% | -0.006 | -1.445 | +0.943 |
| Wait 2 closes | 1,520 | 37.9% | -0.127 | -1.417 | +0.660 |
| Lines 0.25 ATR apart after 2 bars | 628 | 21.7% | -0.277 | -2.501 | +0.337 |
The gap filter did its stated job and nearly halved the flips. But the average got worse, and the last two columns show why. The flips that got through cost more, at 2.501 ATR, and the longer crosses earned far less. So the filter removed flips and a slice of the payoff too.
The trend filter barely changed flips, yet it had the best mean. It chose better crosses rather than fewer flips. Still, -0.006 ATR sits just below zero before costs, and costs only push it lower.
The same gap filter lifted SMA 20/50 from -0.343 to -0.251 ATR, so a filter’s effect depends on the pair it sits on. Test any filter on your own settings, and watch for curve fitting when you do.
Sideways markets: the usual advice did not hold on EMA 9/21
ChartSchool says a crossover system produces many whipsaws when there is no strong trend, and that is the standard advice. We tested it with a plain rule: a market counts as sideways if the previous 40 bars were no wider than 6 ATR.
On EMA 9/21 the flip rates came out almost equal: 40.9% in sideways markets (1,154 crosses) and 41.3% in wider ones (586 crosses). Sideways crosses even had the better mean, +0.027 against -0.328 ATR. That goes against the advice. However, the advice held up better on the slower pair. SMA 20/50 flipped 13.2% of the time in sideways markets and 7.3% in wider ones, on 638 and 206 crosses.
Our reading: a fast pair can flip on an ordinary pullback inside a wide move, so a wide market alone does not protect it. That is our inference, because we only measured the counts. We did not test ADX either, although our page on what the ADX indicator measures covers a common way to label a trend. A different definition of sideways could give a different answer.
Download the complete indicator database
Put these concepts on your charts. One email unlocks the full library of 1,380+ indicators with compiled MT4 and MT5 files, plus my TradingView scripts. No paywall, no spam, unsubscribe any time.
Get free access to my indicator database
One email unlocks 1,380+ free MT4, MT5 and TradingView indicators — the complete library. No single-tool download; you get the whole database.
Where it fails
The biggest limit is hindsight. We can only label a cross a flip after the next cross appears. So the split between 1.405 ATR lost and 0.808 ATR gained gives you no trading rule. At the moment of the cross, the two groups look alike.
Next come costs. Every figure here sits before spread, swap and commission, and a flip pays for a full round trip within days. That weighs most on the fast pair. Our guide to backtesting transaction costs shows how to add them back. The test also has no stop loss and no target, only cross to cross. A real system with stops would produce different numbers.
The sample has limits too. It comes from one broker’s MT4 history, it stops in August 2026, and the 23 pairs share currencies, so their crosses are not independent. By pair, the 10-bar flip rate ran from 27.1% on GBP/USD (59 crosses) to 56.3% on CAD/CHF (103 crosses). AUD/CAD showed 71.4% and NZD/CAD 18.2%, but on only 21 and 11 crosses. Read our note on backtest sample size before you pick a pair from those figures.
Hourly bars need extra care. EMA 9/21 flipped within 10 bars on 38.3% of 815 H1 crosses, close to the daily 41.0%. The mean came to +0.131 ATR before costs. We do not read that as an edge, because the windows are short, gold supplies 293 of the crosses, and costs weigh more against a smaller hourly ATR.
Two more flips: one bar on AUD/USD, five on gold
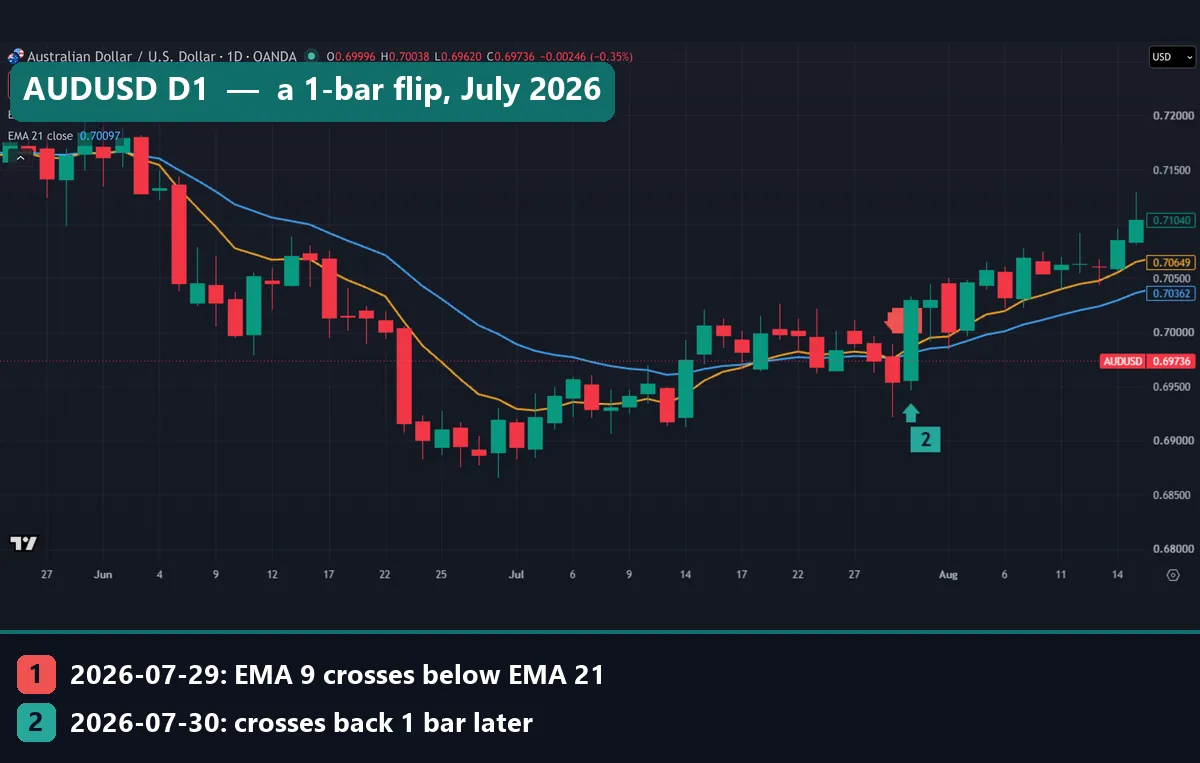
AUD/USD shows how fast it can go. The gold line slips under the blue on 29 July 2026, and one large green candle reverses it on the very next bar. The first marker sits partly behind that candle, so use the strip below the image.
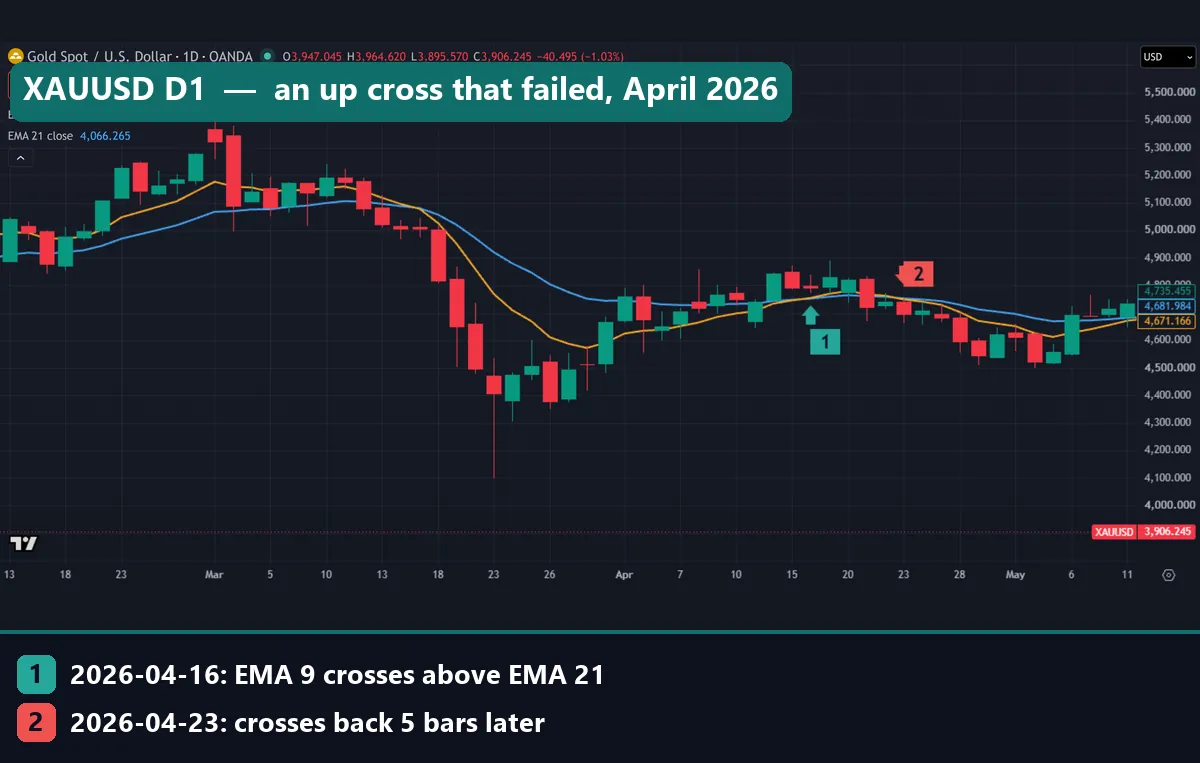
Gold shows the same thing in the other direction: an up cross on 16 April 2026 and a cross back on 23 April, five bars later. Gold is not in our 23-pair daily count, so treat this one as an illustration only.
Here are all five captures under the same rule, read from the charts and rounded. We picked them because they flipped, so they say nothing about how often it happens.
| Chart | Cross | Cross back | Bars | In near | Out near | Against you |
|---|---|---|---|---|---|---|
| EUR/USD | 7 Feb 2025, down | 13 Feb 2025 | 4 | 1.029 | 1.046 | about 170 pips |
| GBP/USD | 27 Jul 2026, down | 30 Jul 2026 | 3 | 1.329 | 1.347 | about 180 pips |
| USD/JPY | 27 Aug 2025, down | 2 Sep 2025 | 4 | 147.4 | 148.3 | about 90 pips |
| AUD/USD | 29 Jul 2026, down | 30 Jul 2026 | 1 | 0.6955 | 0.7025 | about 70 pips |
| XAU/USD | 16 Apr 2026, up | 23 Apr 2026 | 5 | 4,795 | 4,695 | about $100 |
Common whipsaw mistakes
- Judging a filter by its flip count. Our gap filter nearly halved flips and still had a worse mean. Check the result as well as the count.
- Slowing the averages and calling it fixed. SMA 50/200 flipped least and had the worst mean in our table, at -0.850 ATR.
- Blaming every flip on a range. On EMA 9/21, flips came just as often in wider markets, at 41.3% against 40.9%. Skipping flat charts by eye will not remove them.
- Sizing as if flips were rare. Flips were 41.0% of EMA 9/21 crosses and lost a mean 1.405 ATR before costs. Size each trade so a run of them stays affordable. Our guide to ATR position sizing shows one way.
Where to go next
If you still want to trade crosses, these pages pick up where this one stops.
- Our page on trend following explains why many small losses can be part of the design.
- The crossover strategy guide reports its own test of three popular pairs of averages.
- MetaTrader 4’s help page on Average True Range sets out the calculation behind our result unit.
FAQ: whipsaw questions
What does whipsaw mean in trading?
It means a signal reversed soon after you acted on it, usually at a loss. In our test, a moving average cross counted as a flip when the opposite cross came within 10 bars.
How often do moving average crosses whipsaw?
On 23 FX pairs of daily bars from June 2018 to August 2026, 41.0% of EMA 9/21 crosses flipped within 10 bars. For SMA 20/50 the figure was 11.7%, and for SMA 50/200 it was 7.2%.
How much does a whipsaw cost?
EMA 9/21 crosses that flipped within 10 bars lost a mean 1.405 ATR on daily bars, before spread, swap and commission. On H1 the same group lost a mean 1.764 ATR, though on far less data.
Do whipsaws happen more in sideways markets?
Not on EMA 9/21 in our test: 40.9% in sideways markets against 41.3% in wider ones. SMA 20/50 did flip more in sideways markets, at 13.2% against 7.3%. So the answer depends on your pair and on how you define sideways.
Does a longer moving average stop whipsaws?
It reduces them but does not stop them. SMA 50/200 still flipped within 20 bars on 12.3% of crosses. It also had the worst mean of the three pairs, at -0.850 ATR on 195 crosses.
Which filter cut whipsaws the most?
The gap filter did, which requires the lines to sit at least 0.25 ATR apart two bars after the cross. It cut 10-bar flips on EMA 9/21 from 41.0% to 21.7%. Yet the mean result fell from -0.099 to -0.277 ATR.
Do hourly charts whipsaw more than daily charts?
Not by our count. EMA 9/21 flipped within 10 bars on 38.3% of H1 crosses against 41.0% on daily bars. But the hourly windows are short, and spreads take a larger share of a smaller hourly ATR.
Can you avoid whipsaws completely?
No. A cross cannot know what the next bars will do, and you can only label a flip afterwards. You can size for flips and test any filter on your own data. Treat every figure here as history before costs: results are not guaranteed; past performance is not indicative of future results.
Last updated: 3 November 2026.

About the author
Written by Dominic Walsh, a Forex trader and MT4/MT5 indicator, Expert Advisor and script developer. Every tool on forexmt4systems.com is tested on live charts before release and ships with ready-to-use compiled MT4 (.ex4) and MT5 (.ex5) files. Learn more about the trader and developer behind this site.
How we build, test and correct every tool: Editorial & Testing Policy. Trading carries risk; see the disclaimer.