
John Paulson is the New York-born investor who founded Paulson & Co. and bet against subprime mortgage debt before the 2008 crisis. This guide settles how that credit default swap bet worked, what the SEC’s Abacus case said about him, what happened to his gold bet, and what a retail trader can take from it. We did not measure his funds, because their returns are private. We measured the market around them instead.
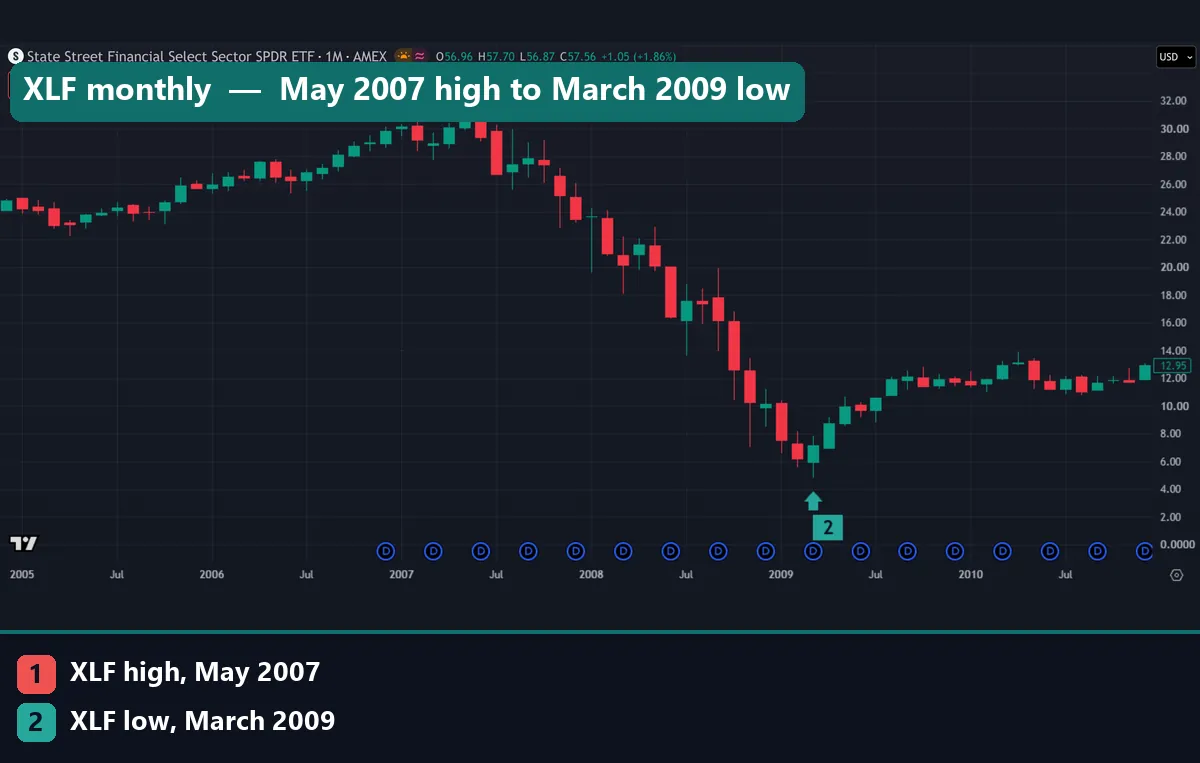
Our first chart shows that market. XLF, a fund of US financial stocks, made its high in May 2007 (marker 1), then fell 84.6% to March 2009 (marker 2). That is the market’s move, not his result.
Who John Paulson is
John Paulson was born in Queens, New York, and started his firm in 1994. For his career we rely on Gregory Zuckerman’s 2020 profile on his own site. Zuckerman calls him a merger-arbitrage specialist in the early years: he bet that announced mergers would close or draw higher bids.
In early 2006, aged 49, Paulson turned to the surge in US house prices. With an analyst, Paolo Pellegrini, he began buying credit default swaps against the riskiest mortgage debt. Zuckerman reports that the trade netted $20 billion for clients and employees across 2007 and 2008, and nearly $4 billion for Paulson himself in 2007.
The firm managed $38 billion in 2011 and less than $9 billion in 2019, most of that his own money. In July 2020, Zuckerman reported, Paulson decided to return client money and run a family office.
How a credit default swap bet works
A credit default swap, or CDS, is a private contract about a debt. The Financial Crisis Inquiry Commission (FCIC) report at GovInfo explains it on page 50. The buyer makes regular payments to the seller. If a default or another agreed credit event happens, the seller typically pays the buyer the face value of the debt.
So the buyer’s result is:
buyer's result = payout on a credit event - payments made up to that date
People compare a CDS to insurance, but the report draws a sharp line. You can only insure a car you own. A CDS buyer can bet on a loan they do not own, which the market calls a naked credit default swap.
That was this bet. The FCIC says these buyers never made a subprime loan or bought a mortgage. They made side bets on risks others had taken, often with major financial firms on the other side. A true hedge is different, because it offsets something you already hold, as our guide to hedging in forex shows.
The 2007 subprime trade
The FCIC report gives the official timeline on pages 193 to 195. Paulson set up a fund in June 2006 that first focused only on shorting BBB-rated slices of mortgage securities. His colleague Sihan Shu told the commission that rating agencies gave these products too much credit for diversification.
Paulson told the commission that flat home prices alone would wipe out those slices, and that protection on them cost very little at the time. The buyer risked a stream of small payments, while the payout could reach the face value of the debt.
By the end of 2007, the report says, the firm’s Credit Opportunities fund was up 590%. That is the commission’s figure, and we cannot check it. The report also names others on the same side, including Steve Eisman and Michael Burry.
The Abacus case: who the SEC charged
Abacus 2007-AC1 was a synthetic CDO: a deal built from credit default swaps that pointed at mortgage securities without holding them. In April 2010, the SEC’s press release on the Abacus case announced fraud charges against Goldman, Sachs & Co. and one of its vice presidents. The SEC did not charge John Paulson or his firm.
The SEC alleged that Paulson & Co. paid Goldman about $15 million to structure and market the deal, helped pick the mortgage securities, then bet against them. Goldman’s marketing, it said, named a third party, ACA Management, as the selector, and did not disclose the fund’s role or short position.
The SEC said investors lost more than $1 billion. In July 2010, the FCIC report records, Goldman settled and paid a record $550 million. Paulson told the commission that every synthetic CDO has a buyer and a seller of protection. The case turned on what investors heard, not on anyone pushing a price, which is the subject of our guide to market manipulation.
The gold bet and the 2013 fall
Zuckerman reports that Paulson followed the mortgage trade with an early bet on gold. A Reuters report carried by Business Standard, dated July 2013, gives the details. He launched a gold fund in 2010, and outside investors had to commit $10 million each. It rose 35% that year.
Then gold turned. Reuters said the fund lost 65% in the first half of 2013, including 23% in June, citing two people familiar with it. A Paulson spokesman declined to comment. The fund held roughly $300 million by then, mostly his own money, and most of the firm’s bigger funds were up at that point.
Reuters tied gold’s 12% fall in June to fears that the Federal Reserve might cut its bond buying, a link we cover under bond yields. It also said it was unclear how that became a 23% fall in the fund, or whether borrowing and derivatives played a part. Our sources stop there, so we have no later fund result.
How we tested
We did not and cannot measure Paulson’s fund returns, so every fund figure here comes from a named source. Our market numbers come from the TradingView web chart, pulled on 3 November 2026 with history up to 2 November, on default bars with no added studies. We chart on monthly bars, plus one weekly GLD chart. Our editorial testing policy sets out how we work.
- XLF (financial stocks): history from 21 December 1998; weekly bars for the high and low.
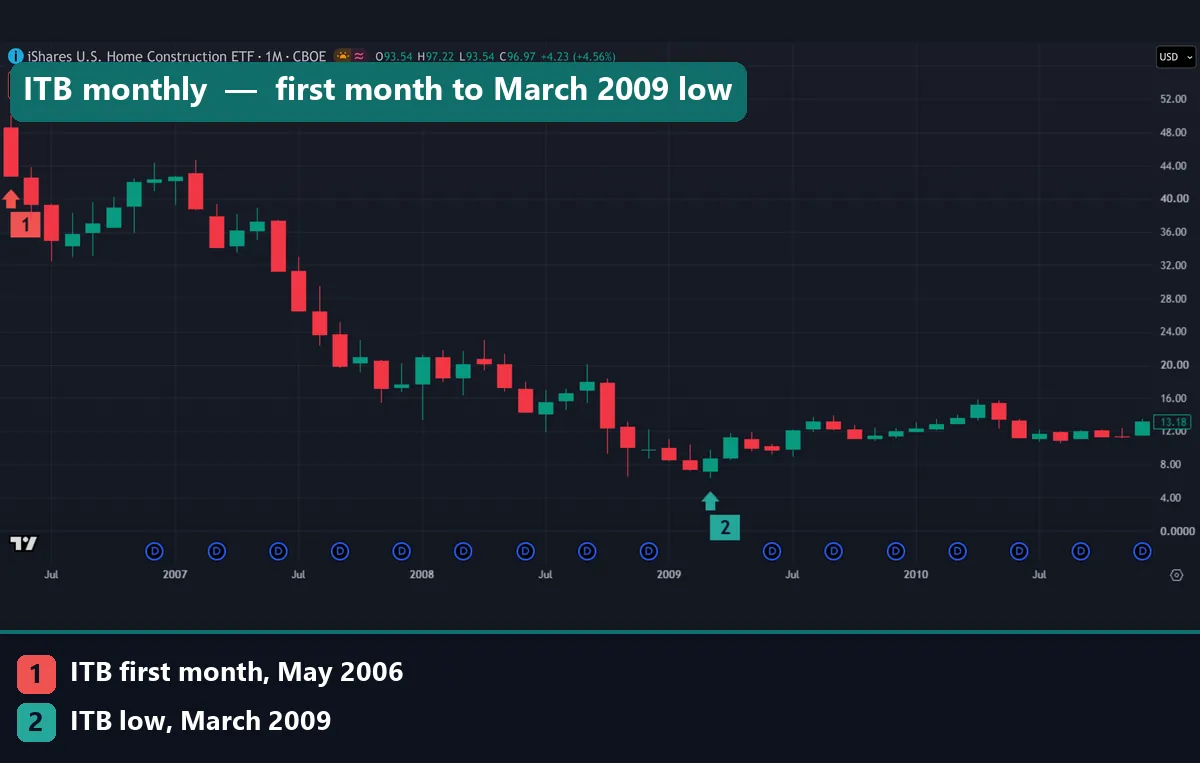
- ITB (homebuilders): history from 1 May 2006.
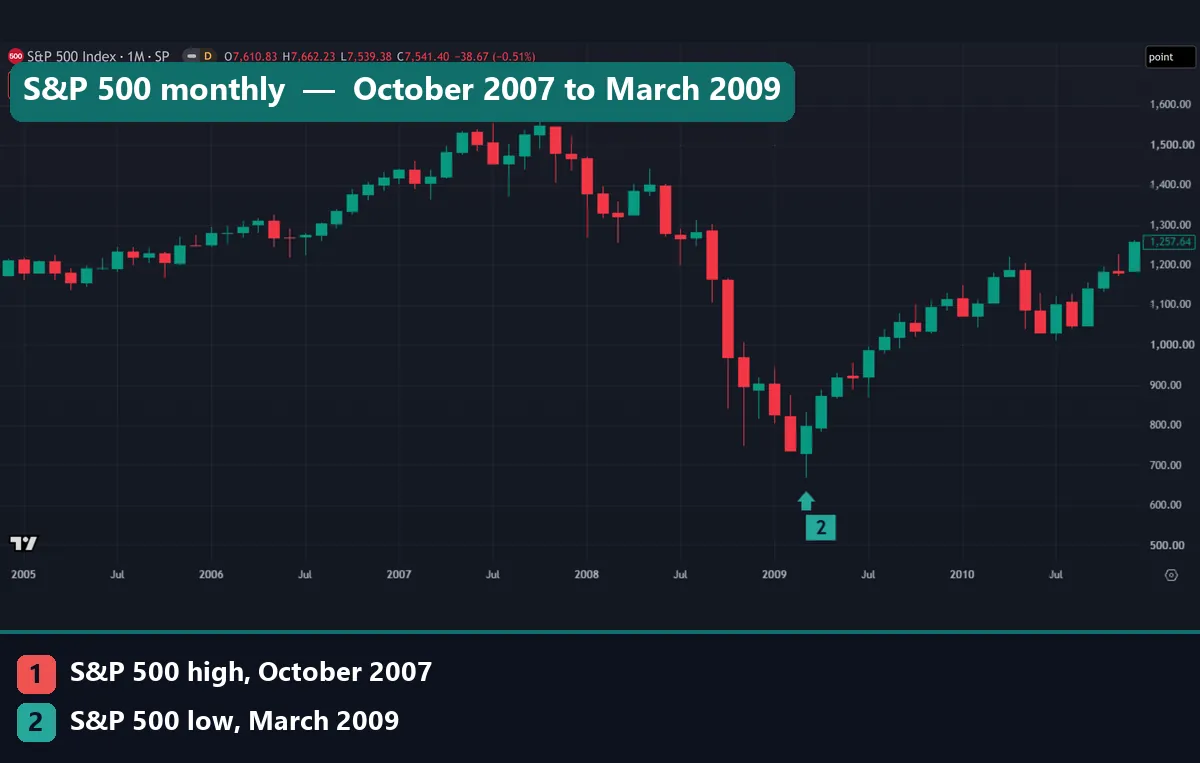
- SP:SPX (S&P 500 index): monthly bars, October 2007 to March 2009.
- GLD (gold): history from 15 November 2004; year-end closes for 2008 to 2016, weekly bars for the high and low.
All figures are price moves, before spread, swap and commission, and default bars can differ from quotes printed at the time. The strip and boxes at the top of each chart show the latest quote, not the period in view. Each D circle marks a dividend.
The terms that decide a CDS bet
This is a trade, not an indicator, so it has no settings to tune. It does have terms, and they decide the result. These definitions follow the FCIC report.
| Term | What it means | Why it mattered here |
|---|---|---|
| Reference debt | The bond or loan the contract points to | BBB-rated slices of mortgage securities |
| Face value | What the seller typically pays on a credit event | It sets the payout |
| Regular payments | What the buyer pays during the swap | The cost of waiting, very low per Paulson |
| Seller’s backing | Reserves or collateral behind the promise | The report says some sellers put up none |
| Market | A private over-the-counter contract | It sits outside a retail platform |
A payout depends on the seller’s ability to pay, and a private contract has no exchange in the middle.
Reading the crash on a chart
Start with the homebuilders, because they moved first in our data. ITB opens in May 2006 at the far left, and marker 1 sits under that first candle. It fell 87.4% from 50.10 to 6.33 in March 2009 (marker 2). Its history starts that first month, so we cannot see any higher level.
The S&P 500 kept climbing for 17 months after ITB’s first month. It made its high of 1,576.09 in October 2007 (marker 1), then fell 57.7% to 666.79 in March 2009 (marker 2). That is far larger than the market correction sizes we measure elsewhere.
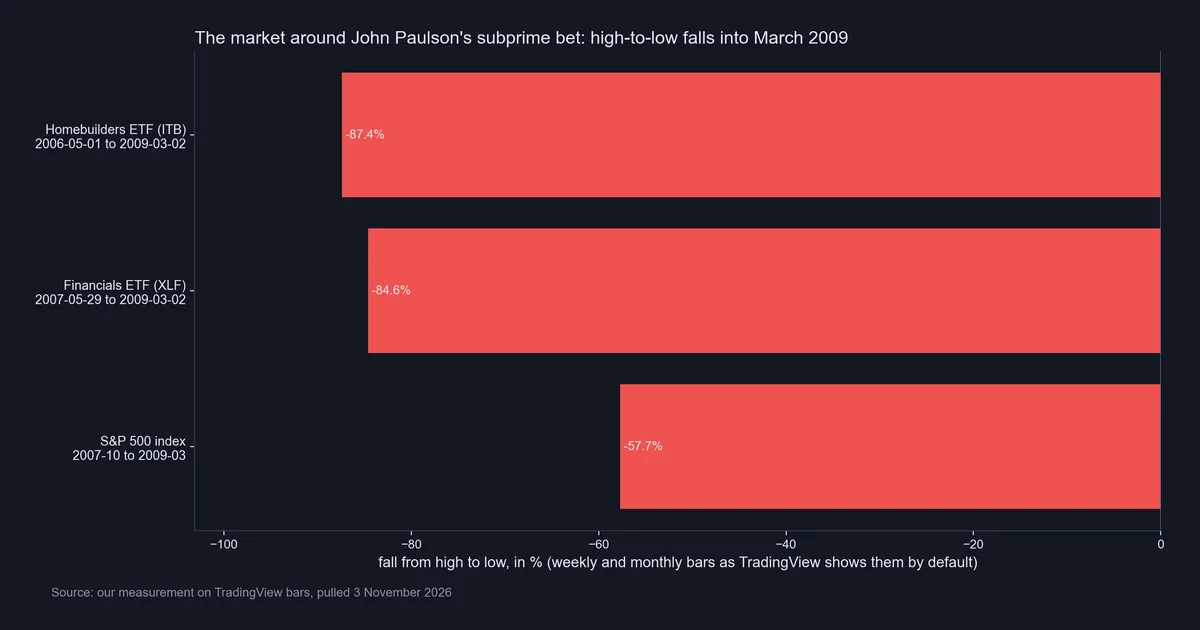
The order is the useful part: ITB’s data begins in May 2006, XLF peaked in May 2007, and the S&P 500 peaked in October 2007. Meanwhile, the SEC says 83% of the Abacus portfolio had suffered downgrades by 24 October 2007. So a stock index can sit at its high while part of the credit market beneath it breaks.
Worked example: the falls and the gold years in numbers
Take XLF on our weekly bars. The high was 30.97 and the low was 4.77. The fall is (30.97 – 4.77) / 30.97 = 84.6%. To climb back from 4.77 to 30.97, price then needs a rise of about 549%. That gap is why recovering from a drawdown takes so long.
| Market | High | Low | Fall | Rise to get back |
|---|---|---|---|---|
| ITB | 50.10 | 6.33 | 87.4% | 691% |
| XLF | 30.97 | 4.77 | 84.6% | 549% |
| S&P 500 | 1,576.09 | 666.79 | 57.7% | 136% |
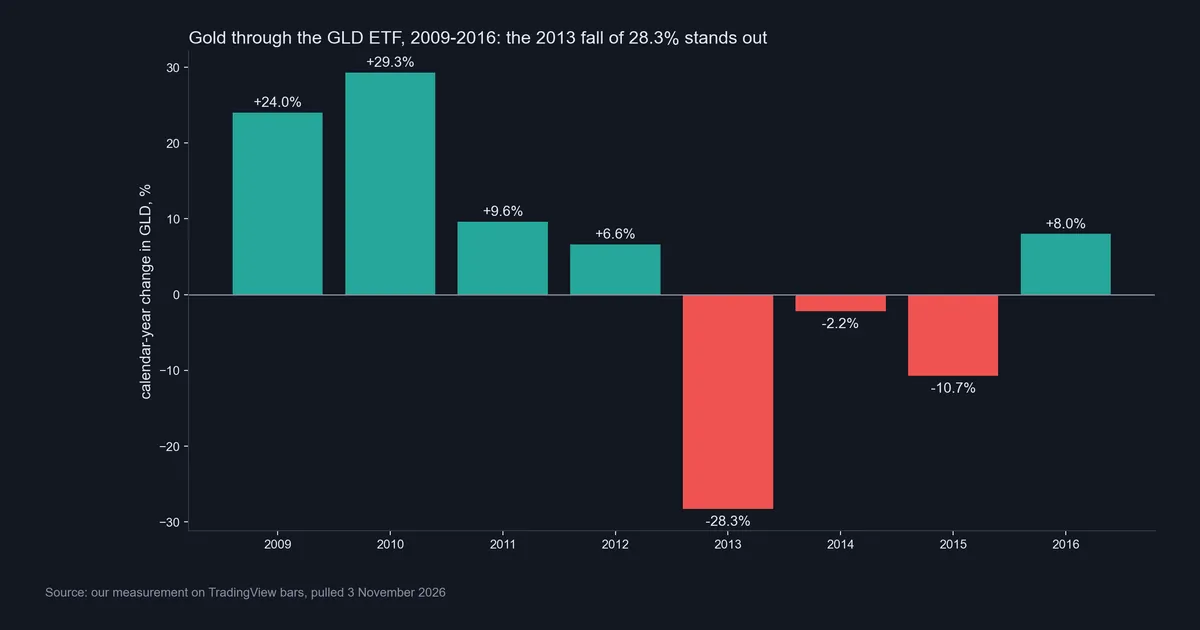
GLD closed 2008 at 86.52 and 2012 at 162.02, a rise of 87.3%. It closed 2013 at 116.12, down 28.3%, and 2015 at 101.46. So across those seven years a holder kept a 17.3% gain, before costs. A buyer at the end of 2012 sat on a 37.4% loss by the end of 2015.
Download the complete indicator database
Put these concepts on your charts. One email unlocks the full library of 1,380+ indicators with compiled MT4 and MT5 files, plus my TradingView scripts. No paywall, no spam, unsubscribe any time.
Get free access to my indicator database
One email unlocks 1,380+ free MT4, MT5 and TradingView indicators — the complete library. No single-tool download; you get the whole database.
Where it fails: what this story and our numbers cannot show
This story has real limits, and so do our measurements.
- The charts are not his trade. XLF and ITB hold stocks, not mortgage bonds, and we have no data for the slices he bet against. The FCIC’s 590% is for the end of 2007, two months after the S&P 500’s high, so most of the index fall came later.
- High-to-low overstates what anyone could catch. Nobody sells the exact high and covers at the exact low.
- The sample is tiny. Two big bets cannot support a rule, and we hear about trades that paid far more often than trades that did not. Our guide to cognitive biases in trading covers that kind of shortcut.
- Fund figures are not ours. The 590%, $20 billion and 65% come from the FCIC, Zuckerman and Reuters, and we cannot test them. The 65% runs through June 2013, but our 28.3% for GLD is the full year.
What a retail trader can take from it
Do not take the trades: you could not place them. Three plainer ideas do carry over, and the gold years show each one.
Position sizing. GLD fell 46.1% from 185.85 in September 2011 (marker 1) to 100.23 in December 2015 (marker 3), with June 2013 at marker 2. An account loses the position’s share of the account times that fall, which is the sum behind position sizing. So size for a bad year, not a calm one.
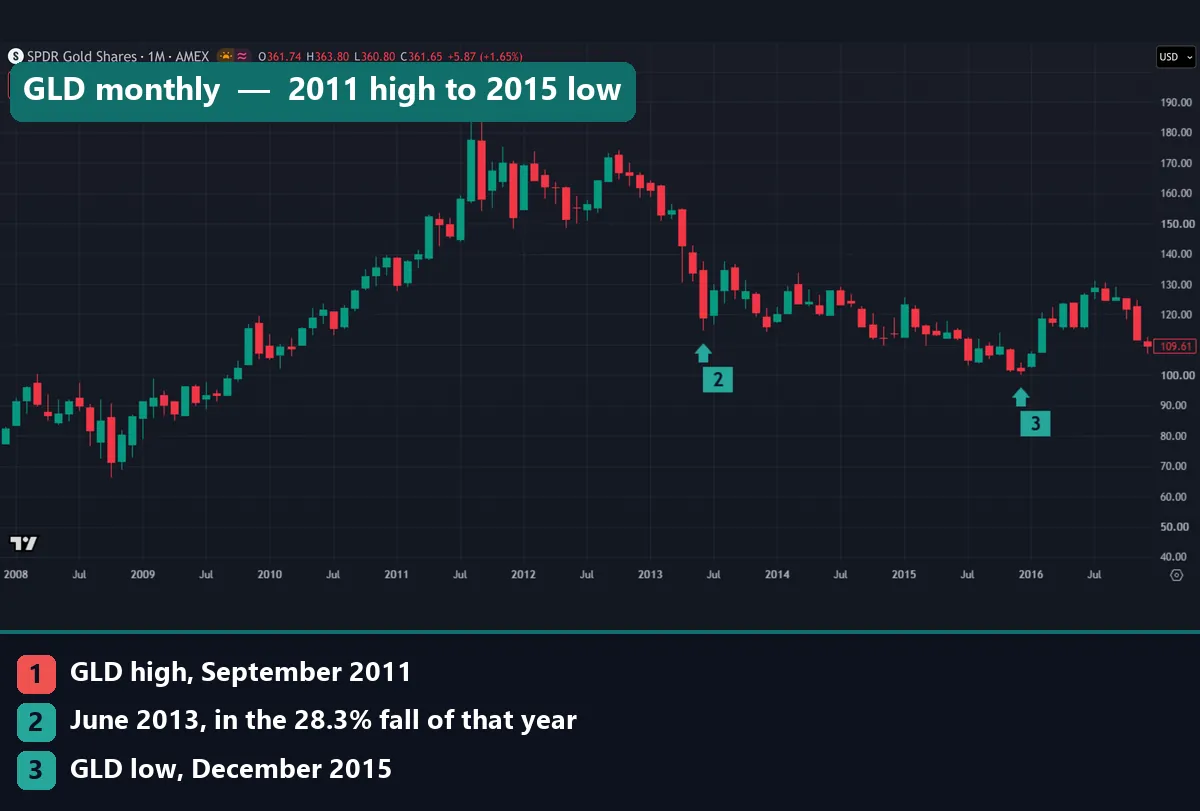
Being early. Early can look like wrong for a long time. After the fund’s June 2006 start, the S&P 500 rose for 16 more months. Anyone short gold sat through four up years from 2009 to 2012. On borrowed money, a wait like that can end an account first, which is the real leverage risk.
Cost of carry. A CDS buyer pays premiums while waiting. A retail trader may pay swap each night a position stays open, when the rate gap runs against them. Our figures leave those costs out.
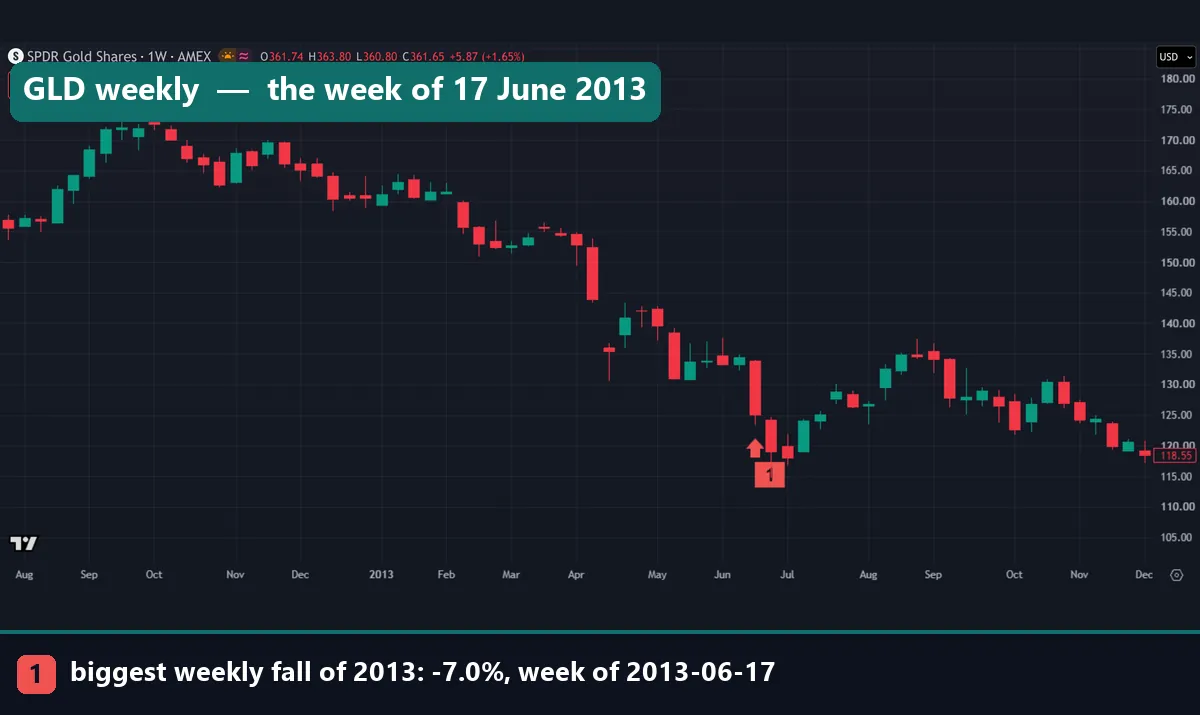
The weekly chart adds one point. The biggest weekly fall of 2013 was 7.0%, in the week of 17 June (marker 1), yet the year’s fall was 28.3%. So the damage came as a long string of weeks, not one crash bar.
Common mistakes when reading this story
- Reading an ETF fall as his profit. XLF’s 84.6% is a market move, not a fund result.
- Saying the SEC charged Paulson over Abacus. It charged Goldman and one of its vice presidents.
- Copying a position from a filing. Reuters cited a filing that showed the SPDR Gold ETF, 21.8 million shares, as the firm’s largest holding at the end of March. The report ran in July, after gold’s June fall, so a filing shows the past.
- Treating a view as a plan. A bet needs a size and an exit, such as a stop loss. Without them, a correct view can still come too late.
Where to go next
For another large one-way bet, our guide to Black Wednesday covers the 1992 break in the pound. For your own numbers, the position size calculator turns a stop distance into a lot size. Our four outside sources sit in the sections above: the SEC release, the FCIC report, Zuckerman’s profile and the Reuters report.
FAQ: John Paulson questions answered
Who is John Paulson?
He is the investor who started Paulson & Co. in 1994, born in Queens, New York. His firm bet against subprime mortgage debt before the 2008 crisis, and in 2020 he moved to run it as a family office.
What was John Paulson’s subprime trade?
He bought credit default swaps on risky mortgage debt that he did not own. He paid regular premiums, and the seller typically owed the face value if a credit event happened.
How much did John Paulson make in 2007?
Zuckerman puts his personal 2007 payout at nearly $4 billion, and the whole trade at $20 billion for clients and employees across 2007 and 2008. We cannot verify these figures.
Did the SEC charge John Paulson over Abacus?
No. The SEC charged Goldman, Sachs & Co. and one of its vice presidents. Goldman settled in July 2010 and paid $550 million.
What happened to John Paulson’s gold bet?
Reuters reported that his gold fund lost 65% in the first half of 2013. Over that full year, GLD fell 28.3% on our bars, so the two windows differ.
Does John Paulson still run a hedge fund?
Zuckerman reported in July 2020 that Paulson would return client money and run a family office. That is our latest source on this.
Can a retail trader copy his trades?
No. The swaps were private contracts between institutions, and the gold fund asked outside investors for $10 million each. An ETF or a CFD can track a market, but it does not offer the same payoff.
What can a retail trader learn from John Paulson?
Size for a bad year, expect a long wait when you are early, and count the cost of waiting. None of this is a trading signal, and results are not guaranteed; past performance is not indicative of future results.
Last updated: 3 November 2026.

About the author
Written by Dominic Walsh, a Forex trader and MT4/MT5 indicator, Expert Advisor and script developer. Every tool on forexmt4systems.com is tested on live charts before release and ships with ready-to-use compiled MT4 (.ex4) and MT5 (.ex5) files. Learn more about the trader and developer behind this site.
How we build, test and correct every tool: Editorial & Testing Policy. Trading carries risk; see the disclaimer.