
Short term trading means opening and closing a position within minutes, hours or a few weeks. This guide settles one measurable question: how much of a typical price move does the trading cost take at each holding period? On EUR/USD, an example cost of 1 pip equals 52.6% of the median 15-minute move and 0.4% of the median 60-day move. That gap is the main hurdle at the fast end. However, a longer hold did not make EUR/USD’s direction any easier to call.
What short term trading actually is
Short term trading is a holding period, not a method. You can reach it with price action, indicators or news. Traders usually split it into three styles, and the boundaries are only conventions.
- Scalping: seconds to minutes, on the fastest charts.
- Day trading: minutes to hours, with everything closed before the day ends.
- Swing trading: several days to a few weeks, so positions stay open overnight.
Our older pages cover how to choose a trading style and the main forex trading styles, so this guide skips schedule and temperament. It adds a measured cost for each clock instead.
The US SEC describes the fast end bluntly. The day trading glossary entry at Investor.gov calls the activity extremely risky, with possible substantial losses in a very short time. That entry covers stocks, while our numbers cover FX.
How short term trading works: a fixed cost against a small move
Every round trip has a cost. You pay the spread plus any commission, and that bill barely depends on how long you hold. However, the move you hope to catch grows with time. So the shorter the hold, the larger the share the cost takes.
median move(h) = median of |close[t + h] - close[t]|, in pips
cost share(h)  = round-trip cost / median move(h) x 100
How fast does the move grow? In a pure random walk, the typical distance grows with the square root of time, and the random walk article on Wikipedia gives the maths. So four times the time gives about twice the move, and 60 days gives about 7.7 times one day.
Note what this leaves out. It says nothing about which way price goes, and a cheap trade in the wrong direction still loses.
How we tested it
We used two data sets, because neither one covers every clock.
- TradingView web chart, OANDA 15-minute bars: EUR/USD, GBP/USD and USD/JPY, from 1 January 2026 to 3 November 2026. This set gives the 15-minute, 1-hour, 4-hour and 1-day figures. Here one day means 92 bars, or 23 hours.
- MetaTrader 4, build 1471, daily bars from a Capital Point Trading terminal: the same pairs plus AUD/USD, for 1, 5, 20 and 60 daily bars. EUR/USD runs from 19 May 2020 to 17 August 2026, and the other three stop on 14 August 2026. That terminal has been offline since late August 2026, so the windows end there.
For each bar we took the close, found the close a set number of bars later, dropped the sign and took the median. Then we counted how often the later close sat higher. Every result comes before spread, swap, financing and commission, and we ran no strategy. As a check, we repeated the daily counts on OANDA’s bars for the same dates, and every median landed within 3 pips of the MT4 figure.
The 1-pip round-trip cost is our own illustration, not a broker quote. Our general method is in the editorial testing policy.
The parameters: move and cost by holding period
This table holds the main EUR/USD result. The 1-day row appears twice because the two windows disagree, and the style column is only a rough guide.
| Holding period | Rough style | Median move (pips) | 1-pip cost share | Window |
|---|---|---|---|---|
| 15 minutes | Scalping | 1.9 | 52.6% | 2026 M15 |
| 1 hour | Scalping or day | 3.9 | 25.6% | 2026 M15 |
| 4 hours | Day | 8.2 | 12.2% | 2026 M15 |
| 1 day | Day or swing | 23.2 | 4.3% | 2026 M15 |
| 1 day | Day or swing | 29.6 | 3.4% | 2020-2026 D1 |
| 5 days | Swing | 67.2 | 1.5% | 2020-2026 D1 |
| 20 days | Long swing | 145.0 | 0.7% | 2020-2026 D1 |
| 60 days | Beyond short term | 242.9 | 0.4% | 2020-2026 D1 |
Reading the same pair on five clocks
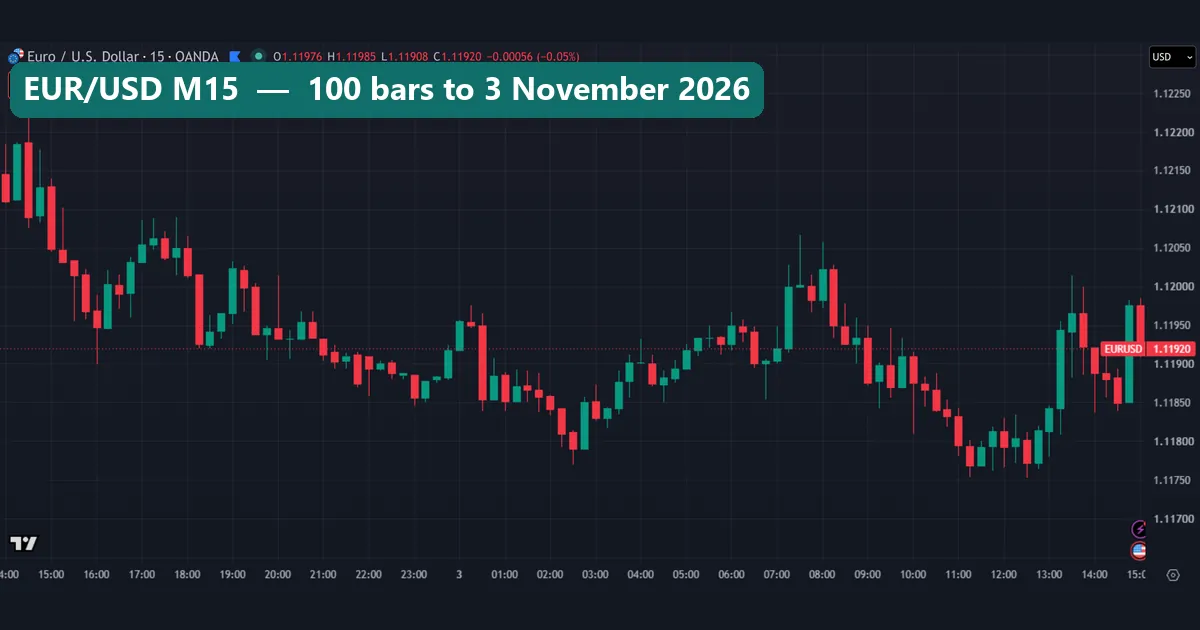
We captured EUR/USD on OANDA at five clocks on 3 November 2026, 100 bars each, with only candles on screen. Intraday axes show UTC. The 15-minute chart at the top of this page covers about one day.
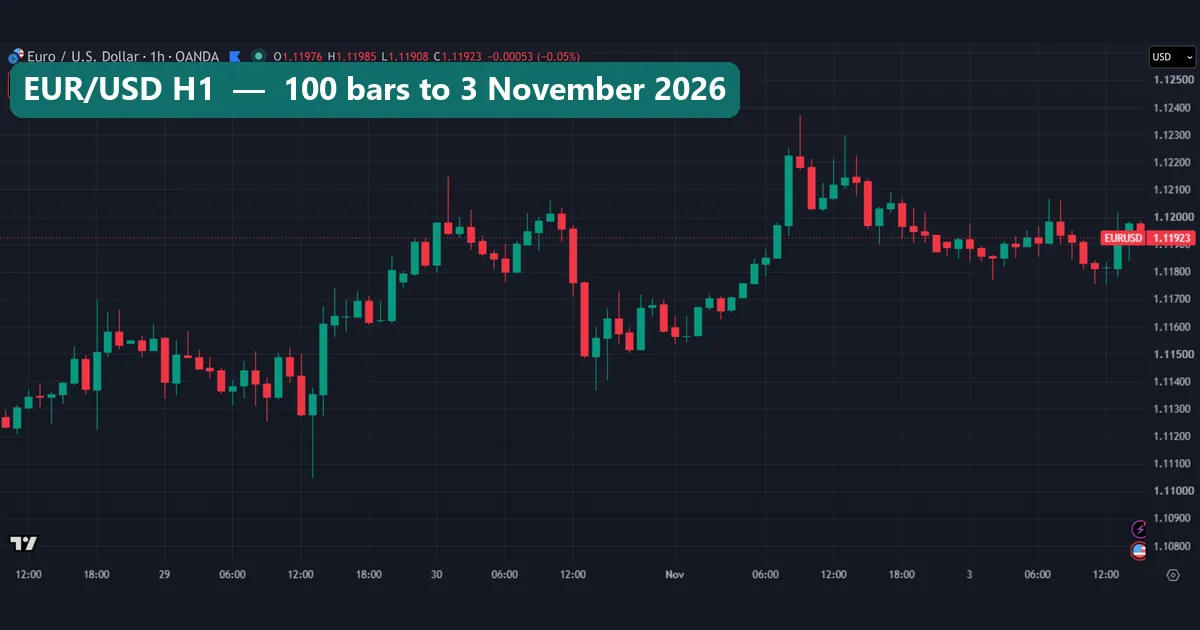
The hourly chart covers about six trading days. Its low of 1.11046 came on 29 October at 13:00 UTC, as a long lower wick. Its high of 1.12372 came on 2 November at 09:00 UTC.
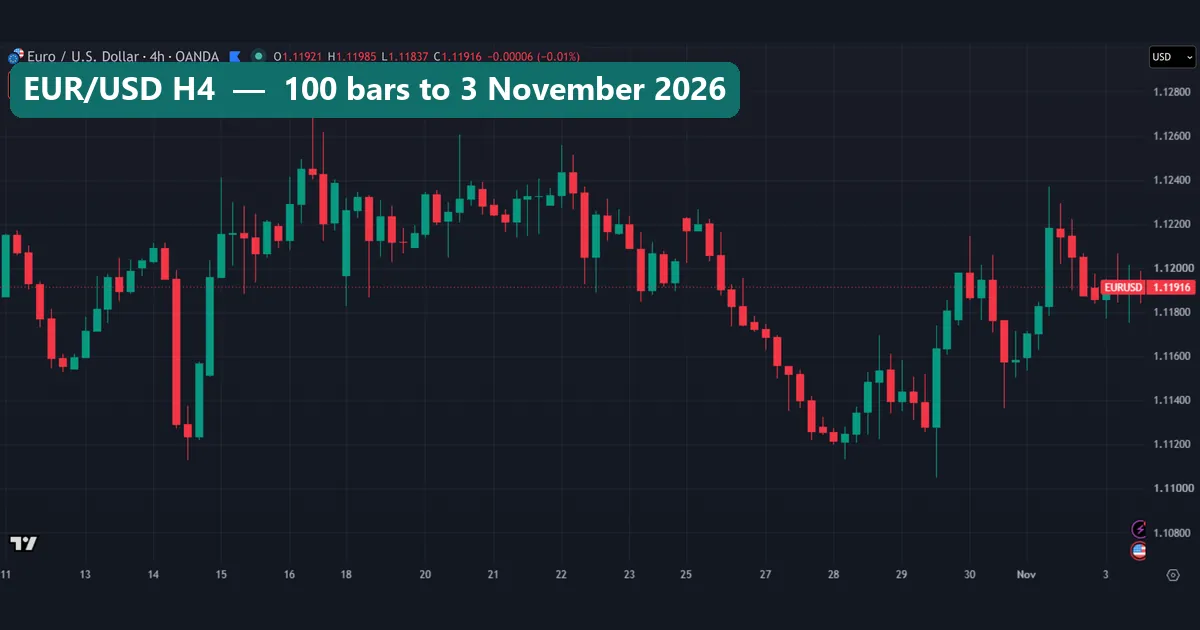
On the 4-hour chart, that same low is one wick among many. The top is 1.12695 on 16 October.
| Clock | 100 bars cover | High to low on our capture |
|---|---|---|
| 15 minutes | About 1 day | About 47 pips |
| 1 hour | About 6 trading days | About 133 pips |
| 4 hours | About 3 weeks | About 165 pips |
| Daily | About 4.5 months | About 607 pips |
| Weekly | About 2 years | About 1,905 pips |
Cover the price axis, and these charts look much alike: swings, pullbacks and wicks at every scale. Only the axis tells you the clock. So before you judge a setup, read how many pips it spans.
Worked example: one pip against EUR/USD
Start with the 15-minute row. The median move is 1.9 pips, so half of all 15-minute moves in this window were smaller. Now assume a round trip costs 1 pip, then try 2 pips.
- 15 minutes: 1 / 1.9 = 52.6%. At 2 pips it is 105.3%, so the cost beats the median move.
- 1 hour: 1 / 3.9 = 25.6%, or 51.3% at 2 pips.
- 4 hours: 1 / 8.2 = 12.2%, or 24.4% at 2 pips.
- 1 day: 1 / 23.2 = 4.3%, or 8.6% at 2 pips.
Why those two costs? The box at the top left of our captures showed 1.5 or 1.6 pips between sell and buy at the moment we took them. That is one moment on one chart feed, so we use round examples instead of a quote.
A median move is not a profit, because nobody captures all of it. So suppose, only for the arithmetic, that you collect half of it. At 15 minutes that is 0.95 pips, less than the 1-pip cost. One hour gives 1.95 pips, which leaves 0.95. Five days gives 33.6 pips, which leaves 32.6. That half is our assumption, not a measurement, and it also assumes you called the direction. So use this sum to see the cost, not to forecast a result.
How far price travels as time grows
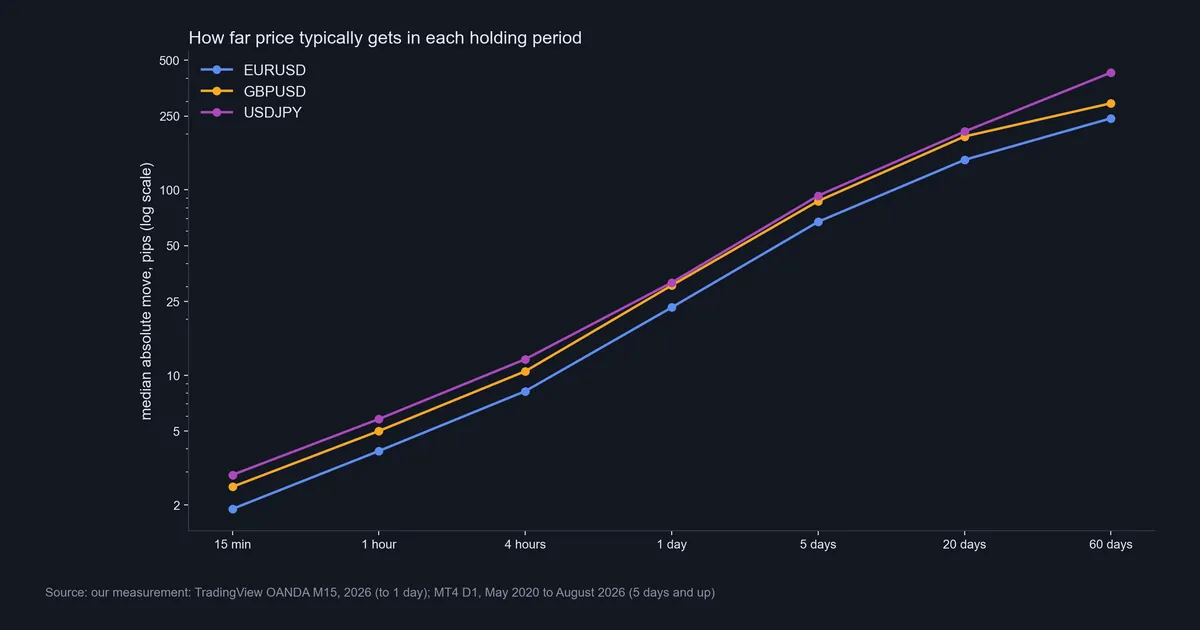
This chart uses a log scale, so equal steps mean equal multiples. On EUR/USD, 15 minutes to 1 hour takes the move from 1.9 to 3.9 pips, and 1 hour to 4 hours takes it to 8.2. Each step is four times the time and roughly twice the move, as the square root rule predicts.
From 1 day to 60 days on the MT4 bars, a random walk gives about 7.7 times. EUR/USD gave 8.2, GBP/USD 7.4, AUD/USD 6.4 and USD/JPY 11.0. Do not read much into 8.2 against 7.7, because a longer OANDA window from 2018 put EUR/USD below 7.7.
One chart note matters. The step from 1 day to 5 days joins two windows, so its slope is not a fair reading.
Why the cost share falls so fast
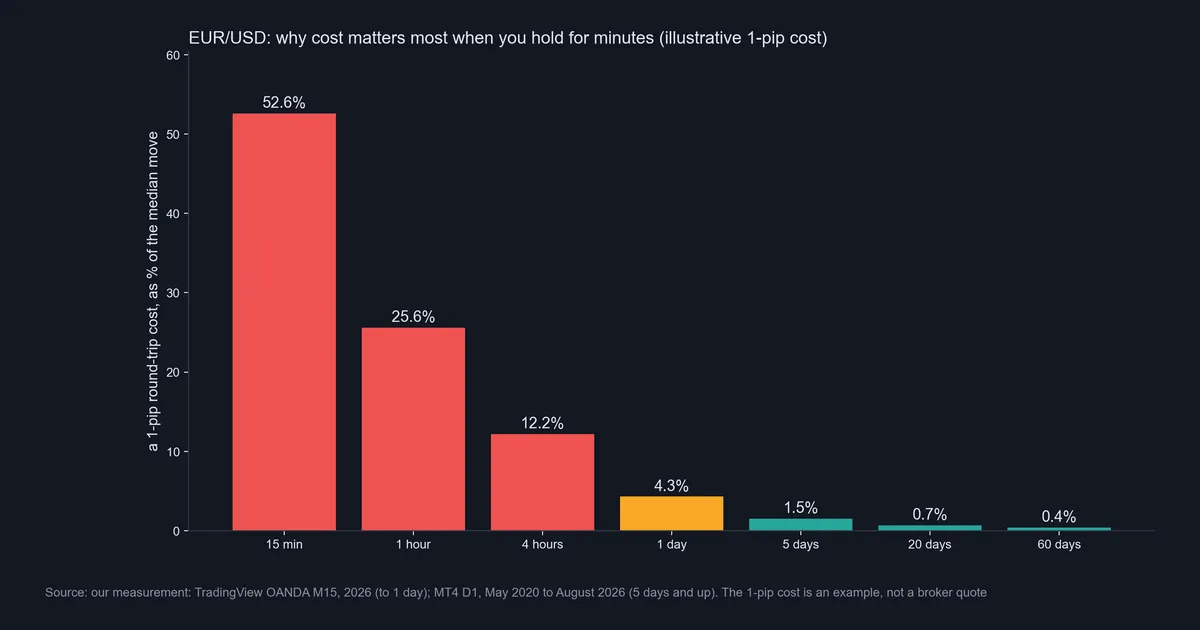
Going from 15 minutes to 4 hours cuts the share from 52.6% to 12.2%, and 5 days takes it to 1.5%. After that the gains get small: 0.7% at 20 days and 0.4% at 60 days. So most of the relief comes from leaving the fastest charts, not from holding for months.
GBP/USD and USD/JPY follow the same path. Their 15-minute medians are 2.5 and 2.9 pips, so 1 pip takes 40.0% and 34.5%. But do not rank pairs on this, because real spreads differ by pair.
Your real figure is yours alone. FX trades over the counter, so no central exchange publishes one spread for everyone. Even the size of the market comes from a survey, the BIS Triennial Central Bank Survey, whose latest round covered April 2025. So take the cost from your own account, at the hours you trade.
Holding longer does not make direction easier
Many traders hope that time will sort out direction. This table shows how often the later close sat higher on the MT4 bars, before costs.
| Pair | 1 day | 5 days | 20 days | 60 days |
|---|---|---|---|---|
| EUR/USD | 49.4% | 50.0% | 49.2% | 49.1% |
| AUD/USD | 51.7% | 52.7% | 52.7% | 52.4% |
| GBP/USD | 50.9% | 50.6% | 53.2% | 55.2% |
| USD/JPY | 55.4% | 58.3% | 60.2% | 70.2% |
EUR/USD stays at a coin flip on every clock, and AUD/USD barely changes. USD/JPY climbs to 70.2%, but that belongs to this sample, not to holding time. The pair rose a long way over this window, so most long holds ended higher. A window in which the yen gained would read differently.
These rows also overlap heavily. Six years of daily bars hold only about 27 separate 60-day blocks, so the last column rests on few real cases. In short, a longer hold made the cost smaller, and on EUR/USD it did nothing for direction.
Download the complete indicator database
Put these concepts on your charts. One email unlocks the full library of 1,380+ indicators with compiled MT4 and MT5 files, plus my TradingView scripts. No paywall, no spam, unsubscribe any time.
Get free access to my indicator database
One email unlocks 1,380+ free MT4, MT5 and TradingView indicators — the complete library. No single-tool download; you get the whole database.
Where it fails
This measurement has real limits, and so does the fast end of trading.
- Close to close only. A trader can exit anywhere between two closes, so more room exists than the median suggests. We did not measure what real exits can reach.
- No strategy tested. These figures say nothing about whether any method makes or loses money.
- All hours blended. The 15-minute median mixes quiet and busy periods, and we did not split it by session. Spreads change through the day as well.
- Costs left out. Slippage hits fast exits. Then swap applies on each night you hold, and our 0.4% at 60 days ignores it.
- Bigger moves bring bigger stops. The typical 60-day move is 242.9 pips, so a stop has to sit further away. Then the position size must shrink to keep the same money at risk.
- Two windows, few pairs. The fast clocks cover 2026 alone, and the slow ones stop in August 2026. We tested no stocks, gold or crypto.
The daily and weekly clocks
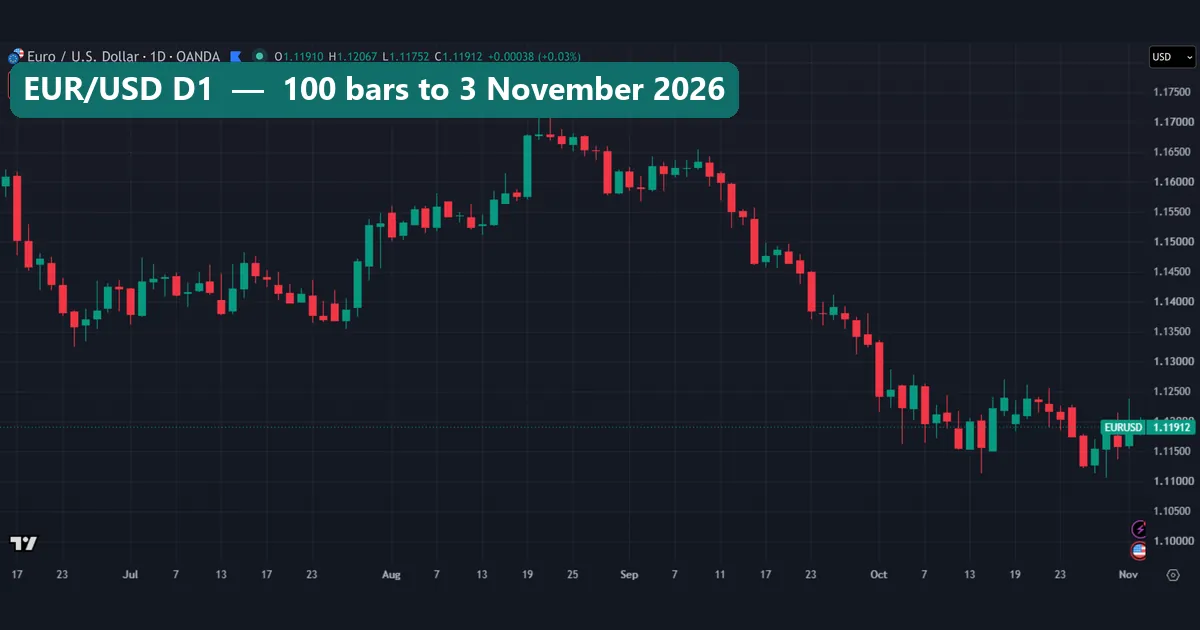
The daily chart covers about four and a half months. EUR/USD fell from 1.17116 on 21 August to 1.11046 on 29 October. That is the hourly chart’s low again, now just the wick of one candle.
It is tempting to call that an easy swing trade, but it only looks easy after the fact. On our count, EUR/USD closed higher 20 days later in 49.2% of cases. So a chart like this does not settle the next 20 days.
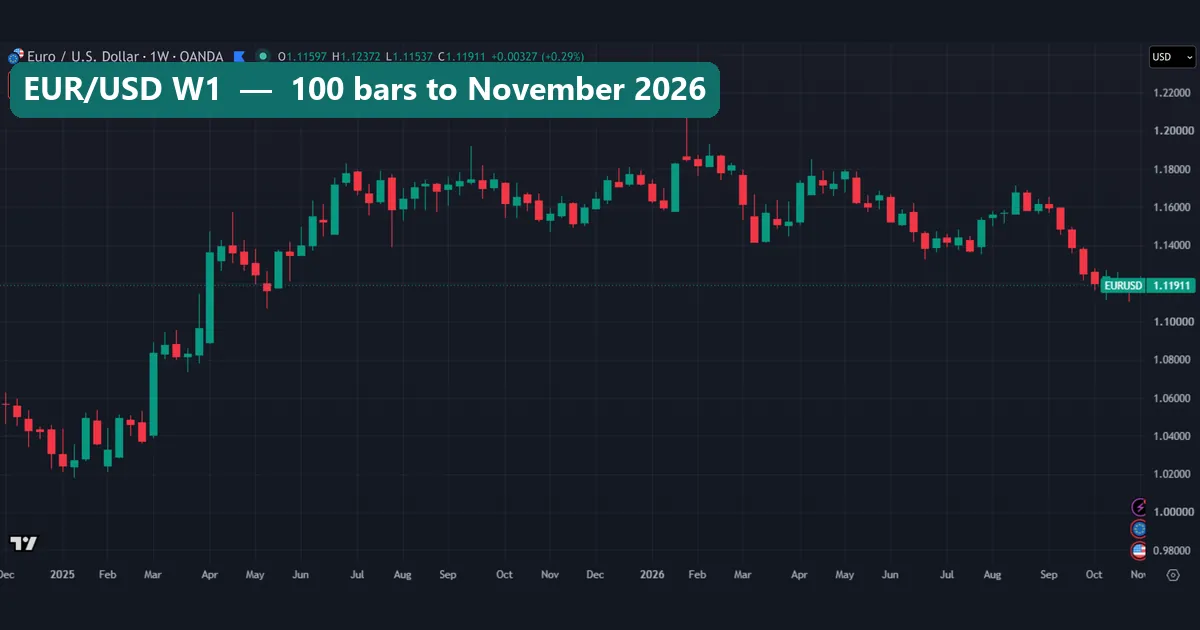
The weekly chart covers about two years, from a low of 1.01779 in January 2025 to a high of 1.20831 in January 2026. Holding for months sits outside short term trading, so treat this shot as a scale bar. For example, several single candles from March and April 2025 span more than the whole hourly chart.
Common mistakes in short term trading
- Treating the median as a target. Half of all moves are smaller, and you will not catch all of the rest. So it describes the market, not your exit.
- Counting only the spread. Commission, slippage and swap all count too. Our guide to forex trading costs lists them.
- Paying the cost too often. The cost repeats on every trade. Trading all 92 of the 15-minute bars in a day would cost 92 pips at our example price, against a median daily move of 23.2 pips.
- Using leverage to make small moves feel large. Leverage scales the result and the cost together, so the cost share stays the same. Read our note on leverage risk. Also, the CFTC’s forex fraud advisory warns that margin trading can make you responsible for losses far above your deposit.
Where to go next
Run this check on your own account first. Write down your real round-trip cost at the hours you trade, then divide it by the median move for your holding period and pair. Next, build that cost into your tests with our note on backtesting transaction costs.
Our four outside sources sit where we use them above: Investor.gov, Wikipedia, the BIS and the CFTC.
FAQ: short term trading questions
What counts as short term trading?
Generally, positions held from seconds to a few weeks. That covers scalping, day trading and swing trading. No single rule sets the cut-off, so sources differ at the edges.
How big is a typical short-term move on EUR/USD?
In our 2026 OANDA window, the median move was 1.9 pips over 15 minutes, 3.9 over 1 hour and 8.2 over 4 hours. Half of all moves were smaller than those figures.
Why does cost matter more at short holds?
Because the cost stays about the same while the move shrinks. An example 1-pip cost equals 52.6% of the median 15-minute EUR/USD move. At 5 days the same pip equals 1.5%.
Does holding longer make direction easier to call?
Not on EUR/USD, which closed higher 49.4%, 50.0%, 49.2% and 49.1% of the time at 1, 5, 20 and 60 days. USD/JPY reached 70.2% at 60 days, but that reflects its long rise in this window.
Which timeframe suits short term trading best?
We cannot name one from this test, because we ran no strategy. The numbers only show that the cost takes less as the hold grows. So start from your own cost and schedule.
Does this mean scalping cannot work?
No, it shows the hurdle and not the outcome. Exits can come at any point between two closes. But a scalper’s cost takes a far larger share of each typical move.
Do these numbers apply to stocks, gold or crypto?
We cannot say from this test, since we measured FX pairs only. The method carries over, though: divide your real cost by the median move for your market and hold.
Can I rely on these figures for my trading?
Use them to size the cost, not as a forecast. They come before most costs, from limited windows, and we tested no strategy. They describe the past only, so results are not guaranteed; past performance is not indicative of future results.
Last updated: 3 November 2026.

About the author
Written by Dominic Walsh, a Forex trader and MT4/MT5 indicator, Expert Advisor and script developer. Every tool on forexmt4systems.com is tested on live charts before release and ships with ready-to-use compiled MT4 (.ex4) and MT5 (.ex5) files. Learn more about the trader and developer behind this site.
How we build, test and correct every tool: Editorial & Testing Policy. Trading carries risk; see the disclaimer.