
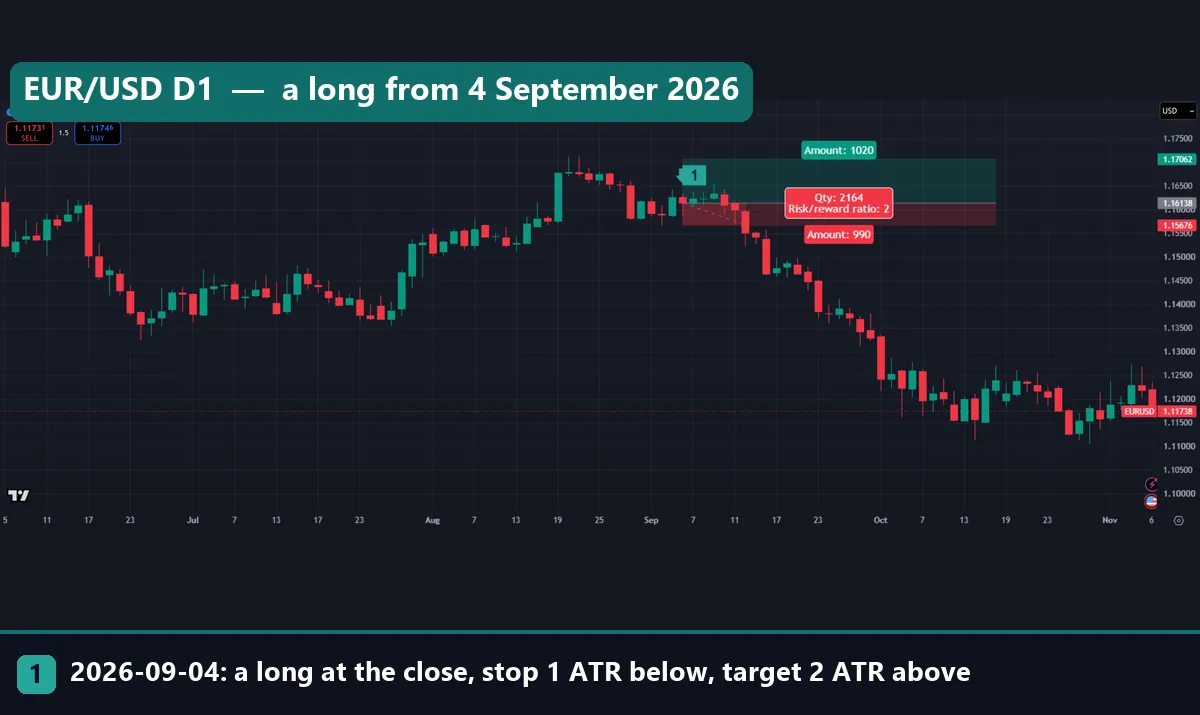
Going long means buying to open a position, so you gain if the price rises and lose if it falls. The harder question is how often a long actually ended higher, and what decided it. This guide settles both with our own numbers. We tested four TradingView markets, back to 1937 for the S&P 500, and 23 currency pairs in MetaTrader 4. The first chart shows one EUR/USD long from entry to exit.
What going long means
A long gains when the price rises. The CFTC glossary describes a long as “one who has bought a futures contract to establish a market position”. Its entry for short reads “the selling side of an open futures contract”. Shares, gold and currency pairs work the same way: you buy first and sell later to close.
A short runs the other way. You sell first and buy back later, so you gain when the price falls. Our guide to The Big Short tells one famous short-side story; read it for the story only.
Forex adds a twist, because every quote is a pair. Buy EUR/USD and you own euros and owe dollars at once. So a long EUR/USD is a long euro and a short dollar in one trade. Our page on what a position in trading is covers the rest of the vocabulary.
How a long position works
The arithmetic fits in two lines. Size is the number of units you hold.
long result  = (exit price - entry price) x size
short result = (entry price - exit price) x size
On a currency pair, the result lands in the second currency, so a EUR/USD long pays out in dollars. The shape is lopsided, too. Without leverage, a long in a share or a coin can lose at most what you paid. Its gain has no fixed ceiling, and a short has the reverse shape.
Leverage changes the loss side, as our guide to leverage in forex shows. So a careful long starts from the stop, not the size. TradingView’s help page on its position tools gives the rule:
Qty              = risk amount / (entry - stop)
Amount at target = account size + (target - entry) x Qty
Amount at stop   = account size - (entry - stop) x Qty
The full version adds a point value, a lot size and a leverage cap. On our EUR/USD chart the first two equal 1.
How we tested going long
We pulled daily bars from the TradingView web chart on 6 November 2026. We dropped the still-forming 6 November bars, so every window ends on 5 November 2026.
- SP:SPX (S&P 500), from 21 June 1937
- OANDA:XAUUSD (gold), from 27 October 1994
- OANDA:EURUSD, from 6 May 2002
- BITSTAMP:BTCUSD (Bitcoin), from 1 January 2013
For each day, we bought at the close and asked: was the close h sessions later higher? We used 1, 20, 252 (a year), 1,260 and 2,520 sessions, plus 5,040 on the S&P 500. Bitcoin trades every day, so it uses 365 days and four years. Before March 1957, SP:SPX is the index’s smaller predecessor. Wikipedia’s S&P 500 history dates the move to 500 companies to 4 March 1957.
The forex test ran on MetaTrader 4, build 1471, on Capital Point Trading’s daily history for 23 pairs. Six crosses start in June or July 2018 and eight on 19 November 2019. The USD majors and EURGBP start on 19 May 2020, and AUDCAD and NZDCAD in June 2025. The terminal has been offline since late August 2026, so no window runs past 24 August. In fact, 15 pairs stop on 28 May 2026.
All figures are price only, before spread, swap, financing, commission and dividends. The windows also overlap, so they are not independent. The 17,460 twenty-year S&P windows hold only about four separate spells. Our editorial testing policy sets out how we run tests like these.
Settings behind the long position tool and our test
These inputs sit behind the first chart and the history test.
| Setting | What it controls | Our value |
|---|---|---|
| Entry price | Where the long opens | 1.16138, the 4 September 2026 daily close |
| Stop level | Where the long closes at a loss | 462 ticks under entry: 1.15676, or 1 ATR |
| Profit level | Where the long closes at a gain | 924 ticks over entry: 1.17062, or 2 ATR |
| ATR | The distance unit for stop and target | Plain 14-day average of the true range: 0.00462 |
| Account size | The balance the tool sizes against | Not changed by us; the tags imply 1,000 |
| Risk | What the stop costs | Implied 10, or 1% of the account |
| Holding period (test) | How long each long stays open | 1 and 20 sessions; 1, 5, 10 and 20 years |
| Prices compared (test) | Entry and exit | Daily close to daily close |
| Costs (both) | What we deduct | Nothing: price only |
The ATR row needs a note. Welles Wilder’s true range takes the largest of high to low, high to prior close, and low to prior close. The StockCharts ChartSchool ATR page explains it, with the smoothing Wilder applied after the first 14 days. Our stop used a plain 14-day average, 0.00462 on 4 September. Wilder’s smoothed figure was 0.00479, so the choice moved the stop by 1.7 pips. Our guide to ATR stop-loss distance covers how traders pick the multiple.
Reading the long side on a monthly chart
A monthly chart suits a long-term long, because each candle folds a month of noise into one bar. Start with the S&P 500 since 2002.
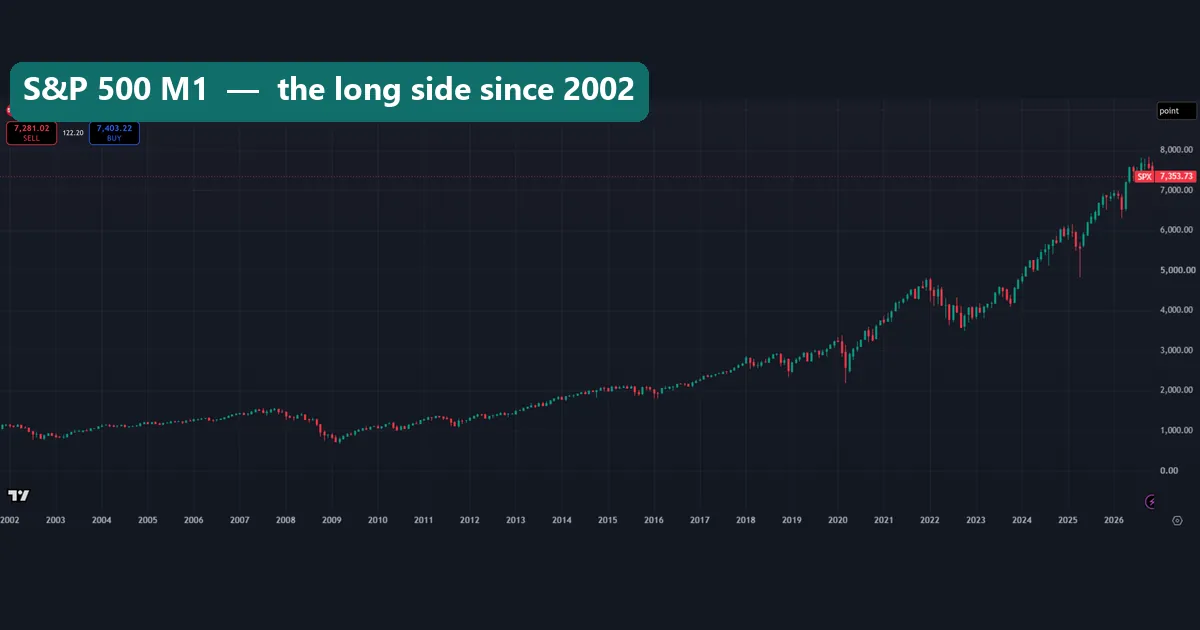
Three falls stand out: 2008 into March 2009, early 2020 and 2022. The close sank to 676.53 in March 2009. Later, the record close came on 6 October 2026 at 7,818.93. Still, a long bought at the 9 October 2007 close of 1,565.15 waited until 28 March 2013 to close above its entry. On 5 November 2026 the index closed 5.95% under its record, after a 4.4% fall that day.
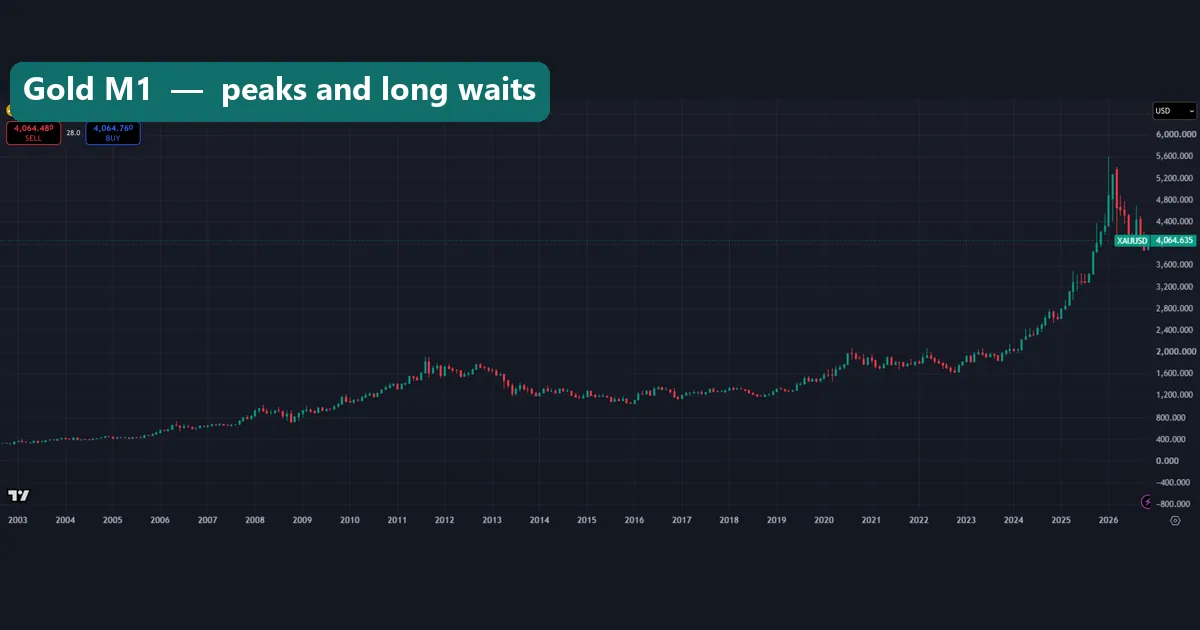
Gold reads differently. A long bought at the 5 September 2011 close of 1,901.65 did not close above it again until 27 July 2020. Then came the run of 2024 and 2025, and a wick above 5,600 in late January 2026. By 5 November 2026, gold closed at 4,088.28. So a monthly chart answers the holder’s real question: how deep were the dips, and how long did they last?
Worked example: one EUR/USD long, step by step
Now go back to the first chart: TradingView’s long position tool on OANDA:EURUSD daily bars. Read it as an illustration of the mechanics, not a call to buy.
First, the levels. The long opens at the 4 September 2026 close, 1.16138, at marker 1. Its stop sits one ATR lower at 1.15676, or 46.2 pips. The target sits two ATR higher at 1.17062, or 92.4 pips, so the tool prints a risk/reward ratio of 2.
Next, the size. The tags read Qty: 2164, with Amount: 1020 at the target and Amount: 990 at the stop. Run TradingView’s formula backwards and the account was 1,000, with 10 at risk. Check it: 2,164 x 0.00462 = 10.00, and 2,164 x 0.00924 = 20.00. In plain terms, you hold 2,164 euros and owe 2,513.23 dollars.
Then the bars decide. Over the next five sessions, the best high was 1.16544 on 9 September, 44% of the way to the target. On Friday 11 September the low touched 1.15692, 1.6 pips above the stop. Then on Monday 14 September the low reached 1.15231, and the stop triggered. The long lost 46.2 pips, or 10 of the 1,000, before spread and swap. A real stop can also fill worse than its level on a fast day.
The pair kept falling and closed at 1.12186 on 5 November 2026, 395.2 pips under the entry. So the stop did its one job: it capped the loss at the planned size. Our guide to the risk-reward ratio adds the missing half. A 2 to 1 ratio sets the size of a win against a loss, but not how often either arrives.
How often a long was higher later
Now widen the lens from one trade to every start day.
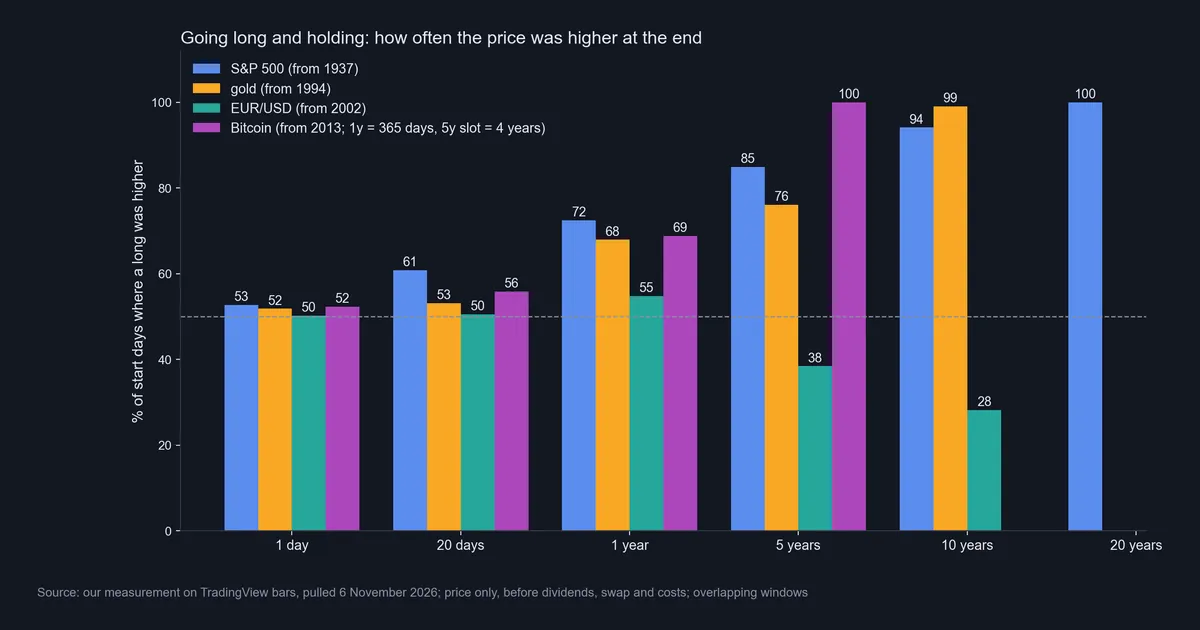
On the S&P 500, a one-day long was higher 52.7% of the time, with a median change of 0.0%. Twenty sessions lifted that to 60.8%, and one year to 72.4%. Five years gave 84.9% and ten years 94.1%. Every 20-year hold ended higher, and the worst, from 2 February 1962, gained 53.8%.
Gold followed a weaker path: 51.8, 53.1, 67.9, 76.1 and 99.0% from one day to ten years. Bitcoin read 52.3% for one day, 55.8% for 20 days and 68.8% for 365 days. Also, every four-year Bitcoin hold since 2013 ended higher.
EUR/USD broke the pattern. One day gave 50.2% and 20 days 50.5%, close to a coin toss. Then the long side lost most long windows: only 38.4% of five-year holds and 28.2% of ten-year holds ended higher. Its median ten-year change was -12.1%, though the pair rose 22.17% over the whole window. So holding longer helped only where the price climbed across the decades. Our bullish or bearish guide shows how those long phases looked on the S&P 500.
Going long in forex: 23 pairs on MT4
The 23-pair test makes the same point more sharply.
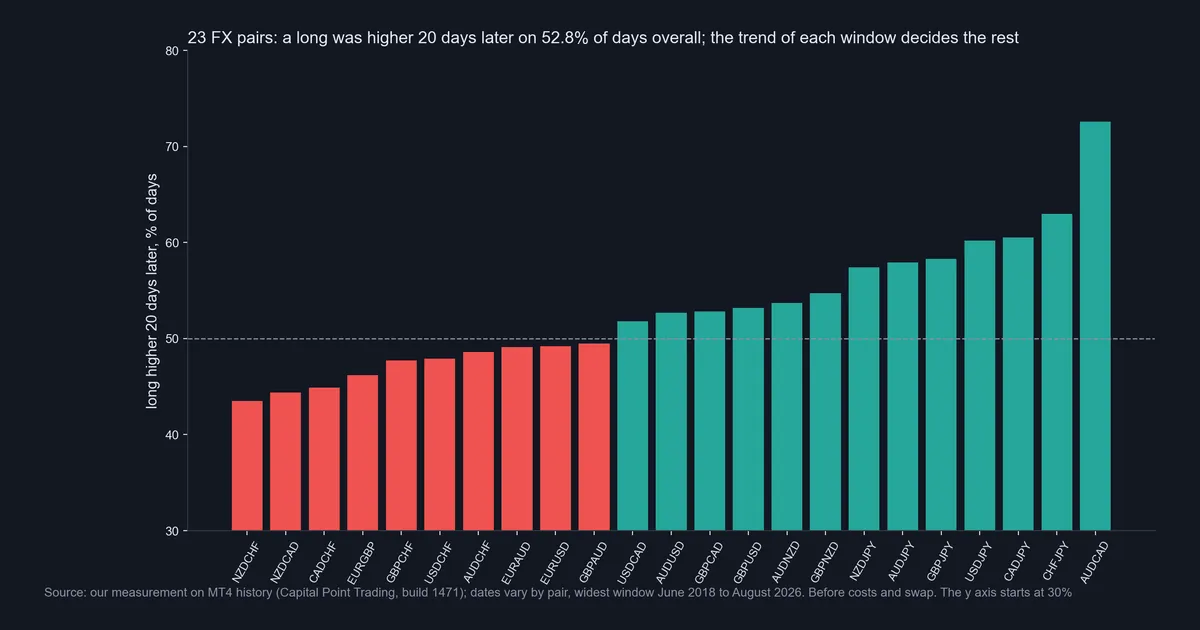
Pooled across all 23 pairs, a long was higher after 1 day on 51.0% of days. After 5, 20 and 60 days the shares were 51.6%, 52.8% and 54.5%. Those are thin margins, before spread and swap.
Per pair, the 20-day figure ran from 43.5% on NZDCHF to 72.6% on AUDCAD. AUDCAD’s window starts only in June 2025, and the pair gained 11.2% in it. All six yen crosses scored above 55%, with USDJPY at 60.2% and CHFJPY at 63.0%. Each rose between 34.8% and 84.7% over its window, so the yen fell against all six partners.
The franc pairs sat at the other end. NZDCHF fell 31.1% over its window and scored 43.5%. CADCHF fell 23.8% and scored 44.9%. A long NZDCHF also shorts the franc, and the franc rose. So in forex the window’s trend set the long side’s numbers, not the act of going long. EURUSD itself scored 49.2% on MT4. For the quotes themselves, see our guide to major currency pairs.
Download the complete indicator database
Put these concepts on your charts. One email unlocks the full library of 1,380+ indicators with compiled MT4 and MT5 files, plus my TradingView scripts. No paywall, no spam, unsubscribe any time.
Get free access to my indicator database
One email unlocks 1,380+ free MT4, MT5 and TradingView indicators — the complete library. No single-tool download; you get the whole database.
Where it fails: the worst long holds
A high share of up windows hides how bad the down windows were. On the S&P 500, the worst one-year hold began on 5 March 2008 and lost 48.8%. Over five years, the worst began on 27 July 1937 and lost 50.4%. The worst ten-year hold, from 3 March 1999, lost 44.9%. Even one day hurt: a long from the 16 October 1987 close was 20.5% lower a session later.
Bitcoin’s worst 365-day hold, from 16 December 2017, lost 83.4%. Gold’s worst five-year hold, from 6 April 1995, lost 35.6%. Meanwhile, the worst ten-year EUR/USD hold, from 30 January 2013, lost 27.8%.
The market matters as much as the method. A single stock or a coin may never return to its old price. Holding through also needs money you will not need, and a deep drawdown in trading tests that hard. Costs grow with time as well. A leveraged forex long pays or earns swap each night, set by the two interest rates and your broker. See our pages on swap in forex and forex swap rates. Finally, our windows overlap and cover one history per market, so they describe the past, not the next window.
What holding a long looked like on EUR/USD and Bitcoin
Two more charts show the cost of waiting.
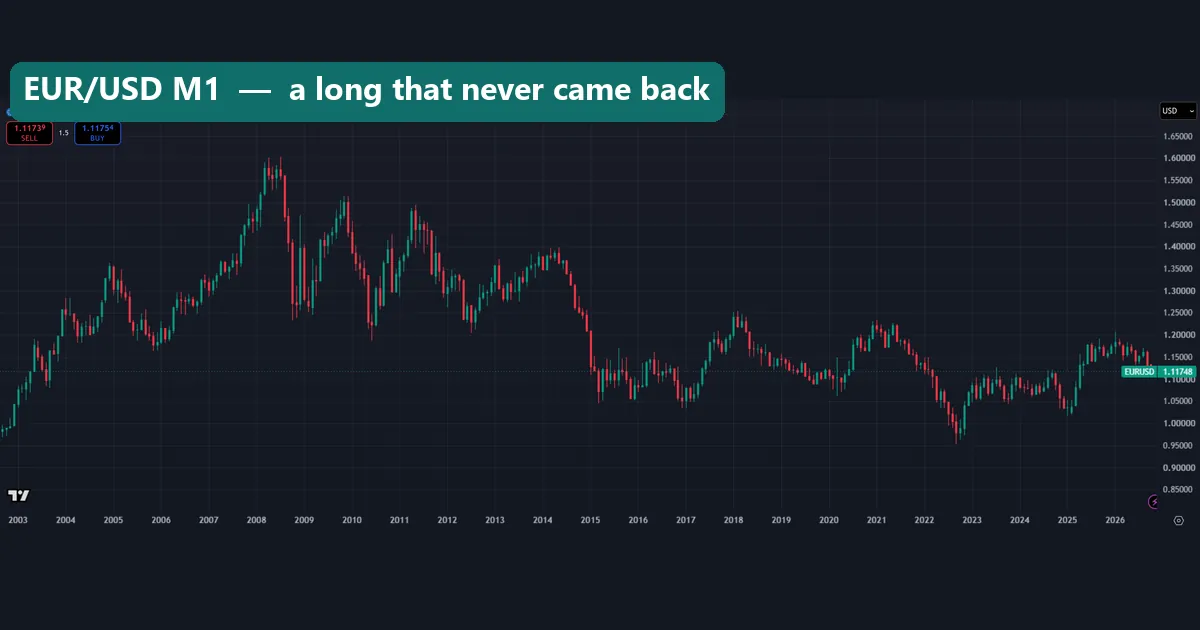
EUR/USD peaked near 1.60 in 2008 and fell below parity in 2022, to 0.9536 in September. A long bought near the 2008 top still sat far under water 18 years later. That chart sits behind the 28.2% ten-year figure.
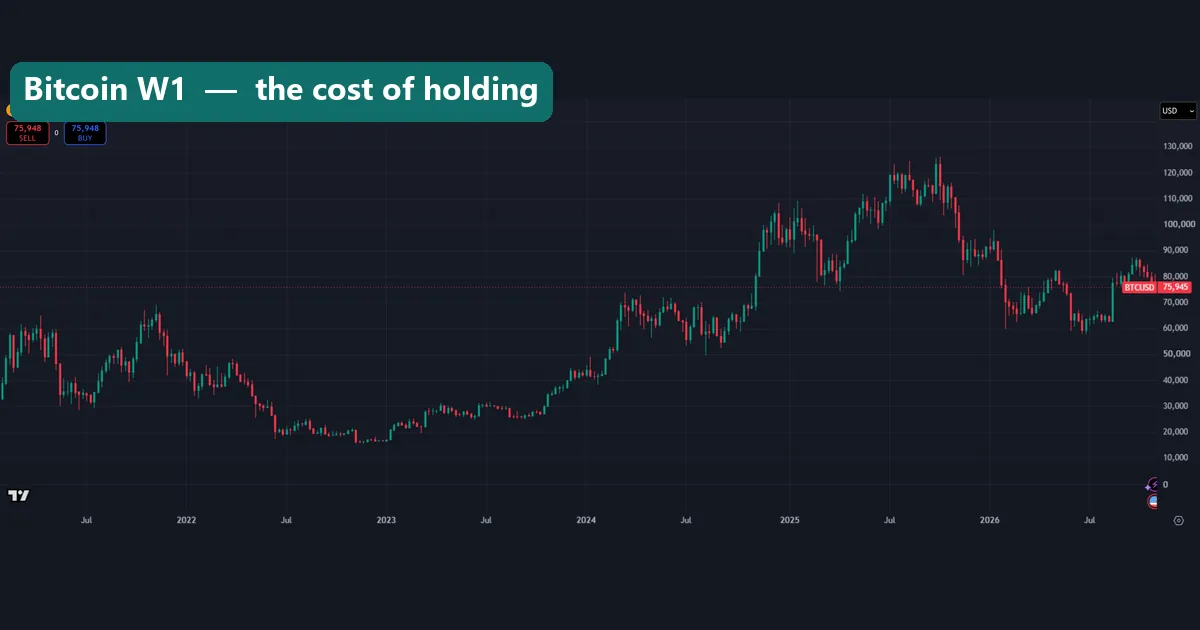
Bitcoin shows a different problem: long-run gains with huge falls on the way. The 15,766 close of 21 November 2022 sat 76.7% under the 67,559 close of 8 November 2021. Then came a record close of 124,728 on 6 October 2025. By 5 November 2026 the close was 75,971.22. Since 7 September 2021 its median daily move was 1.26%, against 0.26% for EUR/USD. Our guide to forex vs crypto trading compares the two markets.
Four common mistakes when going long
1. Reading a long-run share as a short-run edge. One-day longs ended higher 50.2% to 52.7% of the time across our four markets. That is close to even, before costs. For holds of days or weeks, see our guide to short-term trading.
2. Forgetting the other currency. A GBPJPY long also shorts the yen. In our MT4 window, the yen crosses looked strong mostly because the yen fell.
3. Holding a leveraged long like an investment. A share you own outright pays no nightly swap. A leveraged forex long does, and the margin can run out before a recovery arrives.
4. Sizing from hope instead of the stop. Set the stop first, then the size, as TradingView’s tool does. Our guide to position sizing walks through the sums.
Where to go next
For the drawing tool, start with how to use the long position tool in TradingView. Then read what ATR is in trading for the stop side. Our market correction guide covers smaller drops, and BTFD meaning covers buying dips. The trading slang guide lists more terms like this one. Outside the site, the CFTC glossary, TradingView’s help page, ChartSchool and Wikipedia carry the sources we cite above.
FAQ: going long
What does going long mean in simple terms?
Buying first and selling later, so you gain if the price rises and lose if it falls. In forex, buying EUR/USD makes you long the euro and short the dollar at once.
What is the opposite of going long?
Going short: you sell first and buy back later, so you gain when the price falls. The CFTC glossary calls short the selling side of an open futures contract.
How often was a long higher one year later?
A one-year S&P 500 long ended higher 72.4% of the time in our data. Gold gave 67.9%, EUR/USD 54.8% and Bitcoin 68.8% over 365 days. All four figures come before costs, on overlapping windows.
Which currency do I hold when I buy EUR/USD?
The euro, the first currency in the quote, while you owe the dollar, the second one. Our 2,164-unit example held 2,164 euros against 2,513.23 dollars owed.
Does a forex long cost anything overnight?
It can cost or pay. A leveraged forex long held past the daily rollover pays or earns swap. None of our figures include it.
Is a long safer than a short?
Not by itself. Without leverage, a long in a share or coin can lose at most its cost, while a short has no fixed limit. With leverage, both can lose a large share of the account on a small move.
What does TradingView’s long position tool show?
The entry, a stop zone and a target zone, plus quantity, risk/reward ratio and the account balance at each exit. It is a planning drawing and places no order.
Should I hold a long until it comes back?
Only with money you will not need and a market that tends to recover. The S&P 500 took about five and a half years to regain its October 2007 close. Gold took almost nine years after 2011, and EUR/USD has not regained its 2008 high at all. Our figures describe the past; results are not guaranteed; past performance is not indicative of future results.
Last updated: 6 November 2026.

About the author
Written by Dominic Walsh, a Forex trader and MT4/MT5 indicator, Expert Advisor and script developer. Every tool on forexmt4systems.com is tested on live charts before release and ships with ready-to-use compiled MT4 (.ex4) and MT5 (.ex5) files. Learn more about the trader and developer behind this site.
How we build, test and correct every tool: Editorial & Testing Policy. Trading carries risk; see the disclaimer.