
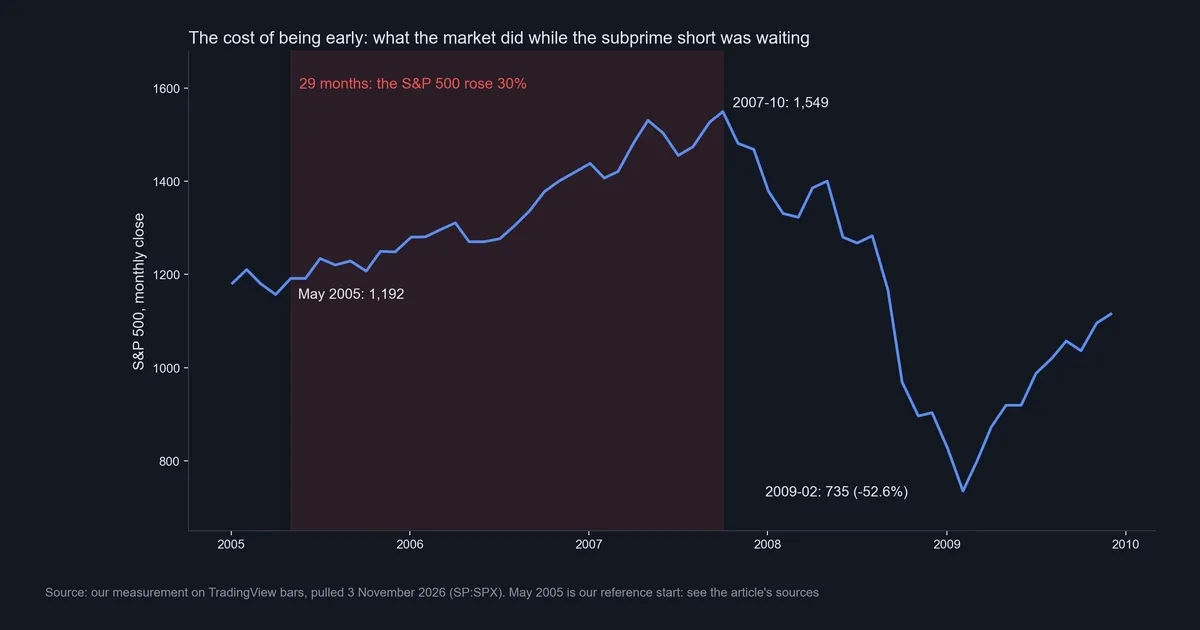
The Big Short is a 2010 book by Michael Lewis, and a 2015 film based on it, about a few investors who bet against US subprime mortgage bonds before the 2008 crisis. This guide settles what the story is, how the bet worked, what official records confirm, and what it cost to wait. We did not measure any fund’s returns, because we hold no prices for those contracts. Instead, we measured the market around the bet. From May 2005 to October 2007, the S&P 500’s monthly close rose 30.0%. Only then did it fall 52.6%, to February 2009.
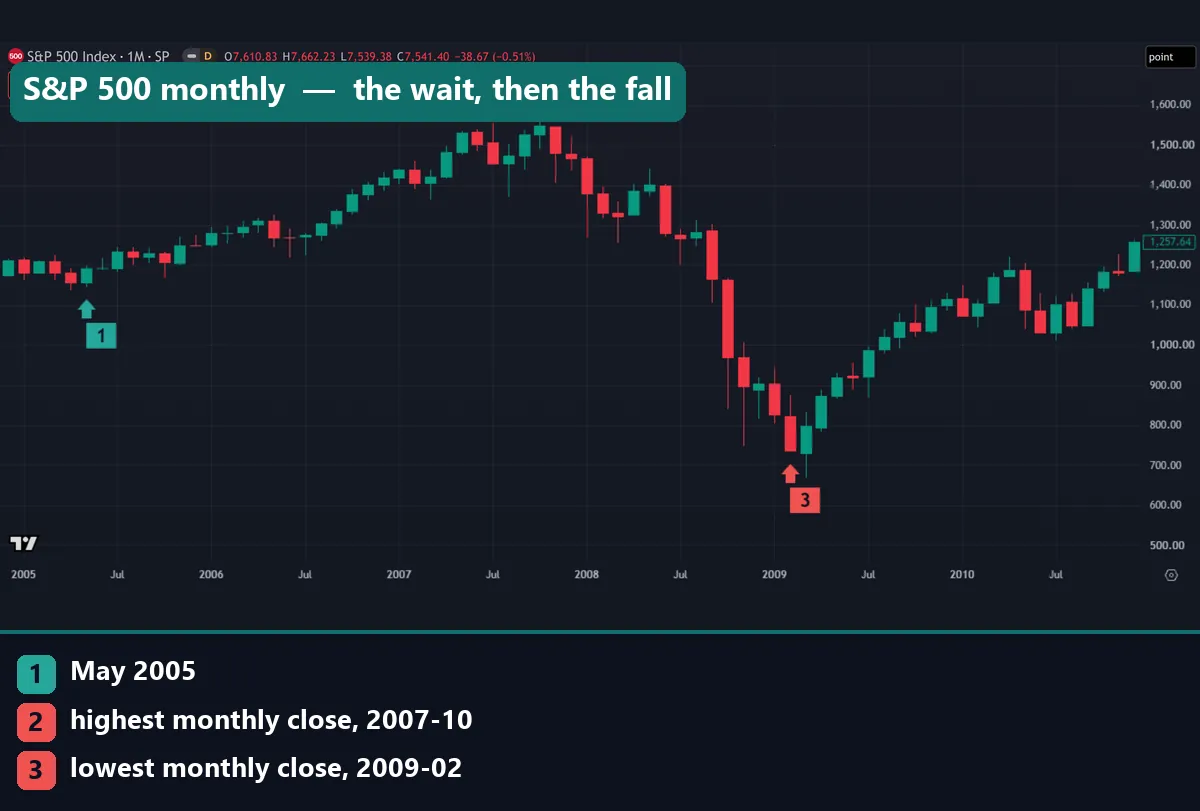
That chart marks our reference start, May 2005 (marker 1), then the highest monthly close (marker 2) and the lowest (marker 3). So anyone who bet against housing in 2005 then watched stocks climb for more than two years.
What The Big Short actually is
The Big Short film entry on Wikipedia lists a 2015 biographical comedy drama, directed by Adam McKay and based on Lewis’s book. It also records that the film won the Academy Award for Best Adapted Screenplay.
However, a film is not a record. The same entry says many character names changed, so Steve Eisman became “Mark Baum” and Greg Lippmann became “Jared Vennett”. Michael Burry kept his own name. It adds that some biographical details changed slightly, and that the film left out Meredith Whitney, who features in the book. So we quote no scene as fact here, and we use only named sources for real people.
Is it a true story? What the record confirms
The trade was real, and you do not need the film to prove it. The Financial Crisis Inquiry Commission (FCIC) report at GovInfo names Burry, Eisman, Cornwall Capital’s Jamie Mai and Ben Hockett, and John Paulson on pages 193 to 195. It says these buyers of swaps “never made a single subprime loan or bought an actual mortgage.”
The start date needs more care. In Michael Lewis’s book excerpt in Vanity Fair, he dates Burry’s first subprime deals to 19 May 2005. By his account, Burry bought $60 million of swaps from Deutsche Bank, at $10 million on each of six bonds.
Meanwhile, the FCIC report says that by the middle of 2005 Burry had bought swaps on billions of dollars of mortgage securities and financial company bonds. So the two sources agree on the year, but they count different things. That is why May 2005 is our reference start. It is a marker we chose, not a trade we can price. Paulson came later, and our guide to John Paulson’s subprime trade covers his side of the same crisis, including the Abacus case.
How the bet worked: credit default swaps
A credit default swap, or CDS, works like a side bet on whether a debt goes bad. Page 50 of the FCIC report sets out the terms. One side pays a regular fee, and the other typically owes the debt’s face value after a default or similar credit event. Hence the sum behind every buyer’s result:
result = payout if the debt goes bad - fees paid until then
The same page explains where the insurance comparison breaks. A car owner can insure only her own car, yet a CDS buyer needs no stake in the loan at all. So these were bets, not cover for something the buyer held. Our guide to hedging in forex shows what real cover looks like. The swaps also traded over the counter, firm to firm, with no exchange between them.
Lewis gives the pricing logic. Protection on a triple-A slice might cost 0.20% a year, on an A slice 0.50%, and on a triple-B slice 2%. He adds that a triple-B slice would be worth zero if the mortgage pool lost just 7%.
The bet also had a clock. Lewis describes loans with a two-year teaser rate that then jumped higher. Burry told the FCIC he expected “a final judgment on housing” when those two-year loans sought refinancing. In short, a 2005 bet aimed at 2007, and the buyer had to pay and wait until then.
How we tested
Our data holds no price history for the swaps, and we cannot check any fund’s books. So we measured the market around them on the TradingView web chart, pulled on 3 November 2026. We used monthly bars for SP:SPX, AMEX:XLF, AMEX:XHB and ECONOMICS:USHPI, and daily bars for TVC:VIX. The crisis figures run from May 2005 to April 2016. Our editorial testing policy explains the method.
Every figure is a price move, before spread, swap, financing, commission and dividends. Default bars may also not match quotes printed back then. On each capture, the top strip and the SELL and BUY boxes show the live quote from capture day, not the period on screen. The D circles mark dividends.
Settings: what we measured, and by what rule
A story has no inputs to tune. Our measurement does have settings, though, and they change the numbers.
| Series | Symbol | Bars | Rule |
|---|---|---|---|
| S&P 500 index | SP:SPX | Monthly | May 2005 close, then the highest close to December 2008, then the lowest to December 2009 |
| Financial stocks fund | AMEX:XLF | Monthly | Highest close from January 2005 to December 2008, then the lowest to December 2011 |
| Homebuilders fund | AMEX:XHB | Monthly | Same rule, but our data starts only in February 2006 |
| US house price index | ECONOMICS:USHPI | Monthly | Highest value from January 2004 to December 2008, the lowest after it, and the first month back at the peak |
| Volatility index | TVC:VIX | Daily | Median and highest close, May 2005 to June 2007, 545 days |
One setting matters most: we use monthly closes. A close ignores the wicks, so these falls come out smaller than high-to-low figures. That is why XLF shows 79.9% here but 84.6% on weekly highs and lows in our Paulson guide. Neither number is wrong, because each one states a different rule.
Reading the fall on a chart: who turned first
Begin with XHB, the homebuilders fund. Its highest monthly close was 44.75 in March 2006 (marker 1), and its lowest was 9.31 in February 2009 (marker 2), a fall of 79.2%. But our history for this fund starts one month before that high, so we cannot see any earlier level.
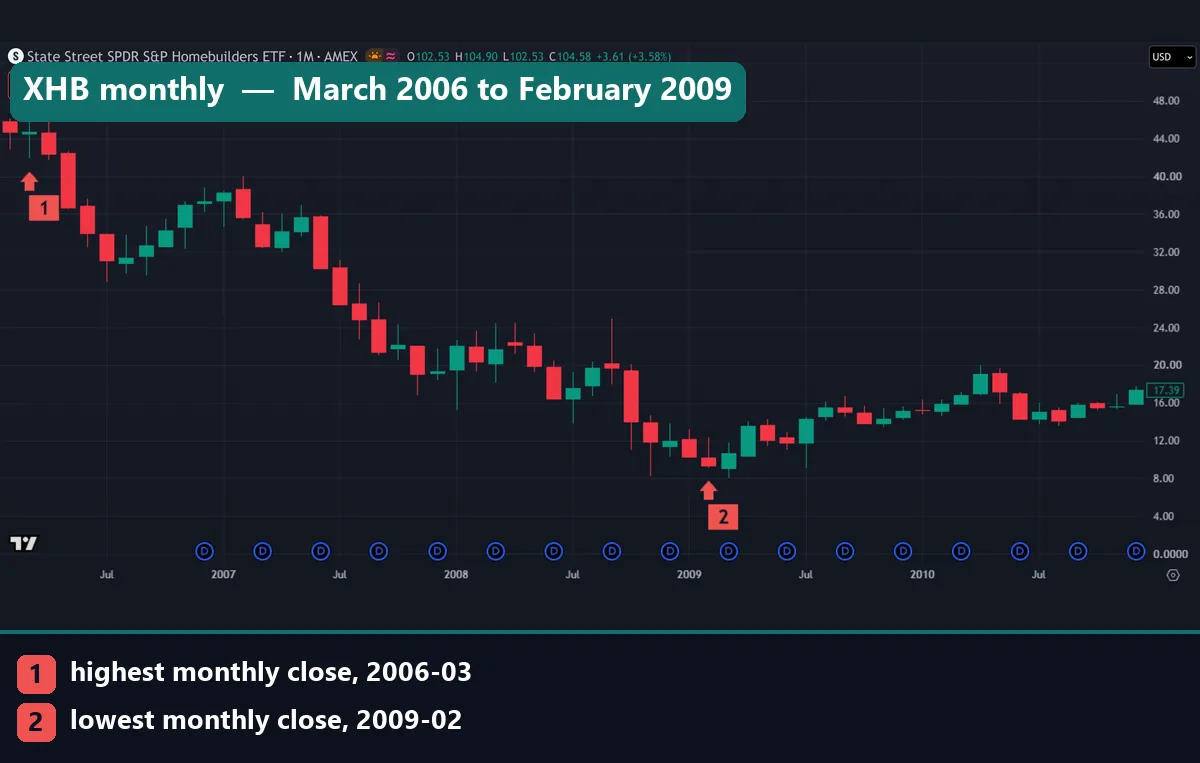
Next comes XLF, which holds US financial stocks. Its highest monthly close was 30.77 in May 2007 (marker 1), and its lowest was 6.17 in February 2009 (marker 2), a fall of 79.9%. So this group held up for 14 months after the homebuilders’ high.
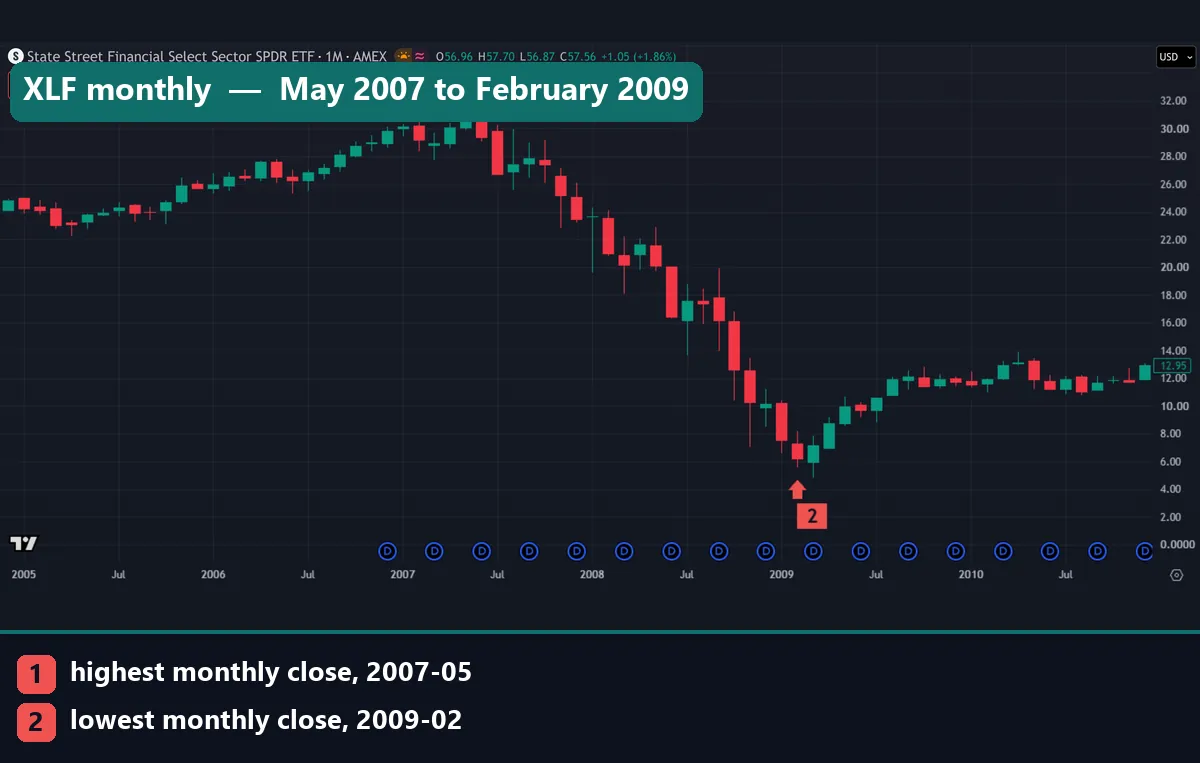
Put the dates in a row and a sequence appears:
- March 2006: XHB’s highest monthly close.
- April 2007: the peak in the US house price index.
- May 2007: XLF’s highest monthly close.
- June 2007: Lewis says two Bear Stearns funds were in freefall. He also says Goldman Sachs then stopped moving the marks against Burry, for the first time in two years.
- October 2007: the S&P 500’s highest monthly close.
So the broad index turned last, 19 months after XHB. By then, on Lewis’s account, the mortgage-bond market had already cracked. Hence a chart of the index alone told you little in 2007.
Worked example: 29 months on the wrong side
Take a plain short on the index, because we can price it. This is a reference, not Burry’s trade, since he bought swaps. Suppose you sold at the May 2005 close of 1,191.50 and held on.
| Point in time | Monthly close | Points from May 2005 | Change from May 2005 |
|---|---|---|---|
| May 2005, our start | 1,191.50 | 0 | 0% |
| October 2007, highest | 1,549.38 | +357.88 | +30.0% |
| February 2009, lowest | 735.09 | -456.41 | -38.3% |
At the October 2007 close, that short sits 357.88 points under water, or 30.0% of the entry price. Then, at the February 2009 close, it stands 456.41 points ahead. A seller at the exact high would have caught 814.29 points. So 29 months of being early gave up 357.88 of those points, and the early seller kept about 56% of the fall. These figures also leave out the dividends a short seller would owe, and financing.
Now compare the waiting cost of a swap. Lewis’s 2% triple-B price means $2 a year for each $100 of protection. Over 29 months, that comes to about $4.83 per $100, before any payout. This is our arithmetic, not Burry’s bill, because we do not know what he paid. Still, it shows the design: a swap turns waiting into a slow, known cost.
That does not make the wait painless. Lewis writes that for nearly two years, dealers marked Burry’s positions against him at each month’s end. One investor warned him that people were talking of withdrawing funds. To keep the swaps, Lewis adds, Burry let half his small staff go and sold other bets.
The cost of being early, in two charts
Our first measurement chart shades the 29 months from May 2005 to October 2007. Next, the second chart shows how far each series fell, from its highest monthly close to its lowest.
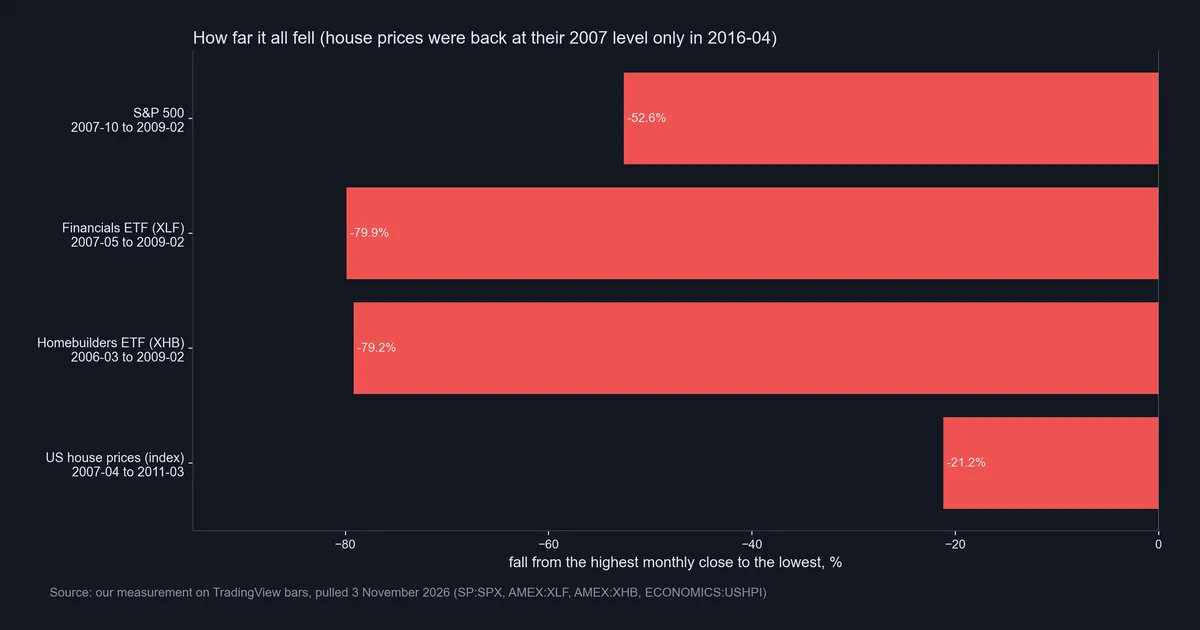
| Series | Highest close | Lowest close | Fall | Rise to get back |
|---|---|---|---|---|
| S&P 500 | 1,549.38 | 735.09 | 52.6% | 110.8% |
| XLF | 30.77 | 6.17 | 79.9% | 398.7% |
| XHB | 44.75 | 9.31 | 79.2% | 380.7% |
| House price index | 224.91 | 177.14 | 21.2% | 27.0% |
The last column is plain arithmetic, and it shows why deep falls take so long to repair. Our guide to recovering from a drawdown works through the same sums. The stock falls also sit far past the 10% line usually used for a market correction.
Download the complete indicator database
Put these concepts on your charts. One email unlocks the full library of 1,380+ indicators with compiled MT4 and MT5 files, plus my TradingView scripts. No paywall, no spam, unsubscribe any time.
Get free access to my indicator database
One email unlocks 1,380+ free MT4, MT5 and TradingView indicators — the complete library. No single-tool download; you get the whole database.
Where it fails: what the book, the film and our charts cannot show
Our charts have real limits, and so does the story.
- We charted stocks, not swaps. XLF and XHB hold stocks, and the S&P 500 is a stock index. We have no series for the mortgage slices or the contracts, so nothing here measures what any fund made or lost.
- The start date is ours. May 2005 comes from Lewis’s account of one investor. Others began at other times, so their waits differed.
- Monthly closes hide the path. Real exits miss both extremes, and XHB’s history barely reaches back before its high.
- One crisis is one sample. We hear about the shorts that paid, and rarely about those that ran out of time. Lewis quotes one investor telling Burry that such grim forecasts “usually have not been realized.” Hindsight hides that, as our guide to cognitive biases in trading explains.
The slow clocks: house prices and the VIX
House prices moved far more slowly than stocks. The index appears as dashes because it carries one value a month. It took another 23 months after May 2005 to peak, at 224.91 in April 2007 (marker 1). Then it fell 21.2% to 177.14 in March 2011 (marker 2), and got back to the old peak only in April 2016 (marker 3). That is nine years from peak to recovery.
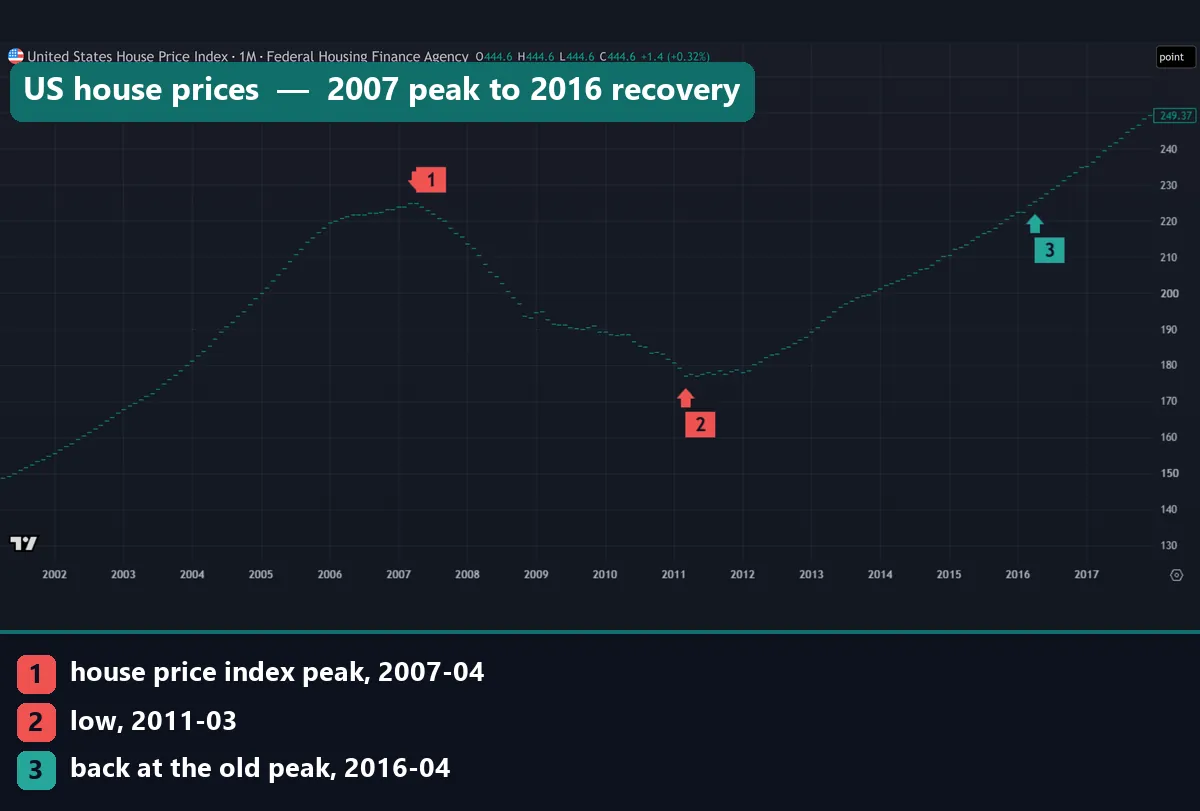
FHFA’s House Price Index page describes a weighted, repeat-sales index, built from mortgages that Fannie Mae or Freddie Mac bought or securitized. So it is a broad measure, not a price for subprime homes.
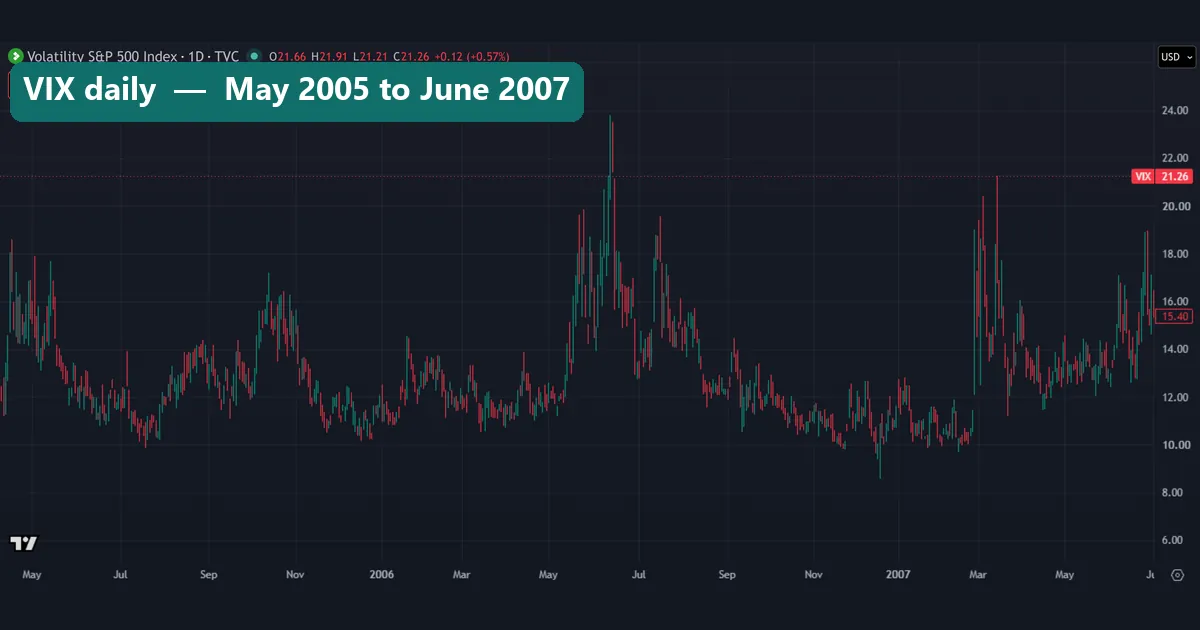
The VIX tells the same story from the options market. From May 2005 to June 2007, its median close was 12.3 across 545 days, and its highest close was 23.8. You can see short bursts in mid-2006 and around March 2007, and both faded. In other words, the stock market looked calm while the bet waited. Ignore the 21.26 tag on this chart, because that is the live quote from capture day. Our guide to the TradingView VIX chart explains the number, and the VIX in forex shows how far it carries to currencies.
What carries over to a retail account
Not the trade itself: these were private contracts between banks and funds, and nothing here suggests you short anything. Three plainer ideas do carry over, though.
Waiting has a bill. In this story it was premiums. For a forex trader it is often the overnight swap charge, which can run against you for as long as the position stays open. So total that bill before you decide how long you can hold.
A correct view does not fund the wait. A 30.0% rise against a short can end a borrowed account long before any fall arrives. That is the real leverage risk. For the same reason, position sizing should assume a long wait, not a quick result.
Other people’s patience counts. In Lewis’s account, the pressure came from investors as well as prices. Likewise, a funded account’s rules can close a trade before your idea plays out.
Common mistakes when reading this story
- Treating the film as a record. It changes names and details, so go to the FCIC report or the book for facts.
- Reading a fund’s fall as someone’s profit. XLF’s 79.9% is a market move, not a short seller’s result.
- Using the stock index as the warning. The S&P 500 was the last of our series to turn.
- Copying the idea with a different tool. A short on a CFD has no capped fee, so it can lose far more than a swap buyer’s premiums while you wait.
Where to go next
Burry’s October 2005 letter, as Lewis quotes it, named the bet “against George Soros and for the British pound” as a market error. Our guide to Black Wednesday covers that 1992 episode. Our outside sources, all linked above, are the FCIC report, Lewis’s excerpt, the Wikipedia film entry and FHFA’s index page.
FAQ: The Big Short questions answered
What is The Big Short about?
It follows a few investors who bet against US subprime mortgage debt before the 2008 crisis. Michael Lewis wrote the book, published in 2010, and Adam McKay directed the 2015 film.
Is The Big Short a true story?
The core trade is real, and the FCIC report names several of the same investors. But the film is a drama, and it changes many names and some details.
What does “big short” mean?
A short is a bet that a price will fall. Here the bet was against subprime mortgage bonds, made mainly through credit default swaps rather than by selling stocks.
When did Michael Burry start his bet?
Lewis dates his first subprime deals to 19 May 2005. The FCIC report puts his swaps at billions of dollars by the middle of 2005.
How much did Michael Burry make?
Lewis reports $100 million for Burry himself and $725 million for his investors. Those are the author’s figures, and we cannot verify them.
How long did the bet take to work?
Lewis says the marks stopped moving against Burry at the end of June 2007, about 25 months after the first deal. Then the S&P 500’s highest monthly close came four months later, in October 2007.
How far did markets fall in the crisis?
On monthly closes, the S&P 500 fell 52.6%, XLF 79.9%, XHB 79.2% and the US house price index 21.2%. These are prices only, before dividends and costs.
Can a retail trader copy The Big Short trade?
No, and we do not suggest trying. The swaps were private contracts between banks and funds, and an ETF or CFD short has a different payoff. Read this as history, not as a signal, because results are not guaranteed; past performance is not indicative of future results.
Last updated: 3 November 2026.

About the author
Written by Dominic Walsh, a Forex trader and MT4/MT5 indicator, Expert Advisor and script developer. Every tool on forexmt4systems.com is tested on live charts before release and ships with ready-to-use compiled MT4 (.ex4) and MT5 (.ex5) files. Learn more about the trader and developer behind this site.
How we build, test and correct every tool: Editorial & Testing Policy. Trading carries risk; see the disclaimer.