
BTFD is trading slang for “buy the dip”: buy a market right after it falls, on the bet that the fall will not last. This article settles how that bet has held up, using our own daily data on the S&P 500 since 1939, then the Nasdaq 100, gold, Bitcoin and EUR/USD. The short answer: the size of a one-day fall told us little, while the market’s position against its 200-day average told us more. We do not tell anyone to buy dips, and the numbers below show why.
What BTFD actually means
The letters stand for “buy the f***ing dip”. Most people drop the rude word, so from here on we just write “buy the dip”. It is forum slang, usually posted as a short, cocky reply when a market falls. We could not trace a first author, so we name none.
A dip is a short fall in price, and no official size defines one. One trader calls a 2% day a dip, while another waits for 10%. Bigger falls have their own names: our market correction guide covers the 10% line that stock indexes use.
The slogan also carries a belief: markets rise over time, so any fall is a discount. That belief has some support on a broad stock index, and far less on a currency pair, where one side falling is the other side rising.
Two proper methods sit close to the slogan. A trend pullback strategy buys weakness inside a defined uptrend, and mean reversion trading bets on a drift back toward an average. BTFD has no such rules, so we added some to test it.
How a dip buy works: the rule and the formula
A dip buy has three parts: a fall, an entry and a recovery that may or may not come. We gave each part a rule and used closing prices only, because a close gives one clear number per day.
- The fall:
day change % = (close today / close yesterday - 1) x 100. A dip is a day at or below our level, such as -2%. - The result:
change after N bars % = (close N bars later / dip close - 1) x 100. “Higher” means above zero. - The pain test:
lowest close in the next 20 bars <= dip close x 0.95counts as a further 5% fall. - The trend filter:
200-day average = sum of the last 200 closes / 200, read at the dip day’s close.
That average is a plain simple moving average, so every close counts equally. TradingView’s Help Center page on moving averages shows the same sum, and our moving averages explainer covers how traders read one.
Why would a fall lead to a rise at all? First, a broad stock index has drifted up over the long run, so entries of any kind had that tailwind. Second, some falls overshoot and then fade. Neither reason tells you that this fall will recover.
How we tested
We pulled daily bars from the TradingView web chart on 3 November 2026: SP:SPX, NASDAQ:NDX, OANDA:XAUUSD, BITSTAMP:BTCUSD and OANDA:EURUSD. The table below gives each window. Next, we marked every day that closed down by a set amount and read the close 1, 5, 20 and 60 bars later. We dropped dip days inside the last 60 bars, so every case has all four results.
The oldest years need a warning. Britannica’s entry on the S&P 500 says the index started small in 1923, tracked 90 stocks from 1926 and reached 500 stocks only in 1957. So our figures before 1957 measure that narrower predecessor, not today’s index.
Every result is before spread, commission, financing and dividends. The dip days also bunch together in crises, so 524 cases hold far fewer separate events. The two bar charts are our own, drawn from these bars, and they say “days” where we say bars. Our editorial testing policy explains how we handle tests like this one.
The parameters behind our numbers
We set different dip levels per market because the markets move by different amounts.
| Market | Daily window | Dip levels | Cases at each level |
|---|---|---|---|
| S&P 500 | 15 Jun 1939 to 2 Nov 2026 | -2%, -3%, -5% | 524, 169, 36 |
| Nasdaq 100 | 27 Dec 2002 to 2 Nov 2026 | -2%, -3%, -5% | 371, 132, 20 |
| Gold | 20 Mar 2006 to 3 Nov 2026 | -2%, -3%, -5% | 190, 66, 10 |
| Bitcoin | 18 Aug 2011 to 3 Nov 2026 | -5%, -10%, -15% | 344, 83, 33 |
| EUR/USD | 30 Sep 2003 to 3 Nov 2026 | -1%, -1.5%, -2% | 212, 60, 13 |
The 200-day average, the four horizons and the 5% pain test stayed fixed. That 5% is a large move on EUR/USD and a much smaller one on Bitcoin, so compare it with care. Bitcoin also trades every day, so its 20 bars cover 20 calendar days. Counts above and below the average run lower than this table, because the first 199 bars have no 200-day average yet.
Reading a dip on a chart
On each capture, marker 1 sits under the dip day and the blue line is the 200-day average. Ignore the quote row, the SELL and BUY boxes and the MA figure at the top left. Those show live values from capture day, not the bars in view.
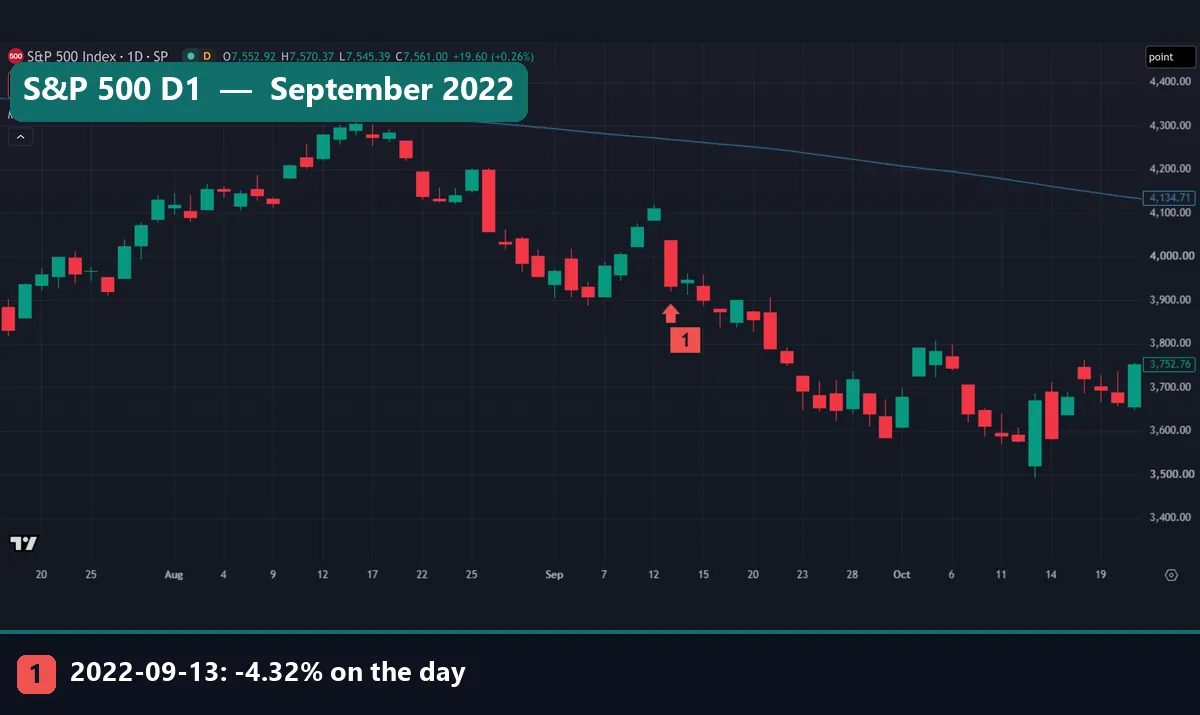
First, September 2022. On the 13th the S&P 500 fell 4.32% and closed near 3,933. The average sat above price, near 4,269, and it sloped downward. So this dip came inside a falling market, and the index slid for most of the rest of the frame.
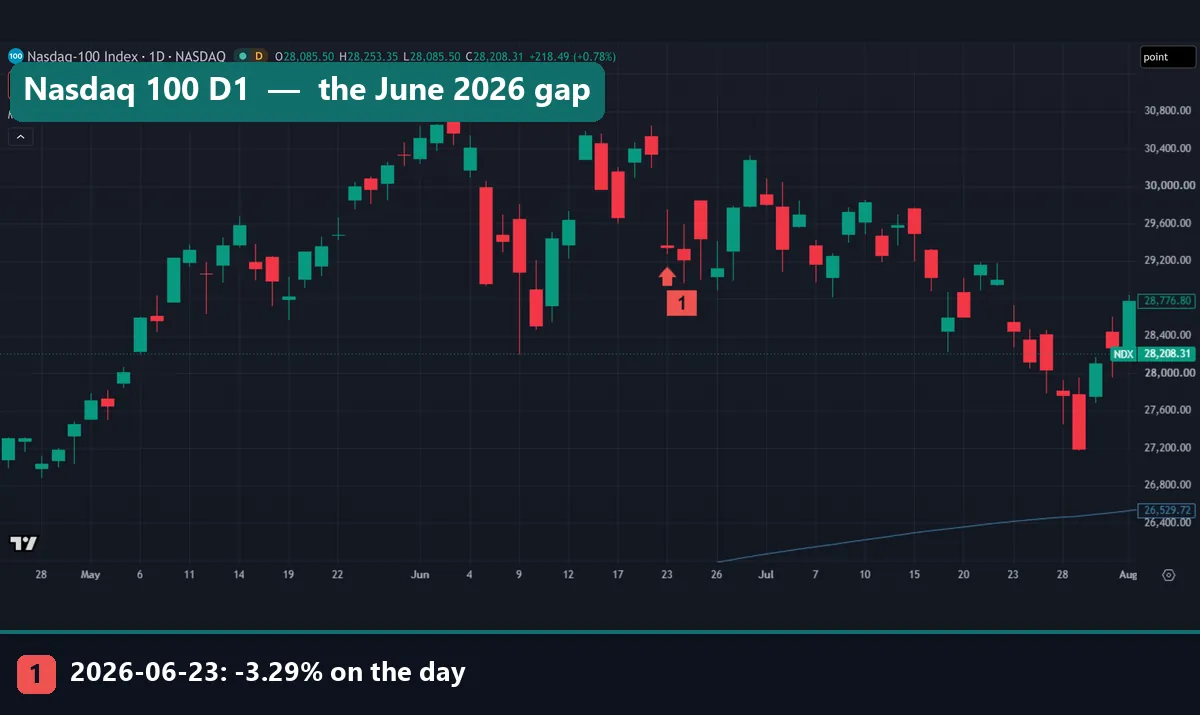
Next, June 2026 on the Nasdaq 100. On the 23rd the index closed 3.29% lower, yet the candle body looks tiny. Nearly all of that fall came from a gap at the open, from a prior close near 30,347 to an open near 29,369. The average sits so far below that its line only enters the frame a few bars later.
So read two things: where price sits against the average, and which way the average slopes. Our numbers test the first only. You can see the slope, but we have not measured it.
Worked example: two S&P 500 falls, two outcomes
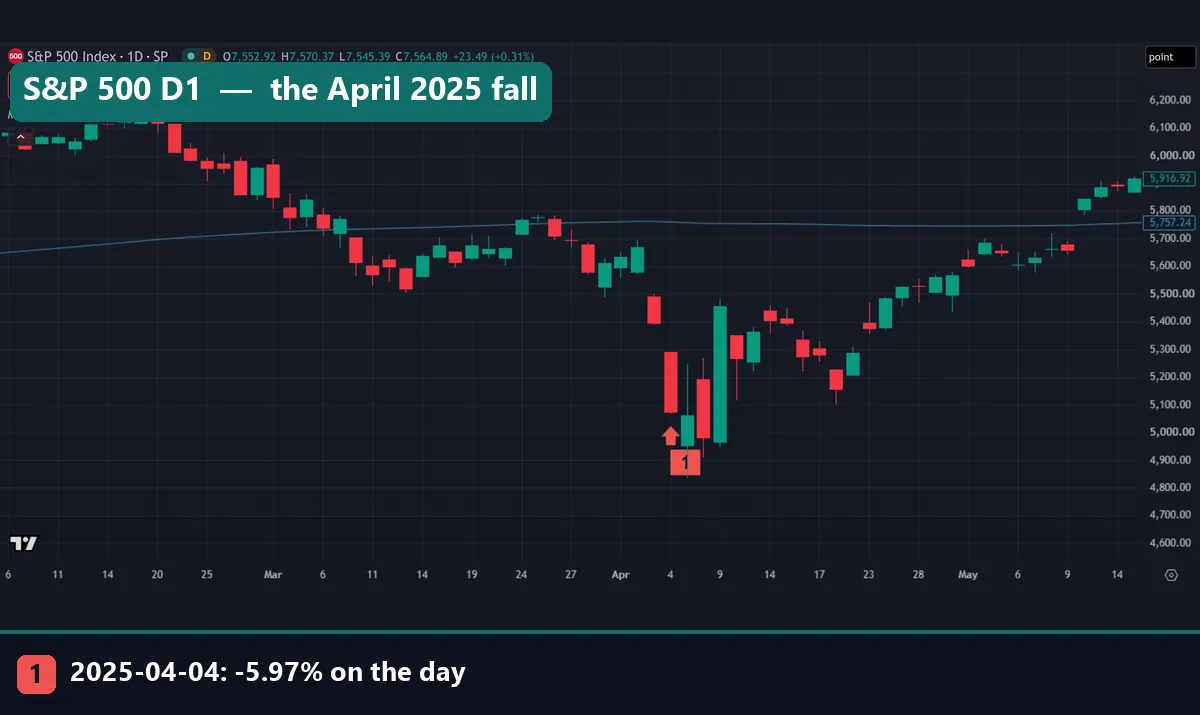
Take the chart at the top of this article and the September 2022 chart above. Both show a large S&P 500 fall with the close below the 200-day average. Here is what followed, close by close.
| Measure | 4 April 2025 | 13 September 2022 |
|---|---|---|
| Fall on the day | -5.97% | -4.32% |
| Dip close | 5,074 | 3,933 |
| 200-day average that day | 5,760 | 4,269 |
| Next close | 5,062 (-0.2%) | 3,946 (+0.3%) |
| 5 bars later | 5,363 (+5.7%) | 3,856 (-2.0%) |
| 20 bars later | 5,650 (+11.4%) | 3,589 (-8.7%) |
| Lowest close in 20 bars | 4,983 (-1.8%) | 3,586 (-8.8%) |
| Further 5% fall? | No | Yes |
A reader who saw only April 2025 would call the slogan obvious. The session low near 4,835 on 7 April gave way to a close near 5,457 on 9 April. Yet September 2022 had the same setup and the opposite result, with a further 8.8% fall inside 20 bars.
The trend filter would not have separated these two, because both sat below the average. We also give no cause for either fall, because the test does not use one. Two cases prove nothing on their own, so next comes the full count.
What the S&P 500 record shows since 1939
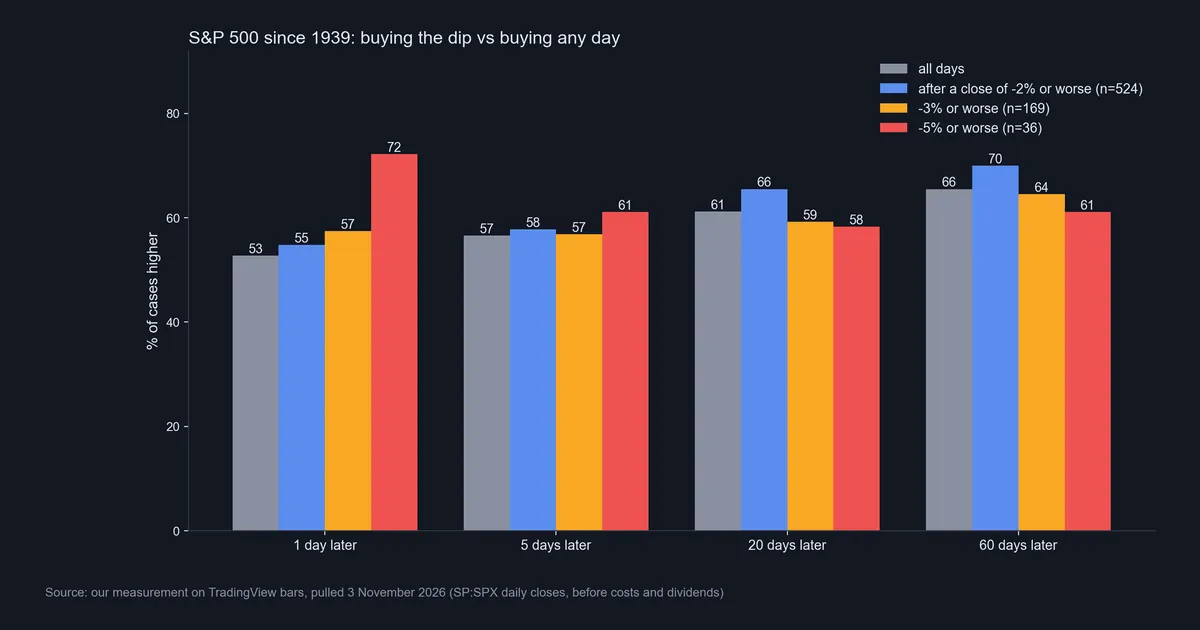
The grey bars show the base rate: any day, no dip needed. The S&P 500 closed higher after 1 bar 52.7% of the time, after 5 bars 56.6%, after 20 bars 61.2% and after 60 bars 65.5%. That base rate does a lot of the work, because the index rose over this whole record.
After a close of -2% or worse (524 cases), those figures become 54.8%, 57.8%, 65.5% and 70.0%. So dips did slightly better than any day. The median 20-bar change also rose, from +1.01% to +2.10%.
Bigger falls did not extend that edge. After -3% (169 cases), 59.2% closed higher at 20 bars, which sits below the base rate. After -5% (36 cases), the next session closed higher 72.2% of the time, but only 58.3% stood higher 20 bars later. So the bounce came often, and it often faded.
In short, this is no free lunch. Large falls also arrive more often than a bell curve would suggest, as our guide on symmetric distribution shows.
The real split: above or below the 200-day average
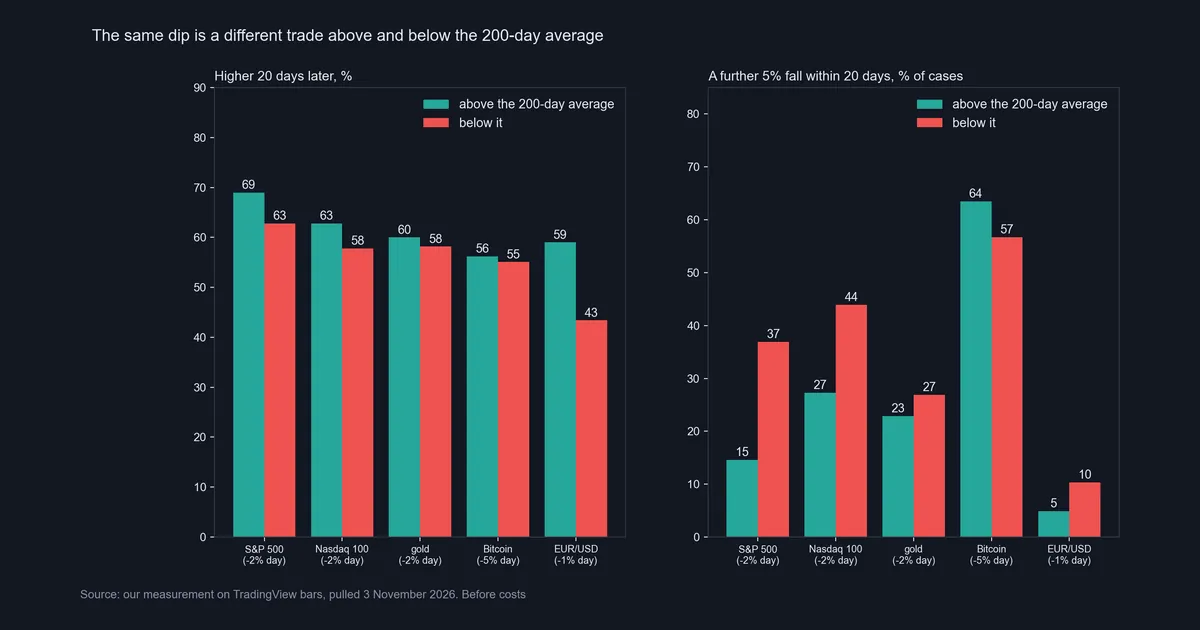
The trend line changed the picture more than the size of the fall did. In the chart, the left panel shows higher closes at 20 bars, and the right panel shows a further 5% fall within those bars. Below are the S&P 500 figures in full.
| Fall on the day | Against the average | Cases | Higher at 20 bars | Further 5% fall |
|---|---|---|---|---|
| -2% or worse | Above | 171 | 69.0% | 14.6% |
| -2% or worse | Below | 344 | 62.8% | 36.9% |
| -3% or worse | Above | 37 | 64.9% | 24.3% |
| -3% or worse | Below | 130 | 56.9% | 49.2% |
| -5% or worse | Above | 4 | 75.0% | 25.0% |
| -5% or worse | Below | 32 | 56.2% | 56.2% |
Look at the last column first. After a -2% day below the average, the further fall showed up about two and a half times as often as above it. The chance of ending higher moved far less. So the average told us more about the pain on the way than about the end result. Four cases at -5% above the line prove nothing, but they do show how rare such a day has been in a rising market.
The Nasdaq 100 leans the same way after a -2% day: 62.8% versus 57.8% higher, and 27.3% versus 43.9% for the further fall. Gold barely moves, at 60.0% versus 58.2% and 22.9% versus 26.9%. So the split holds on some markets, and it is no law.
Other markets: EUR/USD points the wrong way
A currency pair has no built-in upward drift, because one side falling is the other side rising. EUR/USD closed higher 20 bars later just 49.5% of the time, so there is no tailwind to borrow.
After a -1% day above the 200-day average (61 cases), the pair closed higher at 20 bars 59.0% of the time. Below the average (136 cases), that fell to 43.4%, with a median change of -0.69%. So below the line, dips more often kept falling. After a -2% day (13 cases), only 15.4% closed higher at 20 bars. Thirteen cases make a tiny sample, and the latest came on 19 March 2020. Still, it points the opposite way to the slogan.
The Nasdaq 100 gives a smaller warning. After a -2% day, 60.9% closed higher at 20 bars, against 64.5% for any day.
Download the complete indicator database
Put these concepts on your charts. One email unlocks the full library of 1,380+ indicators with compiled MT4 and MT5 files, plus my TradingView scripts. No paywall, no spam, unsubscribe any time.
Get free access to my indicator database
One email unlocks 1,380+ free MT4, MT5 and TradingView indicators — the complete library. No single-tool download; you get the whole database.
Where it fails
First, the S&P 500 is a record with survivors in it. The list inside an index changes over time, as our guide to what indices are explains, so a fading company gets replaced. A single stock has no such repair. The W. P. Carey School’s stock returns research at Arizona State University reports that most stocks worldwide trailed one-month US Treasury bills from 1991 to 2020. Even the five winners in our FAANG stocks guide each lost more than 60% at least once.
Second, a dip that keeps going can wipe out a leveraged account. Our test assumes you hold through every fall at no cost, but real margin does not work that way. Investor.gov’s margin call definition says a brokerage firm can sell your securities to cover a shortfall without telling you first. So you may be out before any recovery arrives. Our page on leverage risk covers the arithmetic.
Third, the pain window is arbitrary. In the June 2026 Nasdaq chart, the lowest close inside 20 bars sat only 2.6% under the dip close. Yet bar 25 closed near 27,192, which is 7.3% under it, and the test never counted that fall.
Fourth, nothing here pays spread or financing. We also tested one entry at one close, with no stops and no adding to the position.
Bitcoin and gold: what a close-based test hides
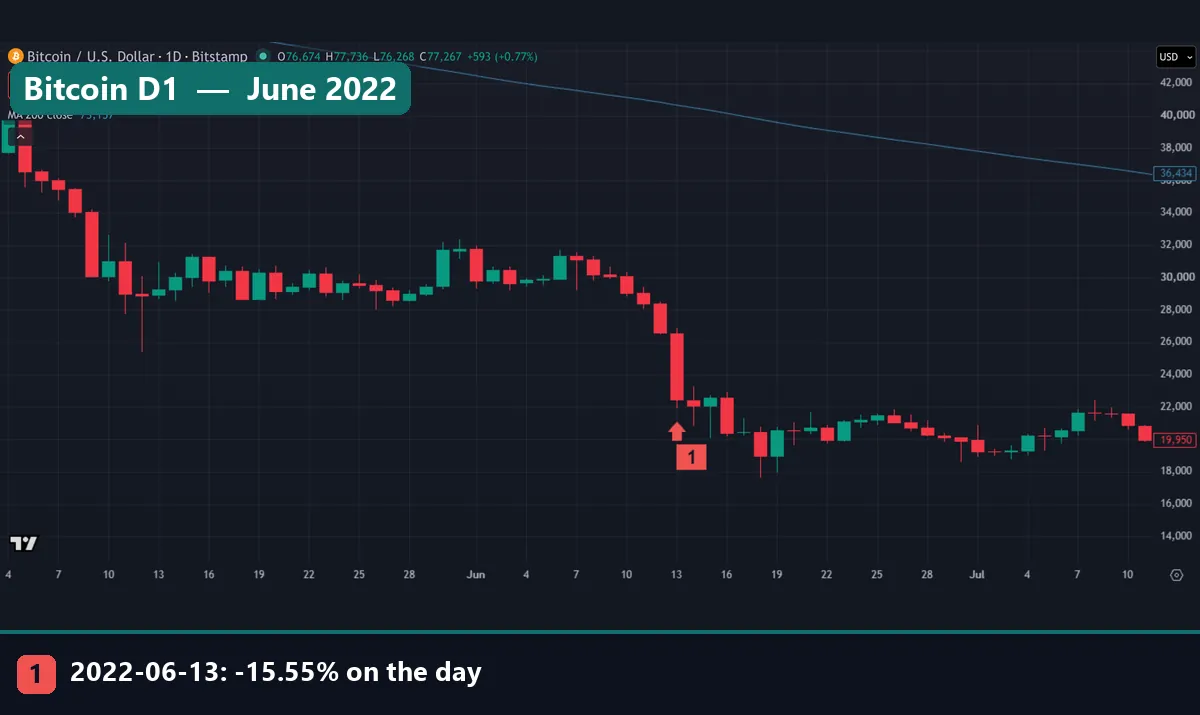
Bitcoin on 13 June 2022 fell 15.55% and closed near 22,450, far below an average near 40,651. Five days later it closed near 18,957, another 15.6% lower, and after 20 days it still sat near 19,294. That ran against its own small record: after a -15% day (33 cases, this one the latest), 66.7% closed higher at 20 bars.
After a -10% day (83 cases), 57.8% closed higher at 20 bars. However, a further 5% fall came within those bars 61.0% of the time above the average and 54.2% below it. We do not promote crypto, and swings this size suit very few accounts.
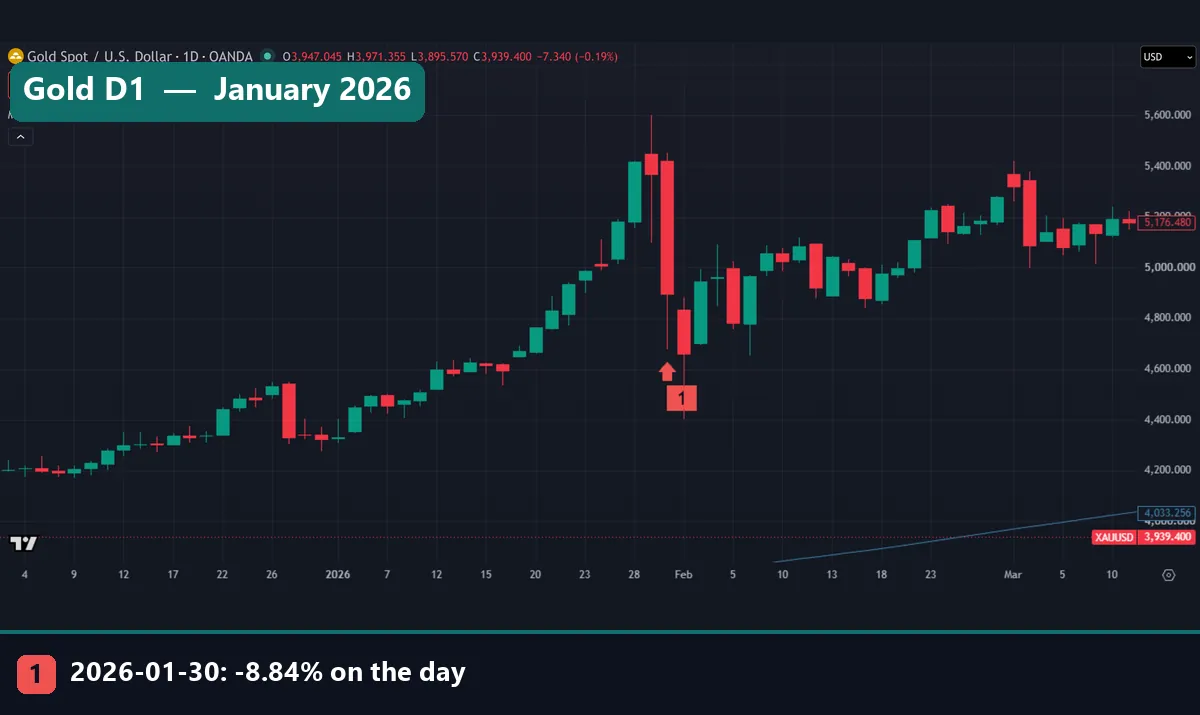
Gold on 30 January 2026 fell 8.84% and closed near 4,895, well above an average near 3,787 that sits under the frame here. The next close, near 4,661, came in 4.8% lower, so our pain test scored no further fall. Yet that session’s low reached about 4,402, roughly 10% under the dip close. A stop or a margin call reacts to that wick, while our test cannot see it. Twenty bars later gold closed near 5,279, up 7.8%. With only 10 such -5% days since 2006, no rate from gold deserves much trust.
Common mistakes when you buy the dip
- Treating every fall as the same event. On the S&P 500, a further 5% fall followed a -2% day 14.6% of the time above the average and 36.9% below it.
- Using the S&P record for something else. A long index record says little about one share or one currency. EUR/USD after a -2% day went the other way.
- Adding to a loser with borrowed money. Each add raises exposure while the account shrinks. Anyone trading a fall needs a position size and a stop loss set before the entry, not during the slide.
- Judging by the first bounce. After a -5% S&P day, the next close stood higher 72.2% of the time. At 20 bars, that was 58.3%.
Where to go next
These pages carry the topic further. None of them tells you when to buy.
- Drawdown in trading: what a deep fall does to an account.
- Margin calls and stop outs: how a forced close works on a forex account.
- The Big Short: the story of 2008, the year with the most large falls in our S&P data.
FAQ about BTFD
What does BTFD stand for?
It stands for “buy the dip”, with a rude word added for force. It is forum slang, not a formal term.
Is BTFD a trading strategy?
No. It is a slogan, with no dip size, no position size and no exit. We had to add fixed rules before we could test it.
Does buying the dip work on the S&P 500?
Slightly, at -2%. After such a day, 65.5% closed higher at 20 bars, against 61.2% for any day. After -3% and -5% falls, the 20-bar figure sat below the base rate. All of this is before costs.
How big does a fall need to be to count as a dip?
No official size exists. We scaled our levels to each market, from -1% on EUR/USD to -15% on Bitcoin. Those levels are our choice, so other levels would give other counts.
Does BTFD work in forex?
Not on our EUR/USD test. Below the 200-day average, only 43.4% of -1% days closed higher at 20 bars. We tested one pair here, so this is no verdict on all forex.
Why did you use the 200-day average?
It is a common, simple line that anyone can plot. We tested only that one, so we make no claim that it is the best. Its clearest effect came on further falls, not on the final result.
Is now a good time to buy the dip?
We cannot answer that, and this data cannot either. At the latest close in our pull, 2 November 2026, the S&P 500 sat above its 200-day average and 3.5% off its high. That is a snapshot, not a call.
Can a dip buy still lose money?
Yes. Every figure here includes cases where the market stayed lower, as the Bitcoin and September 2022 charts show. Leverage can also turn a fall into a loss the account cannot carry. Our tests cover one rule set on past data, before costs, so results are not guaranteed; past performance is not indicative of future results.
Last updated: 3 November 2026.

About the author
Written by Dominic Walsh, a Forex trader and MT4/MT5 indicator, Expert Advisor and script developer. Every tool on forexmt4systems.com is tested on live charts before release and ships with ready-to-use compiled MT4 (.ex4) and MT5 (.ex5) files. Learn more about the trader and developer behind this site.
How we build, test and correct every tool: Editorial & Testing Policy. Trading carries risk; see the disclaimer.