
Mean reversion trading bets that a price stretched far from its recent average will drift back toward it. This guide tests that bet on forex with one plain rule: fade every close beyond two standard deviations of the 20-bar average. On daily bars across 23 currency pairs, the rule made a small profit per trade before costs. On hourly bars it lost, even though most trades closed in profit.
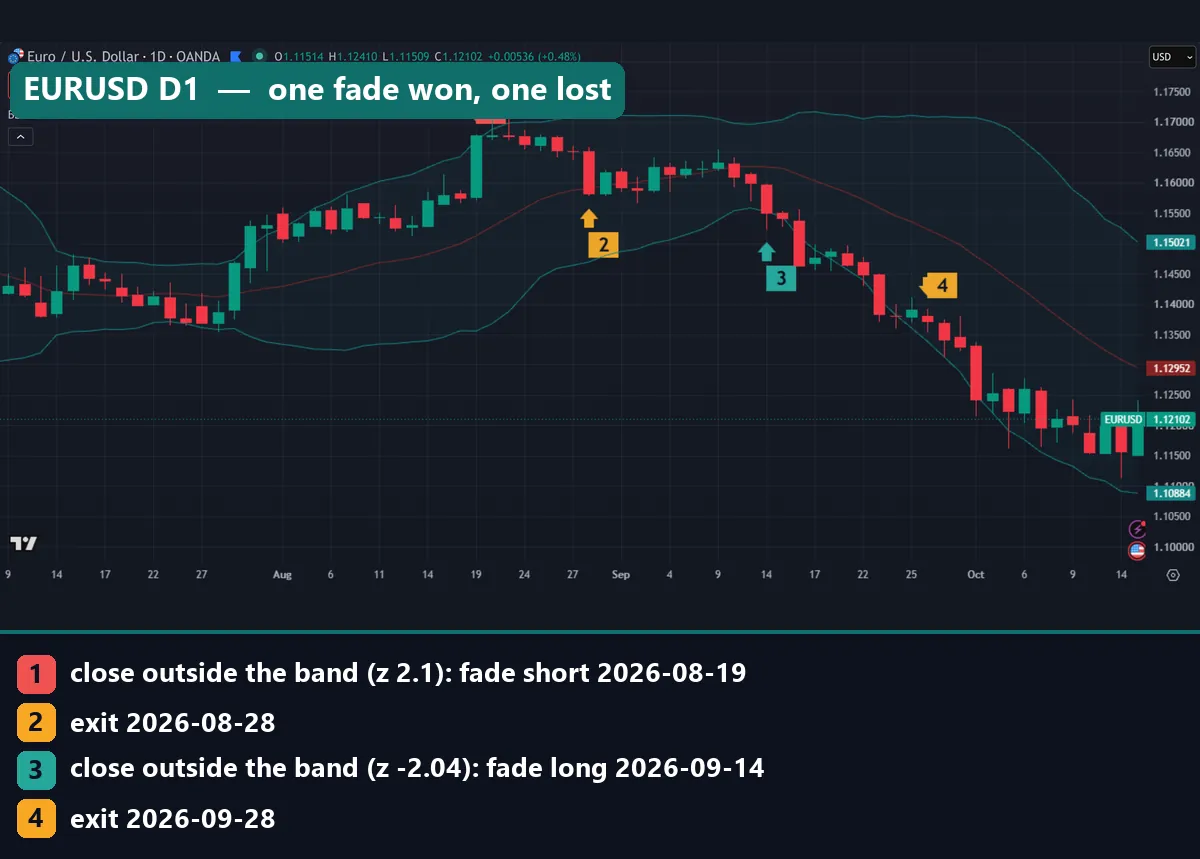
The chart shows the rule twice on EURUSD. A close above the upper band on 19 August 2026 sold (marker 1), and price returned to the middle band by 28 August (marker 2). Then a close below the lower band on 14 September bought (marker 3). Price kept falling, and the 10-bar limit closed that trade at a loss on 28 September (marker 4).
What is mean reversion trading?
Mean reversion is the idea that big moves away from an average tend to fade. The “mean” here is a moving average of recent closes. So a mean reversion trader sells after a sharp rise, buys after a sharp fall, and aims for a return to the average, not a new trend.
Economists have tested the idea over long horizons. For example, James Poterba and Lawrence Summers studied stock returns in their NBER working paper on mean reversion in stock prices. Traders apply it over days or hours instead, and we tested that short version. Most of them measure the stretch with Bollinger Bands, RSI or a z-score. All three ask how unusual the latest close is, not whether a turn will come.
How mean reversion works: the z-score behind the bands
A z-score measures the stretch in standard deviations:
z = (close - SMA20) / standard deviation of the last 20 closes
A z of 0 means the close sits on the 20-bar average, and +2 means two standard deviations above it. Bollinger Bands draw the same math. The middle band is the 20-bar SMA, and the outer bands sit two standard deviations away. So a close outside a band simply means z beyond 2.
Our fade rule has three parts:
- Entry: buy at the close when z is -2 or lower; sell when z is +2 or higher.
- Target exit: close the trade when z crosses back through 0.
- Time exit: close it after 10 bars if price has not come back.
Notice what the rule lacks: a price stop. The 10-bar limit is the only cap on a loser, so the numbers measure the idea itself, not a stop setting.
Mean reversion trading vs trend following
Mean reversion and trend following make opposite bets on the same move. A trend follower buys strength because strong moves tend to continue. A mean reversion trader sells it because stretched moves tend to snap back. So fades suit ranges, while a strong trend hurts them.
Daily forex has leaned slightly toward the fade side. In our efficient market tests on the same 23 pairs, 18 had negative lag-1 autocorrelation: the next day tended to move a little against the day before. Only 7 sat outside the 95% band, though, so the effect is small. The NIST handbook page on autocorrelation explains the measure. A variance-ratio test, adjusted for clustered volatility, also flagged 5 pairs at the 5-day horizon, against about 1.2 expected by chance.
How we tested mean reversion trading
We ran the rule on MetaTrader 4, build 1471, with history from the Capital Point Trading server. Daily bars covered 23 currency pairs from 12 June 2018 to 24 August 2026. Hourly bars covered EURUSD, GBPUSD, USDJPY and gold (XAUUSD), and gold stayed out of the daily test. The method follows our editorial testing policy. Every result comes before spread, swap and commission.
Pip sizes differ too much across pairs, so we scored each trade in units of the 14-bar average true range (ATR) at entry. ATR is roughly the size of a normal bar. So +0.091 ATR is a little under a tenth of one bar’s range.
The charts come from the TradingView web chart with OANDA data, captured on 15 October 2026, with the built-in Bollinger Bands at 20 and 2. Hourly times are UTC. The markers show real trades the same rule took, and we did not pick winners: five of the ten marked trades lost money.
Settings we used
The table lists every parameter, so you can rebuild the test. The default Bollinger Bands inputs match the first two rows, as TradingView’s Bollinger Bands help page shows.
| Parameter | Our value | What it controls |
|---|---|---|
| Lookback | 20 closes | The SMA and the standard deviation |
| Entry threshold | z of 2 (second run: 2.5) | How far the close must stretch |
| Entry price | Close of the signal bar | No fills inside the bar |
| Target exit | Close where z crosses 0 | Return to the average |
| Time exit | 10 bars after entry | Caps a trade that never comes back |
| Price stop | None | The time exit is the only loss cap |
| Result unit | ATR(14) at entry | Puts all pairs on one scale |
| Costs | Not included | Spread, swap and commission |
We ran 2.5 as a second test because it gives fewer, more extreme signals. For other band settings, see our guide to Bollinger Band settings.
Reading a stretch on the chart
Watch where each bar closes against the bands. A wick through a band does not count, because the rule reads closes. John Bollinger makes a similar point in his Bollinger Band rules: a tag of a band is a tag, not a signal.
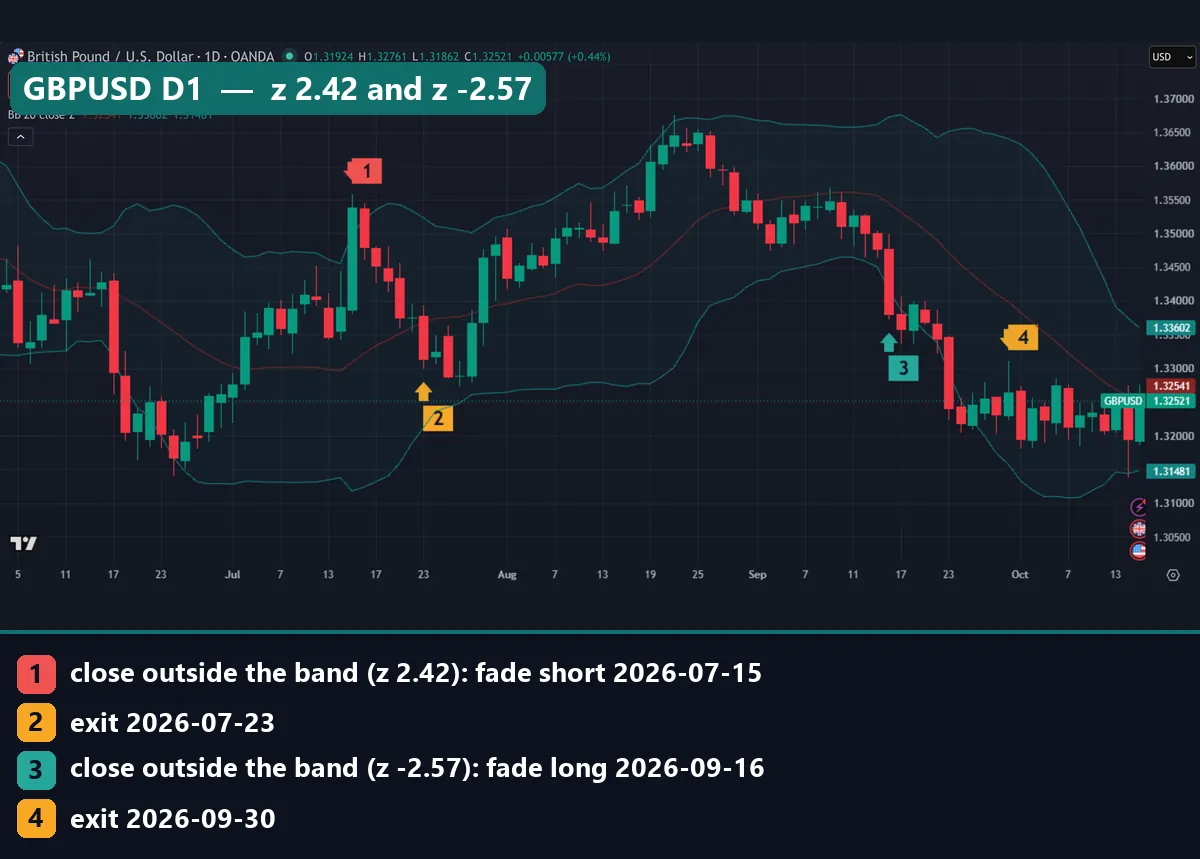
On GBPUSD, the 15 July 2026 close sat above the upper band at z 2.42, so the rule sold at 1.3539 (marker 1). By 23 July the close was back under the middle band, and the trade exited at 1.33144, a gain of 224.6 pips (marker 2). The 16 September signal, at z -2.57, bought at 1.33804 (marker 3). Price kept sliding, and the 10-bar limit sold on 30 September at 1.32636, a loss of 116.8 pips (marker 4).
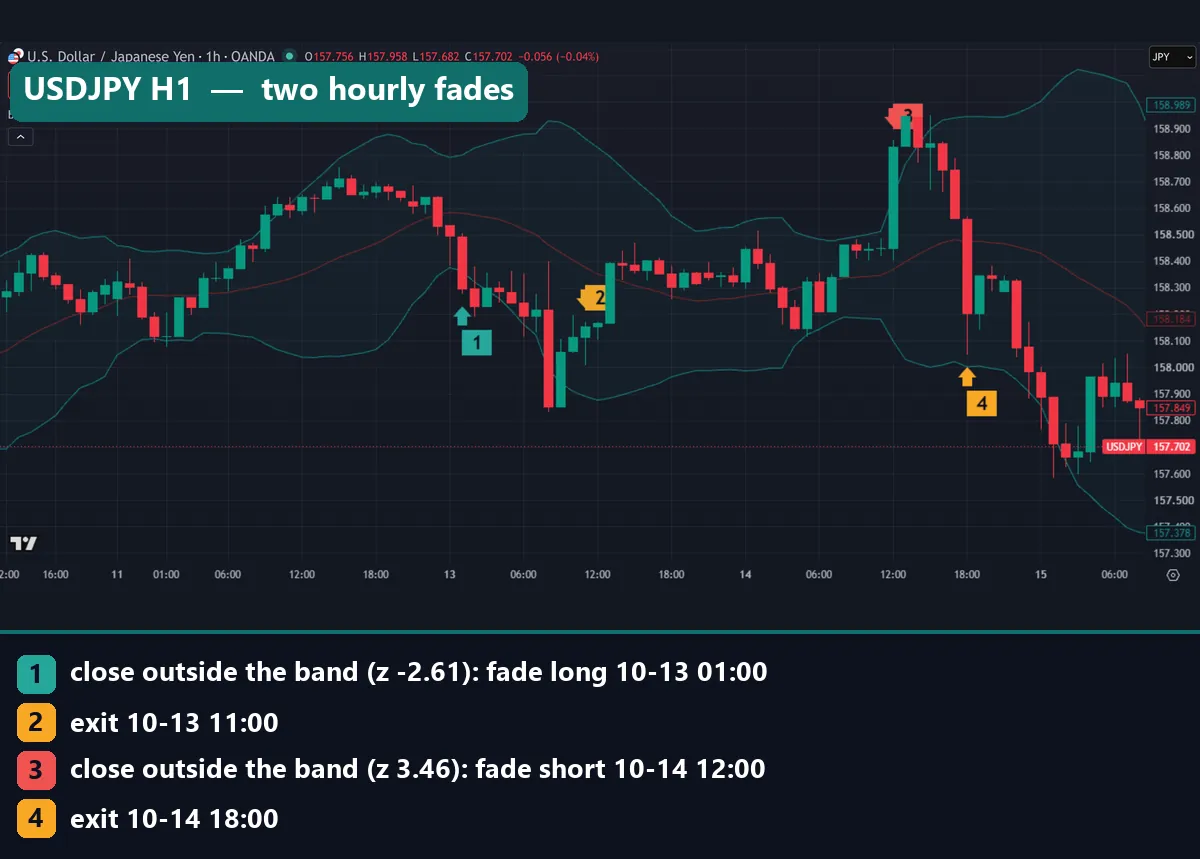
Hourly charts work the same way. On USDJPY, a close below the lower band at 01:00 UTC on 13 October 2026 (z -2.61) bought at 158.296 (marker 1). Price dipped further first, and the 10-bar limit closed it at 11:00 at 158.154, 14.2 pips down (marker 2). Then a spike on 14 October reached z 3.46 at 12:00 (marker 3). That short at 158.832 exited at 18:00 at 158.205, back at the average, for 62.7 pips (marker 4).
Worked example: one EURUSD signal, step by step
You can check any bar with the three numbers the indicator prints. Take the last bar on our EURUSD chart, 15 October 2026. The header shows the middle band at 1.12952, the upper at 1.15021 and the lower at 1.10884. The last price was 1.12102 at capture.
- Band distance: 1.15021 – 1.12952 = 0.02069, which is two standard deviations.
- One standard deviation: 0.02069 / 2 = 0.010345, about 103 pips.
- Distance from the average: 1.12102 – 1.12952 = -0.00850.
- z-score: -0.00850 / 0.010345 = -0.82.
That reading sits well inside the bands, so the rule would not act. Now compare 19 August 2026 (marker 1 on the first chart). EURUSD closed at 1.16774 with z at 2.1, past the +2 threshold, so the rule sold at the close. On 28 August the close finished below the middle band, z crossed 0, and the trade exited at 1.15821. The gain was 0.00953, or 95.3 pips, before costs.
The next signal shows the other side. On 14 September the close fell below the lower band at z -2.04, and the rule bought at 1.15504. Price never got back to the average, and the time exit sold on 28 September at 1.13714. That loss of 179.0 pips came to almost twice the gain. So the two trades netted -83.7 pips, even though one of them worked well.
What 1,636 daily fades showed
Across 23 pairs and about eight years of daily bars, the rule took 1,636 trades. Of those, 57.0% closed in profit, and the average was +0.091 ATR per trade before costs. The median trade made +0.452 ATR. That gap shows the losers at work: most fades earn a little, and a few lose a lot.
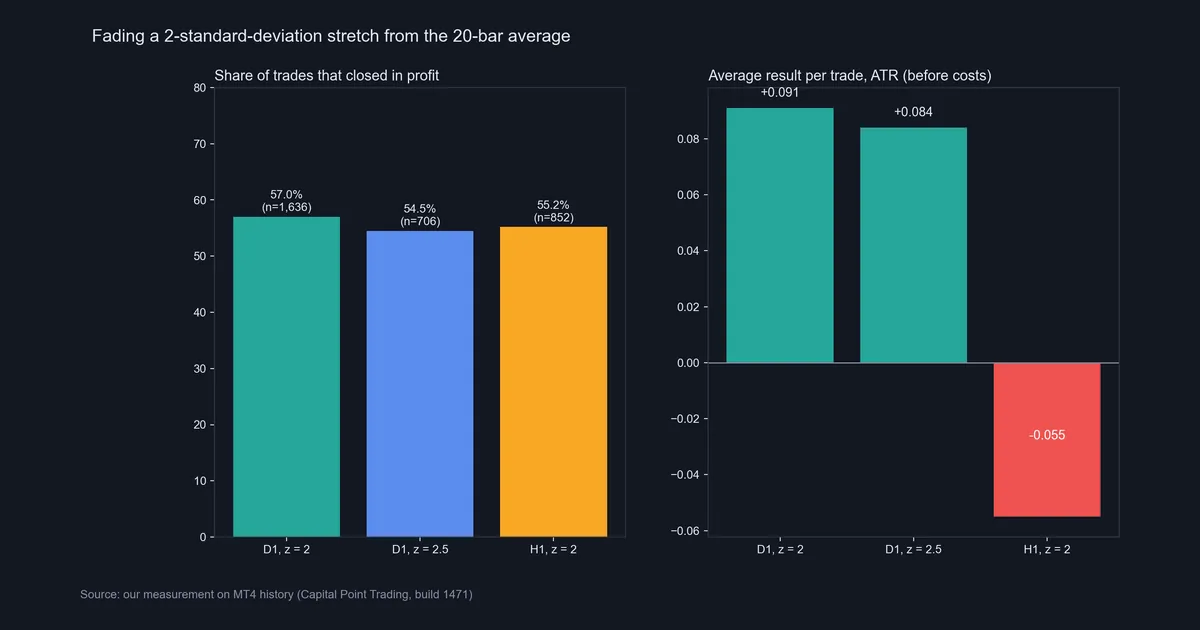
A stricter threshold did not help. At z 2.5 the rule took 706 trades, 54.5% closed in profit, and the average was +0.084 ATR. Hourly bars flipped the sign. On 852 trades, 55.2% closed in profit, yet the average was -0.055 ATR against a median of +0.372. More trades won, but the losers ran bigger. That is why trading expectancy matters more than the share of winners.
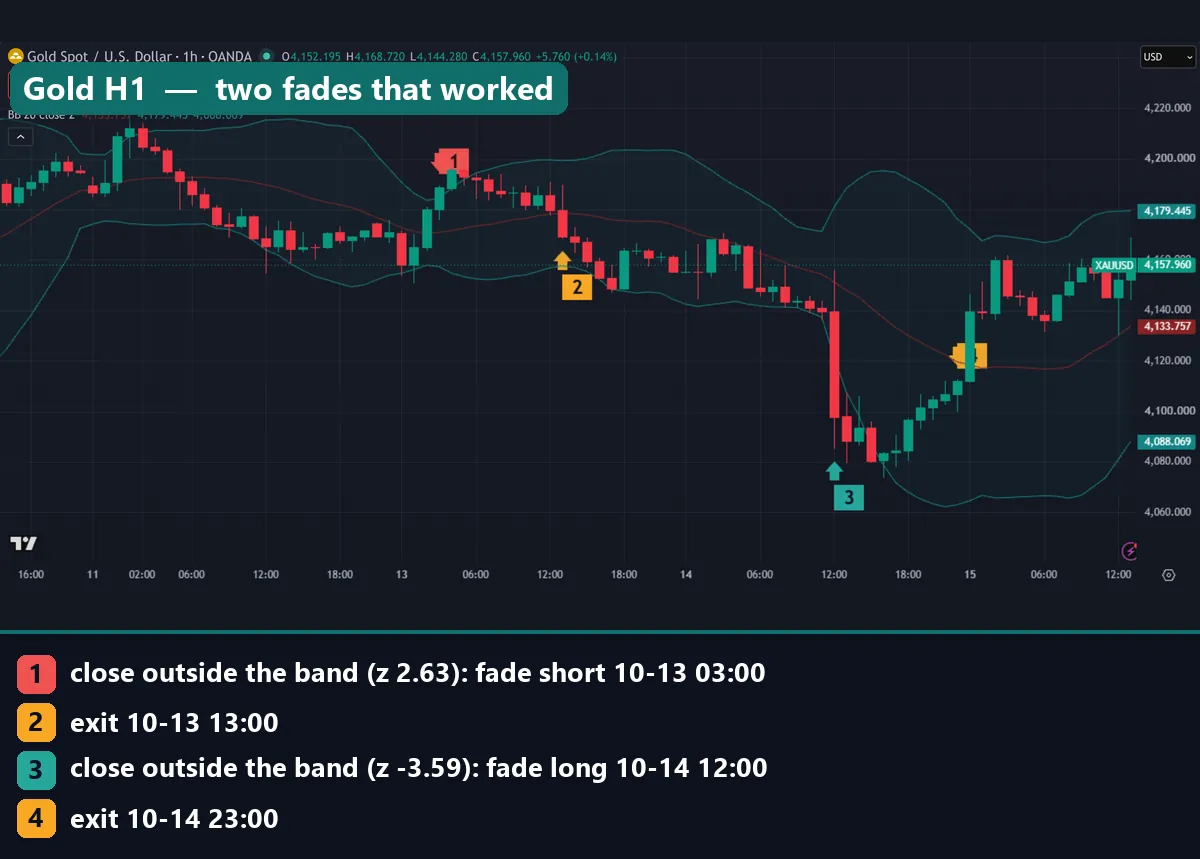
Gold shows hourly fades that worked. On 13 October 2026 at 03:00 UTC, a close at z 2.63 sold at 4,188.555 (marker 1). The 10-bar limit closed it at 13:00 at 4,169.31, about $19.25 lower (marker 2). Next, a drop on 14 October to z -3.59 bought at 4,097.91 at 12:00 (marker 3). It exited at 23:00 at 4,111.905, about $14.00 higher (marker 4). Both made money, yet the hourly average stayed negative.
Download the complete indicator database
Put these concepts on your charts. One email unlocks the full library of 1,380+ indicators with compiled MT4 and MT5 files, plus my TradingView scripts. No paywall, no spam, unsubscribe any time.
Get free access to my indicator database
One email unlocks 1,380+ free MT4, MT5 and TradingView indicators — the complete library. No single-tool download; you get the whole database.
Where it fails: costs, trends and timeframes
The daily edge is thin. An average of +0.091 ATR is under a tenth of a normal day’s range. Spread and commission come off every trade, and swap applies to each night a fade stays open, for up to 10 bars. Our guide to backtesting transaction costs shows how fast small edges vanish. So treat our daily result as an upper bound.
Trends are the second problem. In a hard trend the close can sit outside a band for days, and each close looks more stretched while price keeps going. With no price stop, the rule holds that loser until the 10-bar limit. The charts below show two such trades.
Third, the same rule made money on daily bars and lost on hourly bars. We did not test M15, M5 or weekly bars, so we cannot say where the line falls.
Finally, regimes change. In our split test of rule families, 8 of 27 RSI reversal settings were positive on 2018-2022 data, yet 26 of 27 were positive on 2023-2026. Over those later years, none of the 34 trend settings we tried made money. A fade that looks good now may reflect a quiet stretch of history. The Bollinger Band Width helps you spot the shift, because the bands widen when volatility expands.
Two failed fades on the chart
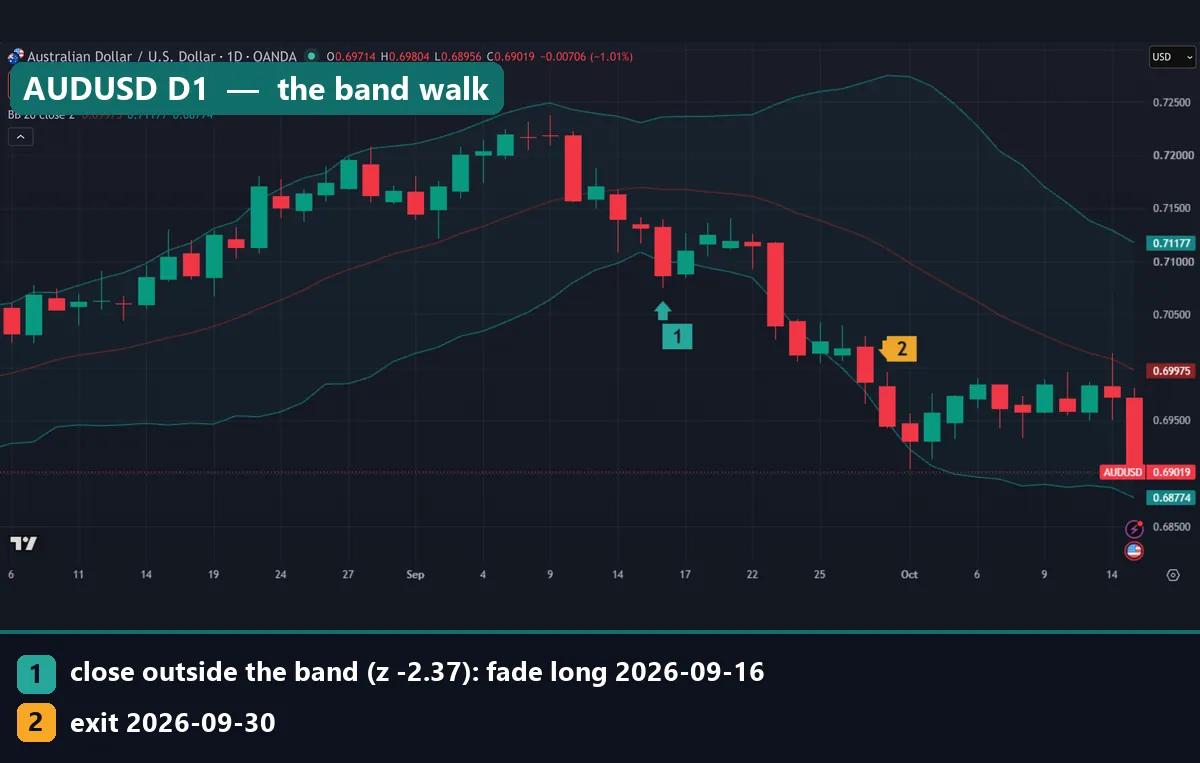
AUDUSD shows the classic failure. On 16 September 2026 a close at z -2.37 bought at 0.70868 (marker 1). About a week later a large bearish candle broke lower, and price hugged the falling lower band. The time exit sold on 30 September at 0.69446, a loss of 142.2 pips (marker 2).
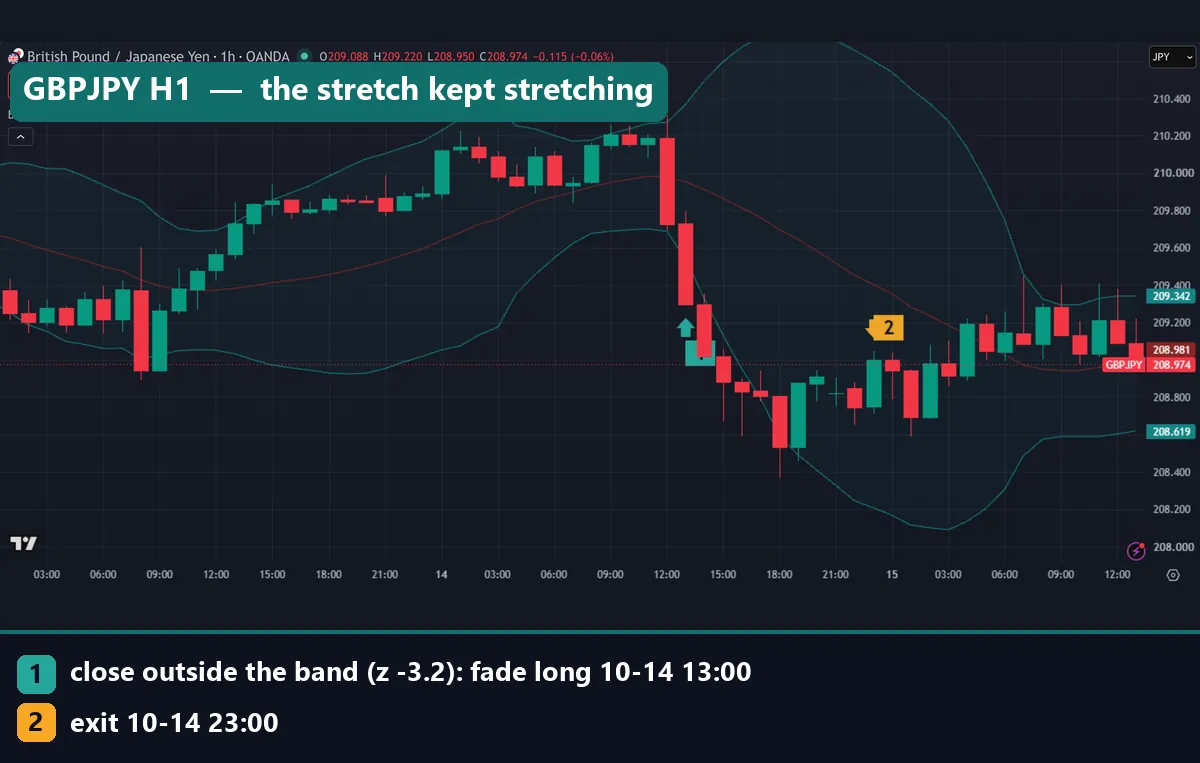
GBPJPY shows the hourly version. At 13:00 UTC on 14 October, a sharp drop closed at z -3.2, and the rule bought at 209.296 (marker 1, partly behind the candle). Price fell for several more hours, then climbed back. At 23:00 the 10-bar limit sold at 209.002, still under the middle band, a loss of 29.4 pips (marker 2). Note how the bands widened after the drop: the yardstick itself moved.
Common mistakes with mean reversion trading
1. Fading every band touch. A wick through a band differs from a close beyond it. Even closes earned just +0.091 ATR per daily trade.
2. Trading without a loss cap. Without any exit rule, one long trend can erase dozens of small wins. Read our guide on how to use a stop loss, then test the stop, because it changes the numbers.
3. Tuning the threshold to the past. Hunting for the one setting that shines leads to curve fitting. In our split test, the best of 27 RSI reversal settings on 2018-2022 data ranked only 9th on 2023-2026.
4. Copying a daily result to a faster chart. The rule lost on H1 although 55.2% of hourly trades closed in profit. Test your own timeframe, with a sample size large enough to trust.
Where to go next
For a full rule set, read our Bollinger Bands mean reversion strategy for EURUSD M15, and weigh its costs against the thin edge above. If you prefer buying pullbacks inside a trend, our trend pullback strategy takes the opposite view. For theory and formulas, go back to the NBER paper, the NIST page, Bollinger’s rules and TradingView’s help page above.
FAQ: mean reversion trading
Does mean reversion trading work in forex?
On daily bars our fade rule averaged +0.091 ATR per trade over 1,636 trades, before costs. Costs could erase that. On hourly bars it averaged -0.055 ATR.
What is the best indicator for mean reversion?
Bollinger Bands at 20 and 2 show the z-score directly. RSI and the stochastic measure stretch in other ways. No indicator adds an edge by itself; the rule and the costs decide the result.
Which timeframe suits mean reversion trading?
In our test, daily bars came out positive and hourly bars negative, before costs. We did not test M15, M5 or weekly bars.
Is mean reversion the same as buying the dip?
Not quite. Buying a dip inside an uptrend counts as trend following with a pullback entry. A fade trades against any stretch, up or down, and aims only for the average.
Why did most hourly trades close in profit but still lose overall?
Because the losers ran bigger. On H1 the median trade made +0.372 ATR, yet a few large losses pulled the average to -0.055 ATR.
Does a stricter threshold like 2.5 help?
Not in our data. At z 2.5 the average was +0.084 ATR on 706 daily trades, close to the +0.091 ATR at z 2 on fewer than half the trades.
Should a mean reversion trade use a stop loss?
Our rule had only a 10-bar time exit, and the AUDUSD trade above lost 142.2 pips under it. A price stop caps such trades but also cuts some that recover, so test it first.
Can I automate mean reversion trading in MetaTrader 4?
Yes. An Expert Advisor can read the built-in Bollinger Bands or compute the z-score itself. Run it in the Strategy Tester with real spread and swap first, because results are not guaranteed; past performance is not indicative of future results.
Last updated: 15 October 2026.

About the author
Written by Dominic Walsh, a Forex trader and MT4/MT5 indicator, Expert Advisor and script developer. Every tool on forexmt4systems.com is tested on live charts before release and ships with ready-to-use compiled MT4 (.ex4) and MT5 (.ex5) files. Learn more about the trader and developer behind this site.
How we build, test and correct every tool: Editorial & Testing Policy. Trading carries risk; see the disclaimer.