
Bollinger Band Width is a single line that tells you how far apart the Bollinger Bands sit, as a share of the middle band. It does not say which way price will go. It only says whether the market is quiet or busy compared with its own past. This guide settles three things: how the number is built, why TradingView prints 0.03 where other sources print 3, and how often a tight reading on EURUSD led to a real move in our own charts.
What Bollinger Band Width is
John Bollinger calls the line BandWidth. It takes the gap between the upper and lower band and divides it by the middle band. So the result is a ratio, not a price.
Bollinger sums it up in his own list of Bollinger Band rules on bollingerbands.com. Rule 18 says BandWidth tells us how wide the bands are. Rule 19 says its most popular use is to find “The Squeeze”. A squeeze is simply a stretch of very low readings, when the bands pinch in around price.
If the bands themselves are new to you, start with our Bollinger Bands explainer. The width line makes more sense once you know what the three bands track.
The line rises when price swings hard and falls when price drifts. So it turns a visual hunch (“the bands look tight”) into a number you can compare.
How the BandWidth formula works
The standard bands use a 20-bar simple moving average as the middle line. The upper band sits two standard deviations above it, and the lower band sits two below. So the gap between the outer bands equals four standard deviations.
The formula: BandWidth = (Upper Band - Lower Band) / Middle Band
With default inputs, that is the same as 4 x standard deviation / 20-bar average. Bollinger points out that this makes BandWidth four times the coefficient of variation. In plain words, it measures spread relative to the price level.
Because it divides by the middle band, the price level does not matter. However, the number stays small on currency pairs, since daily swings are a small share of price. The middle band is a plain average, covered in our guide to how moving averages work.
Why TradingView shows 0.03 and other sites show 3
Some sources multiply the ratio by 100 and quote BandWidth as a percent. For example, the Bollinger BandWidth article in StockCharts ChartSchool treats a reading of 10 as 10%. The TradingView help page for Bollinger Bands Width also writes the formula with a “x 100” at the end.
Yet the built-in “Bollinger Bands Width” pane on our TradingView web chart printed the raw fraction. On EURUSD daily, the last value read 0.03. Our own script, which follows the percent style, read 3.037 for the same bar. Both are right; they just use different units.
So in this guide we quote our measured values in the percent style, such as 0.81 or 3.04. To match them to the TradingView pane, divide by 100. A reading of 0.81 in our tables is about 0.0081 on the chart. The pane rounds it to 0.01. So two decimals are too few for a currency pair.
How we tested
We ran every check on a TradingView web chart with the OANDA:EURUSD feed. The daily test covered 1 August 2025 to 25 September 2026, which is 299 bars. The hourly test covered 10 September 2026 to 28 September 2026. We also opened an OANDA:XAUUSD daily chart to compare gold. All screenshots date from 28 September 2026.
First, we added the built-in Bollinger Bands and Bollinger Bands Width with default inputs. Next, we pulled the same bars into our own script and rebuilt BandWidth from scratch, using a 20-bar average of the close and a population standard deviation. Then we checked that both matched once scaled.
For this guide, a “squeeze” means a reading in the lowest 10% of the test window. To judge what came next, we took the close of the last squeeze bar. After that, we logged the largest close-to-close distance, in pips, over the next 10 bars. It ignores direction, so it is a volatility check, not a trade record.
MetaTrader 4 has Bollinger Bands built in, but it has no stock BandWidth line, so all numbers here come from TradingView. Our full method sits in the editorial testing policy.
Settings and parameters
The TradingView version has three inputs. The last two rows are our own test choices, not platform inputs.
| Setting | Default | What it changes | What we used |
|---|---|---|---|
| Length | 20 | Bars in the middle average and in the standard deviation. Shorter lengths react faster but jump around more. | 20 |
| Source | Close | The price fed into the average. Close is the usual choice. | Close |
| StdDev | 2 | How far each band sits from the middle. A larger multiplier scales every reading up by the same factor. | 2 |
| Squeeze level | None | The line that marks “tight”. Bollinger’s platform has no fixed value. | Lowest 10% of the window |
| Look-ahead | None | How long you wait to judge the move after a squeeze. | 10 bars |
Mind the StdDev input: change it from 2 to 2.5 and every reading grows by a quarter, so old thresholds stop working. Our page on the best Bollinger Band settings covers the trade-offs of each input in more depth.
Reading Bollinger Band Width on a chart
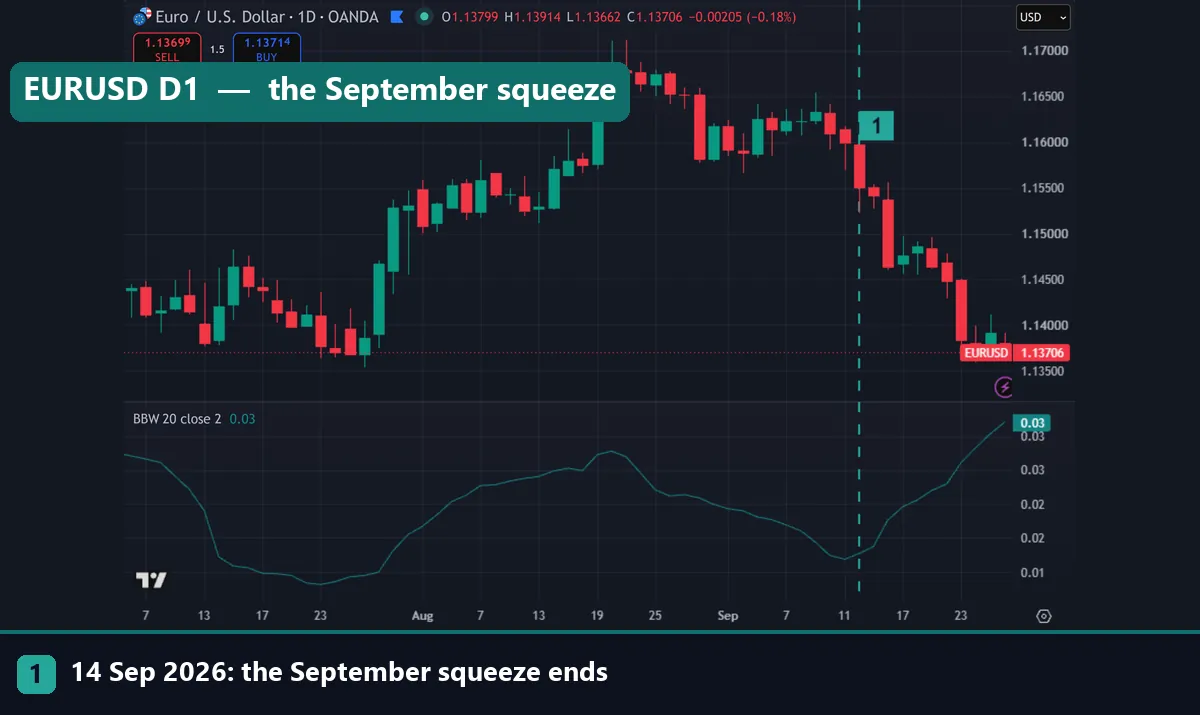
Start with the shape, not the value. Valleys are quiet spells. Peaks show that a move has already happened, because the bands only widen after price swings.
In the EURUSD daily chart above, the line runs low through late July. It then climbs into mid-August, drifts down again into mid-September and turns up hard. The teal marker sits on 14 September 2026, the last bar of a squeeze that ran from 10 to 14 September. The lowest reading in that window was 1.18 in our percent style.
Next, compare the value with the line’s own history. On this pair the daily median over our window was 1.96, and the lowest-10% cut-off was 1.31. So a daily reading under about 1.3 counted as tight for EURUSD.
Also look at the right-hand scale. On this chart TradingView printed the labels 0.03, 0.03, 0.02, 0.02 and 0.01. Those repeats are rounding, not an error.
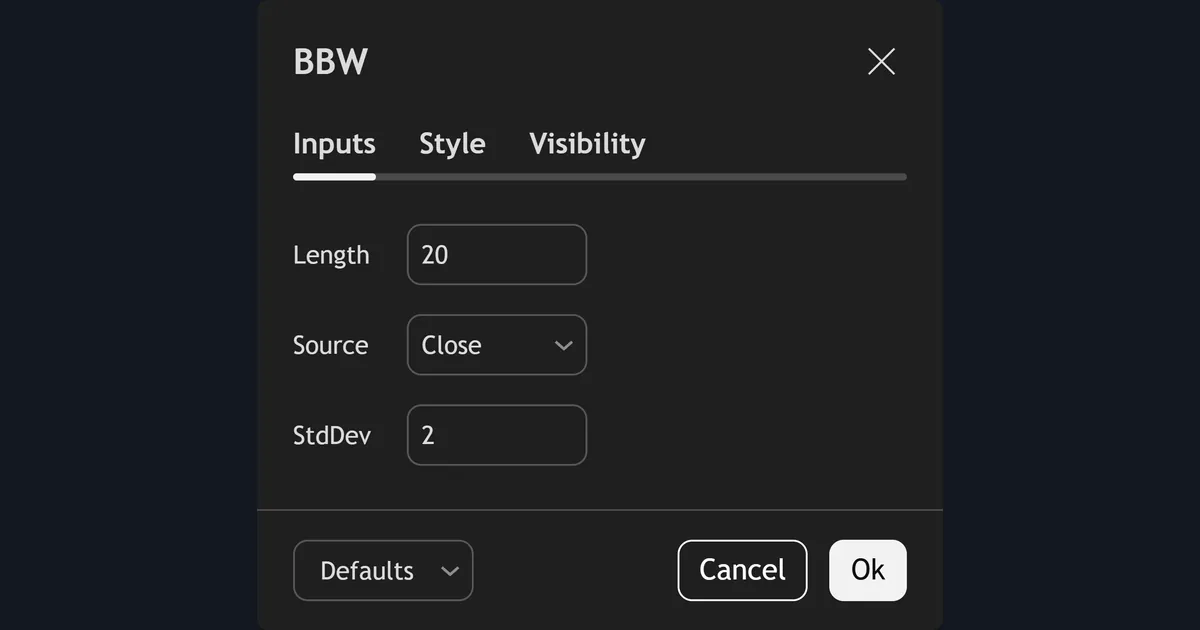
The settings dialog shows the three inputs from the table. The Style tab holds the line colour and the number of decimals shown. Raising the decimals lets you tell 0.0081 from 0.0131.
Worked example: the September 2026 EURUSD squeeze
Here is the case from the top chart, step by step.
- From 10 to 14 September 2026, daily BandWidth stayed inside the lowest 10% of the year. The low point was 1.18, against a yearly median of 1.96.
- After the close on 14 September, price moved as far as 170.2 pips away within the next 10 daily bars.
- By 25 September the width had climbed to 3.04, which the pane showed as 0.03.
For scale, the 14-day ATR on the last daily bar of our window was 48.3 pips. So the September move covered more than three average days of range. Our guide to ATR explains that number in more detail.
Still, the width line did not say “sell”. On the price chart, the move after 14 September went down. Yet the width line would have looked the same if price had rallied. For direction you need price action or a second tool, such as the band touches covered in how to use Bollinger Bands.
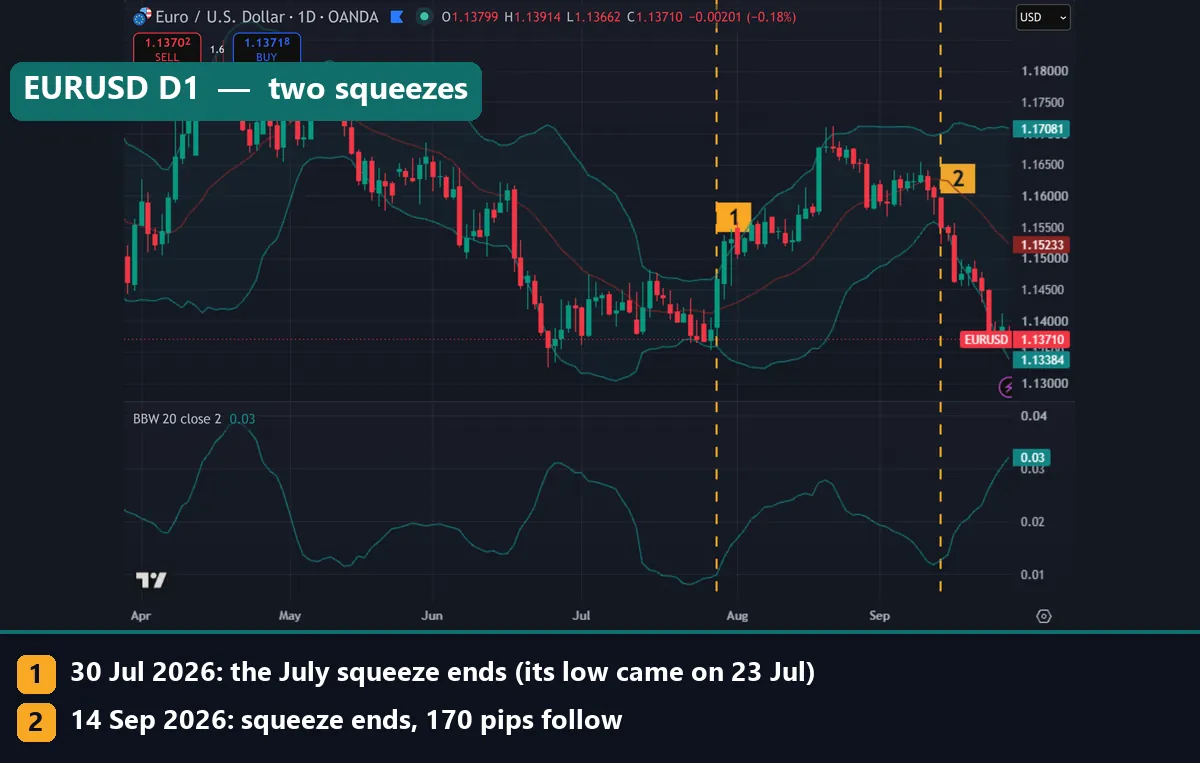
Across the whole daily window we found six squeezes. The moves after them, in pips, were 148.8, 96.3, 182.9, 67.5, 30.0 and 170.2. In short, a squeeze told us a bigger swing was likely, but not how big it would be.
The hourly chart and gold
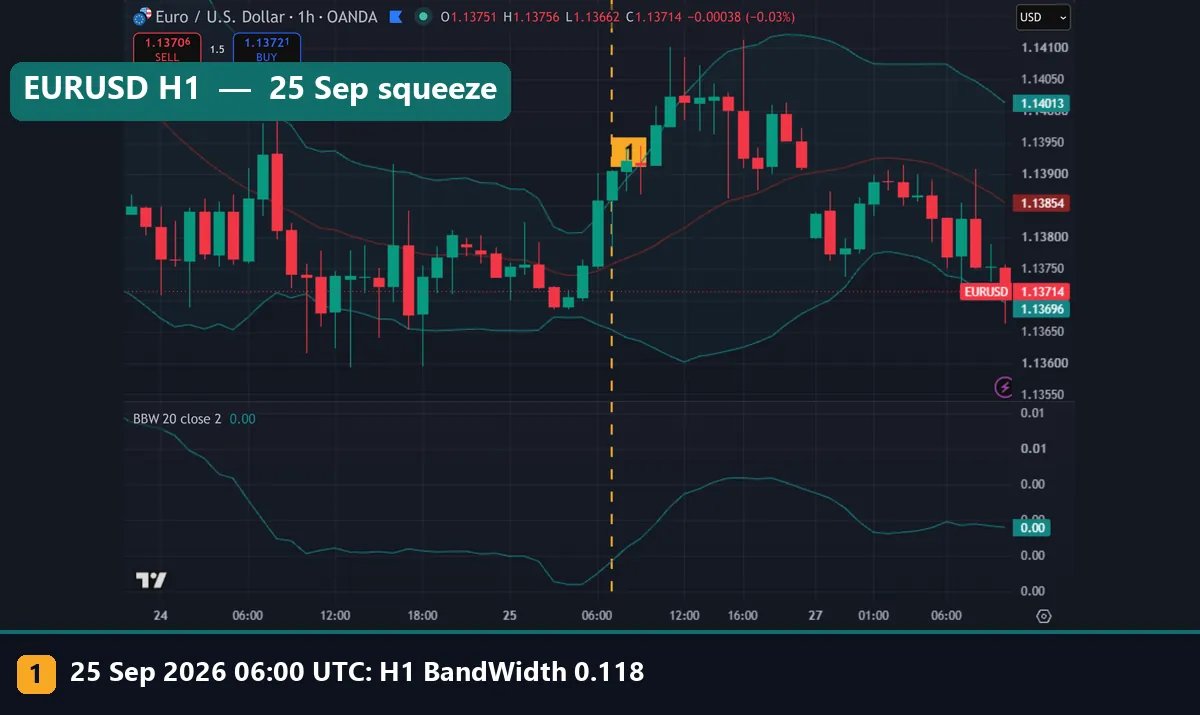
The width line works on any timeframe. On EURUSD H1, our window’s lowest reading was 0.118, and it came in the squeeze from 03:00 to 06:00 UTC on 25 September 2026. The hourly median was 0.29. So hourly values run far smaller than daily ones.
The marker in this chart sits at the end of that squeeze, where the line has already started to turn up. The true low sits a few bars to its left. Then the move from the 06:00 close reached only 16.5 pips within 10 bars. Much of the jump came in the last squeeze bars. Also notice the pane: every label reads 0.00, since two decimals cannot show a value near 0.001.
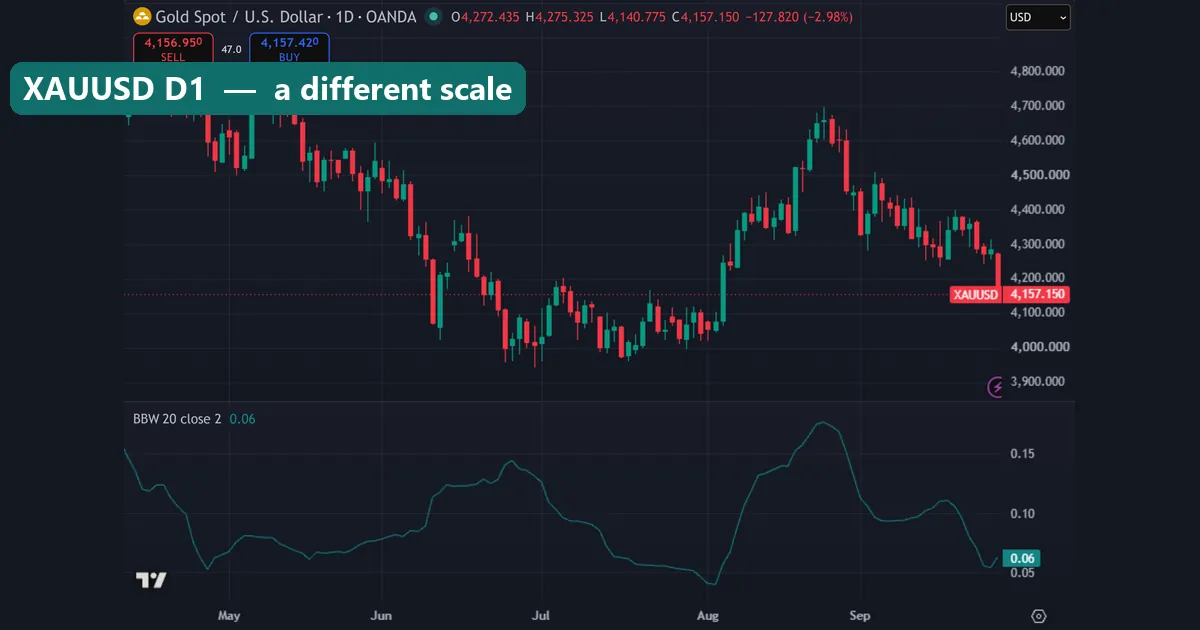
Gold looks very different. On the XAUUSD daily chart, the width line spends the period between roughly 0.05 and above 0.15 on TradingView’s raw scale. That is several times the EURUSD range, where the line stayed under 0.05. The low near the start of August came just before the rally from near 4,100 to above 4,600. Each symbol needs its own history, a point our guide to the most volatile forex pairs makes from another angle.
Download the complete indicator database
Put these concepts on your charts. One email unlocks the full library of 1,380+ indicators with compiled MT4 and MT5 files, plus my TradingView scripts. No paywall, no spam, unsubscribe any time.
Get free access to my indicator database
One email unlocks 1,380+ free MT4, MT5 and TradingView indicators — the complete library. No single-tool download; you get the whole database.
Where it fails
The clearest failure in our data is July 2026. From 14 to 30 July, EURUSD daily BandWidth fell to 0.81, the lowest reading of the whole 299-bar window. If tighter meant bigger, this was the setup of the year.
It was not, at least by our rule. From the close on 30 July, the largest move in the next 10 bars was only 30.0 pips. The reason is visible on the chart: price had already jumped from below 1.14 to above 1.15 in the last days of the squeeze window. By the time the reading left the bottom 10%, the move was mostly over.
Other limits:
- No direction. The line rises on rallies and on drops alike.
- No timing. A squeeze can last two bars or two weeks.
- Lag. The line uses 20 bars of data, so it turns up after the move has begun.
- Rounding. The default two decimals hide the gap between a squeeze and a normal day on currency pairs.
So treat the line as a filter that says “watch this chart”, not as an entry signal.
What a year of readings shows
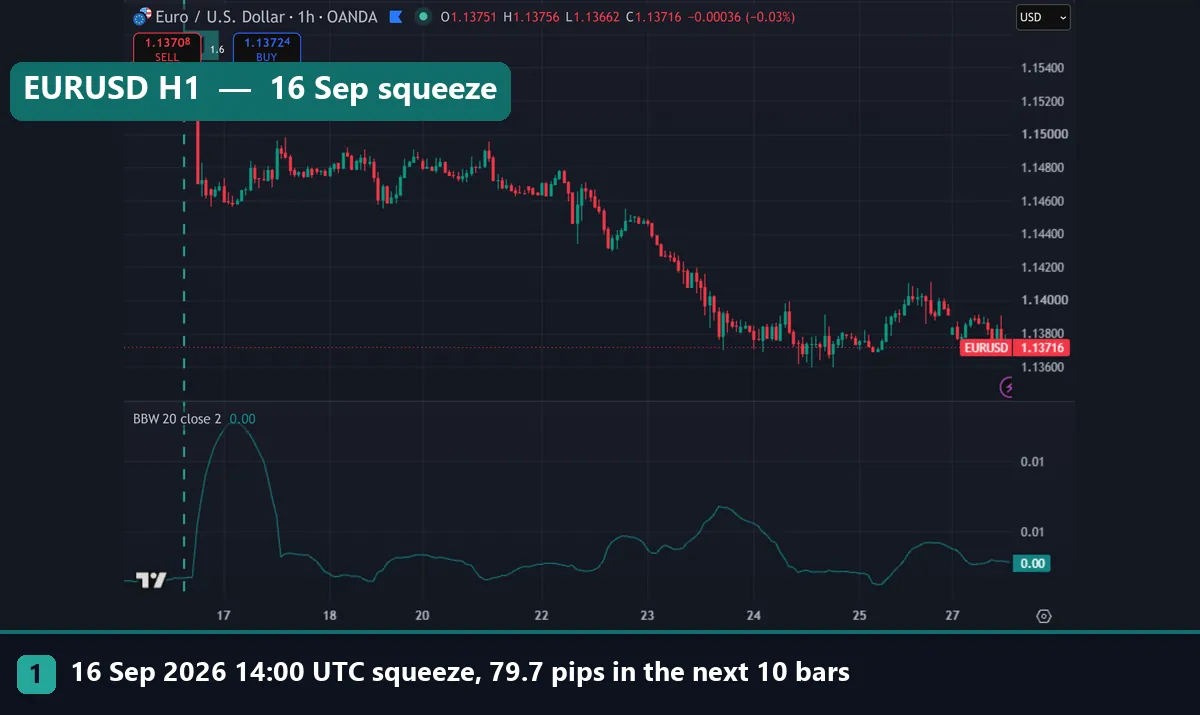
This hourly chart covers 200 bars. The teal marker sits on 16 September 2026 at 14:00 UTC, a one-bar squeeze at 0.164. Soon after, price dropped and the move reached 79.7 pips within the next 10 bars. The width line then shot to its high for the view, after the move, not before it.
By contrast, the hourly squeezes on 18, 21 and 25 September led to moves of just 15.1, 22.0 and 16.5 pips. Only two of the five hourly squeezes produced a large swing.
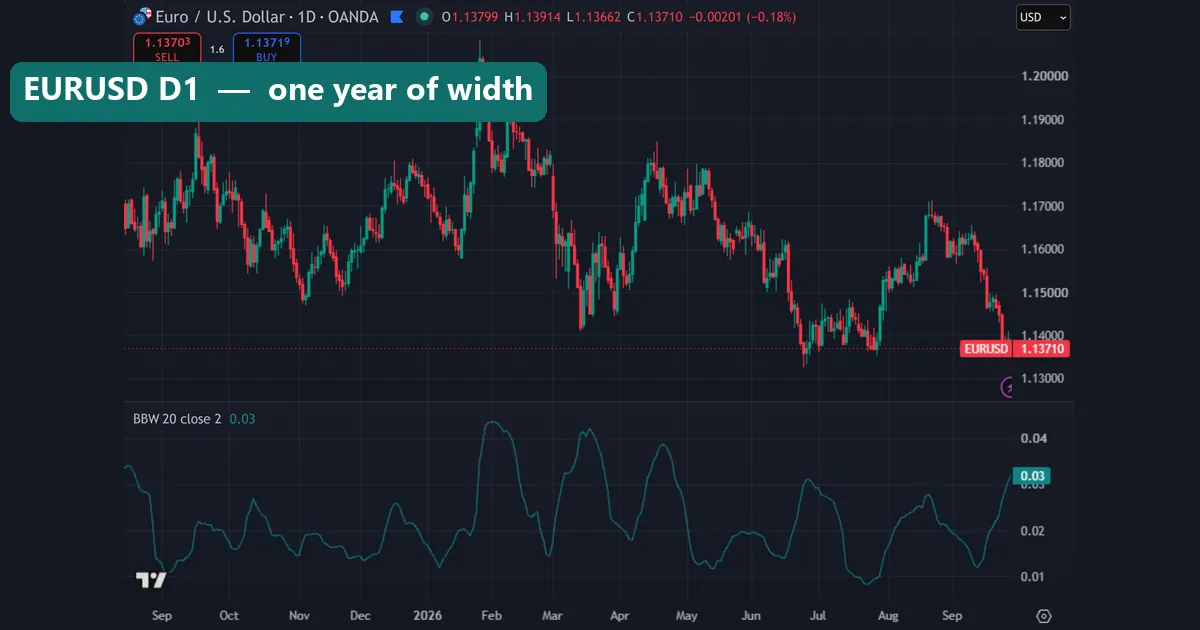
The full-year daily chart puts it all in one frame. The line swings between near 0.01 and just over 0.04, which matches our measured low of 0.81 and high of 4.36. Peaks came in early February, mid-March and late April. The deepest valley sits in late July. What the chart cannot tell you is which valley comes before the big burst.
Common mistakes with Bollinger Band Width
- Mixing up the units. A rule written as “below 4” fires on every bar of a pane that prints 0.04. Check the scale before you copy a threshold.
- Using one squeeze level for every chart. Our EURUSD daily cut-off was 1.31 in percent style, and gold ran several times wider. Set the level from each symbol’s own history.
- Trading the squeeze itself. A low reading says energy is building. It does not say where it goes. Wait for price to break a band or a range first.
- Trusting the default decimals. On a currency pair, 0.0081 and 0.0131 both print as 0.01. Raise the precision in the Style tab.
BandWidth next to ATR and Keltner Channels
ATR measures the average bar range in price terms, such as 48.3 pips. BandWidth measures the spread of closes as a share of price. So ATR suits stop sizing, while BandWidth suits spotting quiet spells. Our guide on using ATR as a stop loss shows the first use.
Many squeeze tools also flag a squeeze when the bands slip inside Keltner Channels. For the difference, read Bollinger Bands vs Keltner Channel. For a quick range check, our forex volatility calculator helps.
Where to go next
On MetaTrader, see our Bollinger Squeeze Basic indicator and the plain Bollinger Bands indicator. Both downloads are compiled MT4 and MT5 files.
To pair the width line with a direction tool, see how to trade Bollinger Bands with RSI. For a sense of which pairs move most, try our guide to forex pair volatility.
For sources, reread Bollinger’s rules, the TradingView help page and the StockCharts article linked above. For the history of the bands, see Bollinger Bands on Wikipedia.
FAQ: Bollinger Band Width
What is a good Bollinger Band Width value?
There is no single good value; compare each symbol with its own history. On EURUSD daily, our lowest-10% cut-off was 1.31 in percent style, or about 0.013 on the TradingView pane.
Why does my TradingView pane show 0.00 or 0.01?
The built-in pane prints the raw fraction with two decimals. On currency pairs the values are tiny, so they round to 0.01 or 0.00. Raise the decimals in the Style tab to see the real change.
Is BandWidth the same as %B?
No. BandWidth measures how wide the bands are. %B shows where price sits inside the bands.
Does a squeeze tell me which way price will break?
No. In our tests the width line looked the same before rallies and drops. You need price action, a band break or a second tool to judge direction.
Which Length and StdDev should I use?
We used the defaults, Length 20 and StdDev 2. If you change them, rebuild your squeeze level, because the scale shifts.
Does it work on the hourly chart?
Yes, the formula is the same on any timeframe. On EURUSD H1 our median was 0.29 and the low was 0.118. Only two of the five hourly squeezes led to a large move.
Can I use it on gold or indices?
Yes, but the scale differs. On XAUUSD daily the line ran several times higher than on EURUSD, so set thresholds per symbol.
Can I trade squeezes on their own?
We would not. In our data, squeeze moves ranged from 30.0 to 182.9 pips, and none came with a direction. Use the line as a filter and manage risk on every trade; results are not guaranteed; past performance is not indicative of future results.
Last updated: 28 September 2026.

About the author
Written by Dominic Walsh, a Forex trader and MT4/MT5 indicator, Expert Advisor and script developer. Every tool on forexmt4systems.com is tested on live charts before release and ships with ready-to-use compiled MT4 (.ex4) and MT5 (.ex5) files. Learn more about the trader and developer behind this site.
How we build, test and correct every tool: Editorial & Testing Policy. Trading carries risk; see the disclaimer.