
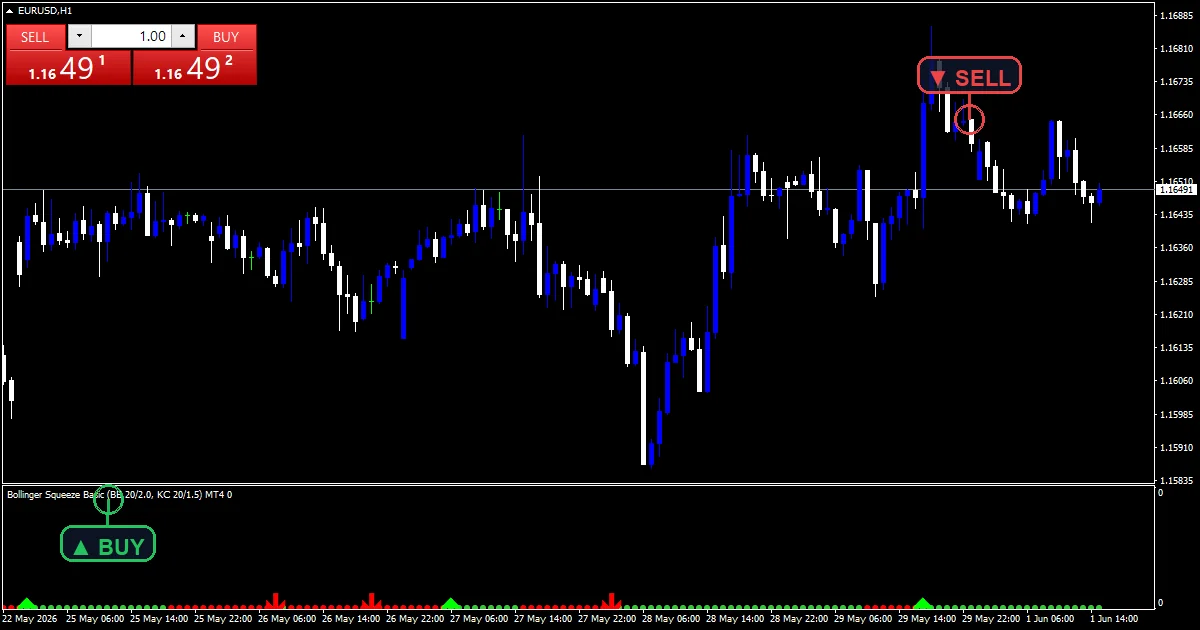
The bollinger squeeze basic indicator watches two envelopes against each other. When the Bollinger Bands fit inside the Keltner Channel, the market has gone quiet. A dot marks that state. When the bands widen back out, an arrow marks the release and points where the close sits.
This build ships as a compiled .ex4 for MT4 and .ex5 for MT5; the screenshots below come from EURUSD H1.
| Platforms | MT4 (.ex4) + MT5 (.ex5) |
|---|---|
| Chart window | Separate window |
| Plots | 4: SqueezeOn, SqueezeOff, BuyRelease, SellRelease |
| Alerts | popup, push notification, email, sound |
| Inputs | 11 |
What gets drawn, and where
Four arrow plots, no lines.
`SqueezeOn` puts a red dot on a quiet bar.
`SqueezeOff` puts a lime green dot when quiet ends.
`BuyRelease` uses arrow 233 in lime.
`SellRelease` uses arrow 234 in red.
Dots and arrows both sit in the pane below price.
- SqueezeOn: arrow, red, width 2, arrow code 159
- SqueezeOff: arrow, lime green, width 2, arrow code 159
- BuyRelease: arrow, lime, width 3, arrow code 233
- SellRelease: arrow, red, width 3, arrow code 234
How a value appears
Two envelopes
Both get built here. `BBPeriod` `20` and `BBDeviation` `2.0` give the bands. `KCPeriod` `20` with `ATRPeriod` `20` and `KCMultiplier` `1.5` give the channel. Standard deviation gets computed in this file rather than fetched.
One comparison
That is all the test is. An upper band under the upper channel, and a lower band over the lower one. Both true at once means this bar sits inside a squeeze.
The release
State change does it. The previous bar was inside and this one is not. Which arrow prints depends on the close against the band middle. Above gives a buy mark, below a sell.
Reading it in practice
A red dot means volatility has fallen, not that price will move.
Long dot runs describe long quiet stretches.
The release arrow is the event worth watching.
Direction comes from the close against the middle band.
A release with no follow-through is common.
The pane tells you nothing about how far a move may run.
Alert channels in this build: popup, push notification, email and sound, one message per closed bar.
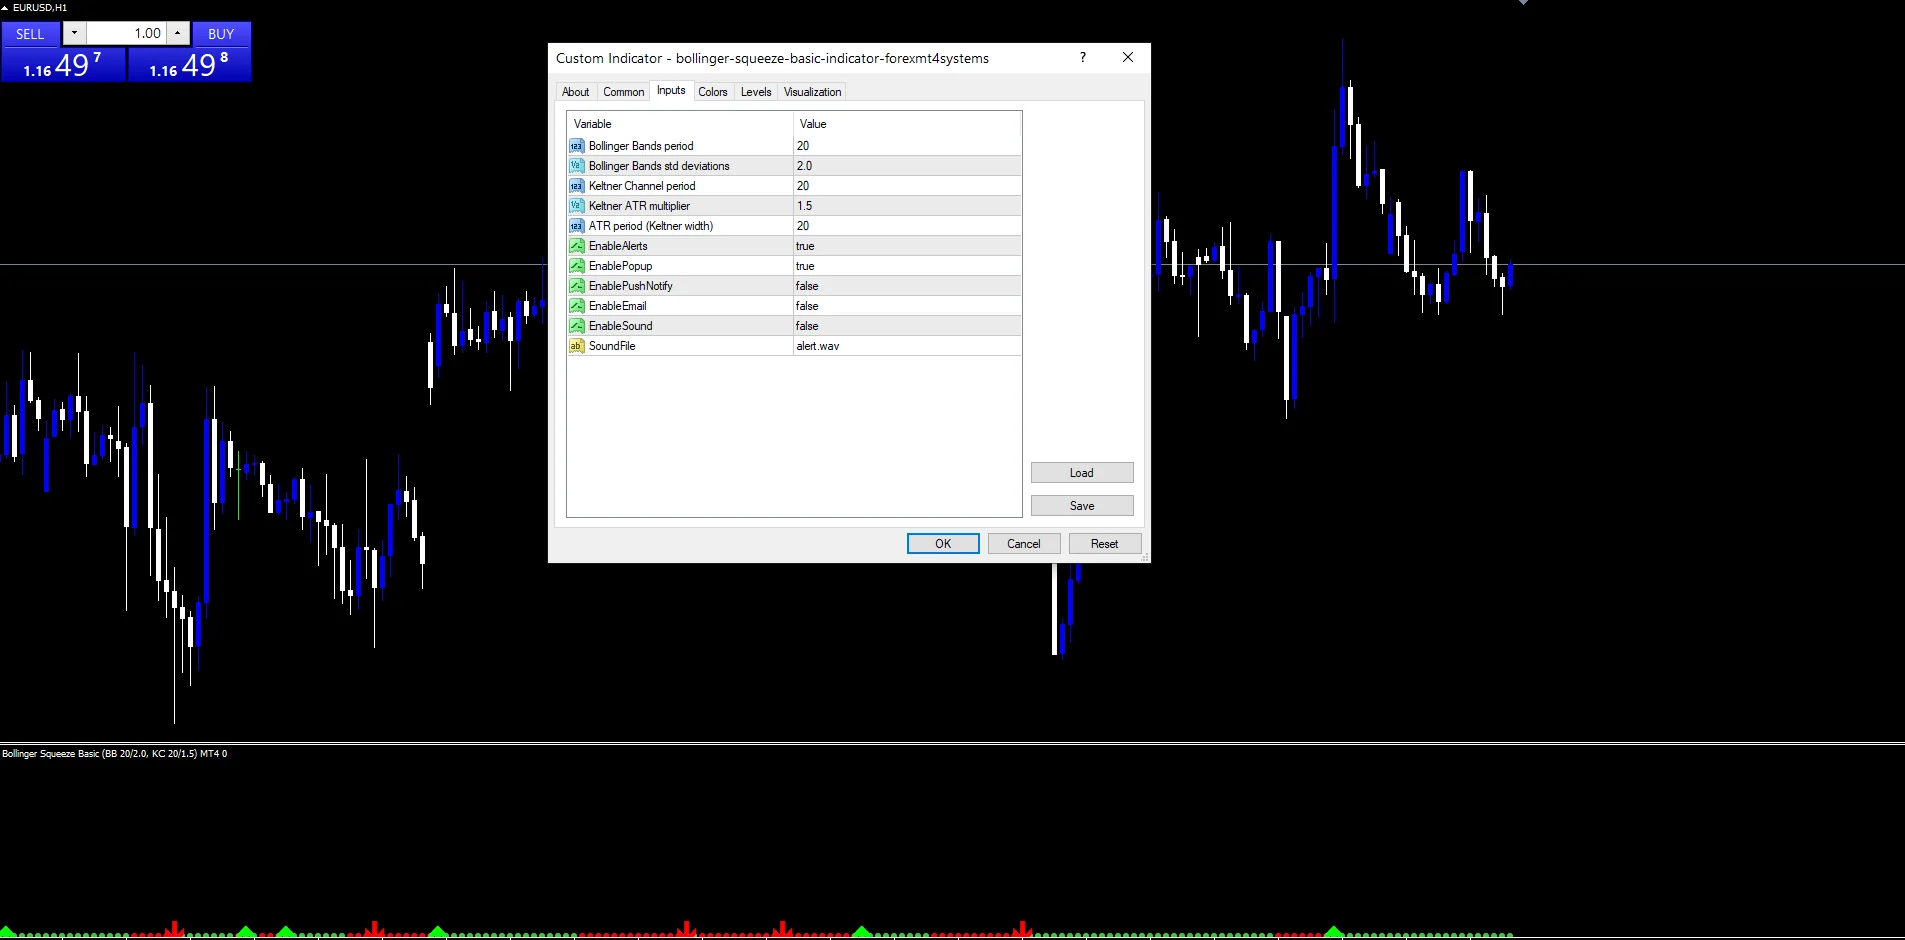
`EnableAlerts` governs the release alerts and arrives true with `EnablePopup`. Use `EnablePushNotify` to reach a phone, `EnableEmail` for mail, or `EnableSound` to play `SoundFile`. Releases report on the closed bar only.
Every Bollinger Squeeze Basic Indicator input
Core settings
| Setting | What it does | Default |
|---|---|---|
BBPeriod |
Bollinger Bands period. Bars in the band average, `20`. | 20 |
BBDeviation |
Bollinger Bands std deviations. Band width in deviations, `2.0`. | 2.0 |
KCPeriod |
Keltner Channel period. Bars in the channel average, `20`. | 20 |
KCMultiplier |
Keltner ATR multiplier. Channel width in ATR, `1.5`. | 1.5 |
ATRPeriod |
ATR period (Keltner width). Bars in the range average, `20`. | 20 |
Alert settings
| Setting | What it does | Default |
|---|---|---|
EnableAlerts |
Master switch, `true`. | on |
EnablePopup |
Box in the terminal, `true`. | on |
EnablePushNotify |
Buzz on a phone, `false`. | off |
EnableEmail |
Mail on a release, `false`. | off |
EnableSound |
Cue on a release, `false`. | off |
SoundFile |
(see inputs panel) | alert.wav |
Which pair, which timeframe
The comparison needs a market that goes quiet and then does not. EURUSD H1 is the reference chart. Squeezes there run a handful of bars. On M5 they form and break inside an hour. On H4 they mark session-long lulls.
Where it breaks down
A squeeze says nothing about which way the release goes.
Both envelopes use twenty bars, so they lag together.
The close against the middle band is a thin direction test.
A slow drift can exit the squeeze without any real move.
Copy the compiled Bollinger Squeeze Basic Indicator file into your MQL4/Indicators folder, and the MT5 build into MQL5/Indicators, then restart the terminal and drag it onto a chart. The step-by-step guide with screenshots is at how to install MT4 and MT5 indicators.
Related on forexmt4systems.com: Bollinger Bands Breakout Plan.
Download the Bollinger Squeeze Basic Indicator for MT4 and MT5
The zip holds the compiled Bollinger Squeeze Basic Indicator build for MT4 and MT5, plus a short README. Compiled files only, no source. Enter your email below and the download link arrives in your inbox.
Download this indicator free
Enter your email and the file is yours. You also get the full MT4 and MT5 library.
FAQ
What does KCMultiplier 1.5 set?
How wide the Keltner Channel sits around its average. The multiplier scales the ATR reading, so `1.5` puts each channel edge one and a half average ranges out. Raising it makes squeezes rarer, because the bands then fit inside more easily.
Why compare BBPeriod against a Keltner Channel?
Because the two measure width differently. Bands react to deviation and the channel reacts to range. When deviation shrinks faster than range, the bands fall inside, and that mismatch is what defines the squeeze.
What separates SqueezeOn from SqueezeOff?
The first marks every bar inside the squeeze. The second marks the single bar where the state ends. So a long red run is normal, but the lime green dot appears once.
How does BuyRelease pick its direction?
By the close against the middle band on the release bar. Above gives the buy mark, below the sell. It is a simple test, and it can point the wrong way when the release bar closes near the middle.
Are results guaranteed?
No. Trading involves risk. Results are not guaranteed; past performance is not indicative of future results. Use the Bollinger Squeeze Basic Indicator as one input. Always backtest before trading live.
Group: this is part of our Price swing collection. Then, truly, browse more Price swing for MetaTrader, or explore every MT4 tool and MT5 tool on the site.
External references
- Learn more about the underlying method in Long squeeze on Wikipedia.
- For wider market background, see Ttm Squeeze at StockCharts ChartSchool.

About the author
Written by Dominic Walsh, a Forex trader and MT4/MT5 indicator, Expert Advisor and script developer. Every tool on forexmt4systems.com is tested on live charts before release and ships with ready-to-use compiled MT4 (.ex4) and MT5 (.ex5) files. Learn more about the trader and developer behind this site.
How we build, test and correct every tool: Editorial & Testing Policy. Trading carries risk; see the disclaimer.