
FAANG stocks are Facebook, Apple, Amazon, Netflix and Google, five large US companies grouped under one acronym. Two of those names have changed since: the Facebook company is now Meta, and Google now sits under a parent called Alphabet. This article settles what the label means and how these shares behaved on our own daily data. In short, all five rose further than the Nasdaq 100 from January 2015 to November 2026, and each one has also lost more than 60% at least once. We do not recommend any of them. They are famous because they won, and that fact shapes every number below.
What FAANG stocks actually are
FAANG is a nickname, not a fund. Wikipedia’s entry on Big Tech credits Jim Cramer with coining FANG in 2013, for Facebook, Amazon, Netflix and Google. The same entry says he added Apple in 2017, and that gave us the extra A.
Two renames confuse new readers. First, the October 2021 post “The Facebook Company Is Now Meta” on Meta’s newsroom introduced the new company brand, so our charts read META. Google changed earlier. Google’s Alphabet announcement on its official blog said in 2015 that Google would become a wholly owned subsidiary of Alphabet. The shares kept the GOOGL and GOOG tickers, and we use GOOGL, the Class A share.
| Letter | Name then | Name now | Our symbol | First bar in our data |
|---|---|---|---|---|
| F | Meta Platforms | NASDAQ:META | 18 May 2012 | |
| A | Apple | Apple | NASDAQ:AAPL | 27 December 2002 |
| A | Amazon | Amazon | NASDAQ:AMZN | 5 January 1999 |
| N | Netflix | Netflix | NASDAQ:NFLX | 27 December 2002 |
| G | Alphabet | NASDAQ:GOOGL | 19 August 2004 |
How the label works: five shares, one yardstick
The acronym has no weights, no rulebook and no rebalancing. So any “FAANG return” depends on the weights the writer chose. We measure each share alone instead, then compare it with the Nasdaq 100. Nasdaq’s Nasdaq-100 index overview describes 100 of the largest non-financial companies listed on its market. Our guide to what indices are and how they get built covers the weighting side.
Every daily move has two parts: one shared with the index and one that belongs to the stock. Correlation measures the shared part. The volatility ratio measures the size of the moves. These are the four formulas we use:
multiple = last close / first close of January 2015fall from peak = close / highest earlier close - 1volatility ratio = st. dev. of stock returns / st. dev. of index returnsdaily range = (high - low) / close
For example, a ratio of 1.92 means META’s daily returns since 2023 varied 1.92 times as much as the index’s returns. A correlation of 0.60 says the two tended to move the same way, but it says nothing about the size of the move.
How we tested
We pulled daily bars from the TradingView web chart on 3 November 2026, and the last bar in each series is 2 November 2026. The symbols were NASDAQ:META, NASDAQ:AAPL, NASDAQ:AMZN, NASDAQ:NFLX and NASDAQ:GOOGL, plus NASDAQ:NDX for the Nasdaq 100, whose first bar is 27 December 2002. The table above gives the other first bars. Our five chart captures use the same daily bars. Three run from late 2021 to early 2023, and two show the last 260 sessions. We drew the two data charts ourselves from those bars.
Every result covers prices only, so it comes before spread, commission, financing and dividends. TradingView adjusts these series for stock splits, so older levels can differ from the quotes people saw at the time. We ran no strategy and placed no trades. Our editorial testing policy explains how we handle data like this.
The parameters behind our numbers
Each figure below rests on one rule and one window. Check the window before you compare two numbers.
| Measure | Rule | Window |
|---|---|---|
| Price multiple | Last close divided by the first close of the window | January 2015 to 2 November 2026 |
| Calendar 2022 change | Last close of 2022 against last close of 2021 | 2022 |
| Worst fall | Largest drop from a closing high to a later close | First bar to 2 November 2026 |
| Volatility ratio | Spread of daily returns, stock against index | Since 1 January 2023 |
| Correlation | Daily returns, stock against index | Since 1 January 2023 |
| Median daily range | Median of (high – low) / close | Last 750 sessions |
| Biggest one-day fall | Close to close | The bars in each chart view |
Reading a FAANG chart: gaps and flags
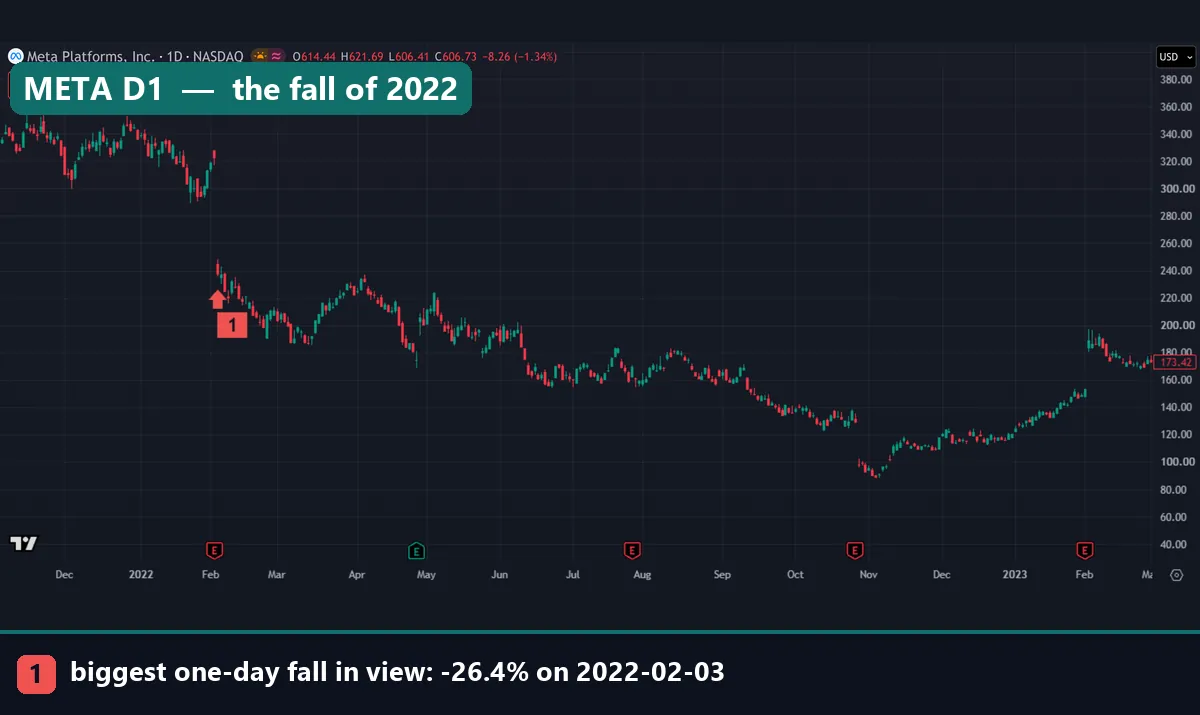
Start with the META chart above. Marker 1 sits under 3 February 2022, the biggest one-day fall in that view at -26.4%. The axis shows the jump: closes above 320 the day before, then a close below 240. The regular session has no candles in that hole.
Next, read the letters along the bottom. TradingView prints E for an earnings report, D for a dividend and S for a stock split. An E flag sits right beside the META gap, and another sits beside the late October gap, which ran from about 130 to about 100. That timing points to earnings, but a chart alone cannot prove the cause. Our guide to the main types of gaps covers the shapes.
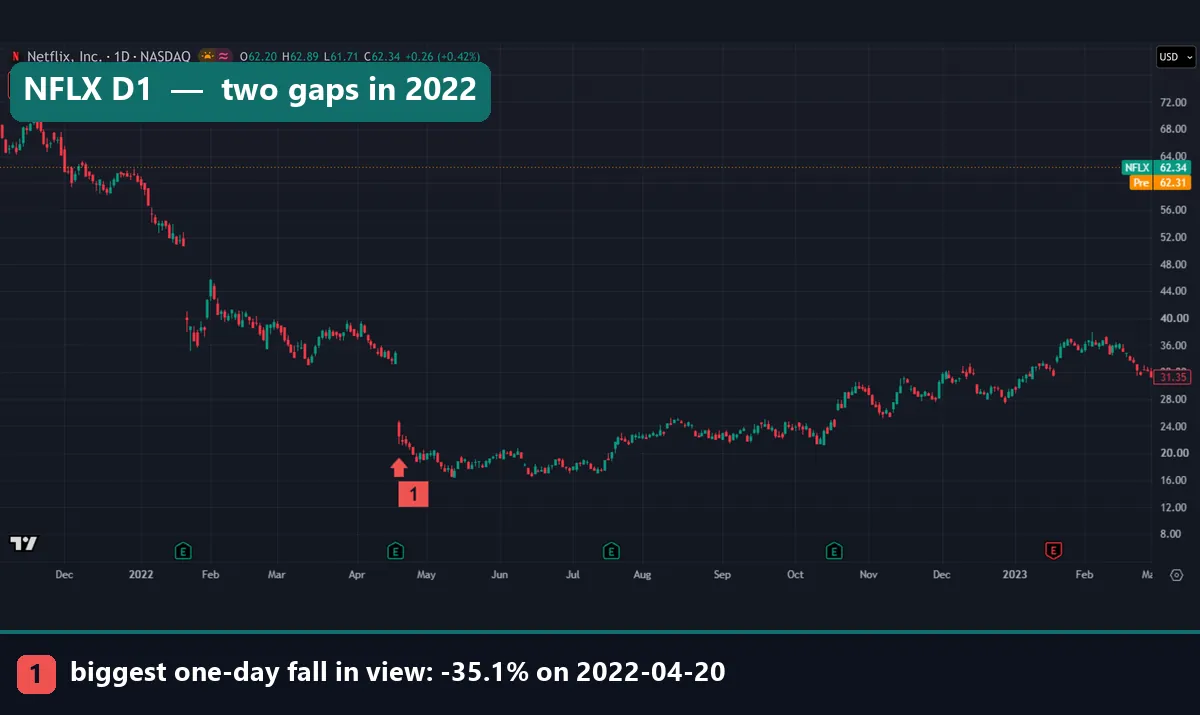
Netflix gapped twice in the first four months of 2022. The January gap runs from about 50 to about 40. Then marker 1 shows 20 April 2022, down 35.1% in a day, from about 35 to about 23. That is the third largest move in our Netflix data, after +42.2% on 24 January 2013 and -40.9% on 15 October 2004.
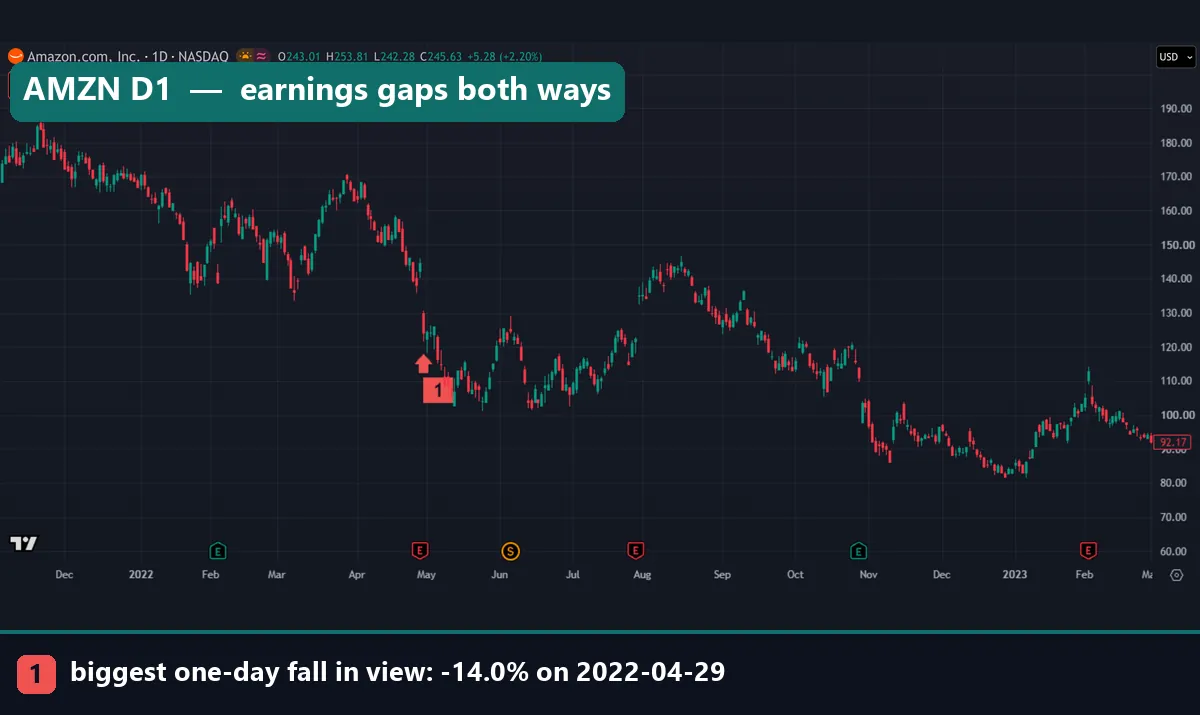
Amazon shows that gaps run both ways. Its marker sits under 29 April 2022, down 14.0%, from about 145 to about 125. Yet a gap up follows the February E flag, and another follows the late July flag. Also find the S flag in June. That marks a stock split, and the line does not jump because TradingView adjusts prices.
Worked example: META in 2022
Here is one stock followed through one year, using only our measured figures.
- The year. META fell 64.2% in calendar 2022, and the Nasdaq 100 fell 33.0%. That is nearly twice the index’s loss.
- Two days. The closes of 3 February (-26.4%) and 27 October (-24.6%) compound like this: 0.736 x 0.754 = 0.555. So those two sessions alone took off 44.5%, more than the index lost all year.
- The whole fall. From the close of 7 September 2021 to the low close of 3 November 2022, META lost 76.7%. Getting back needs 1 / (1 – 0.767) = 4.29 times the low, a rise of 329%.
- The long view. From January 2015 to November 2026 META still made 7.7x, against 6.6x for the index. A holder for that whole stretch ended ahead of the index on price, after sitting through that fall.
- The size of a normal day. META’s median daily range is 2.31%, and the index’s is 1.15%. For the same cash risk on a stop one range wide, 1.15 / 2.31 means roughly half the position.
That last step is plain position sizing. Our drawdown calculator runs the recovery sum for any percentage.
All five against the Nasdaq 100
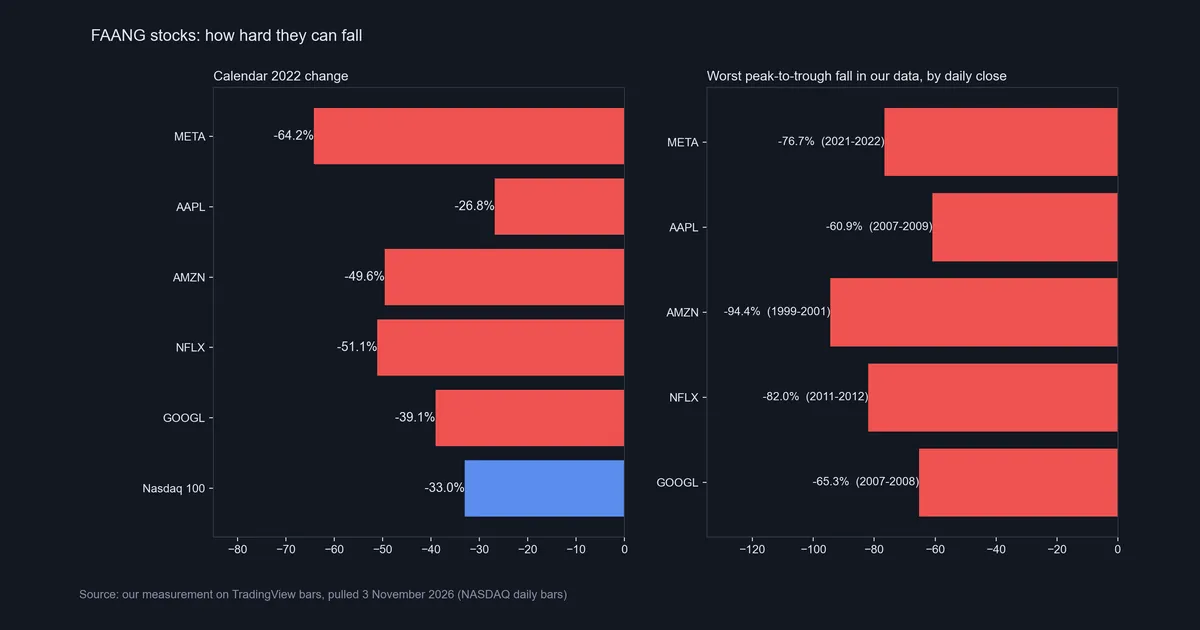
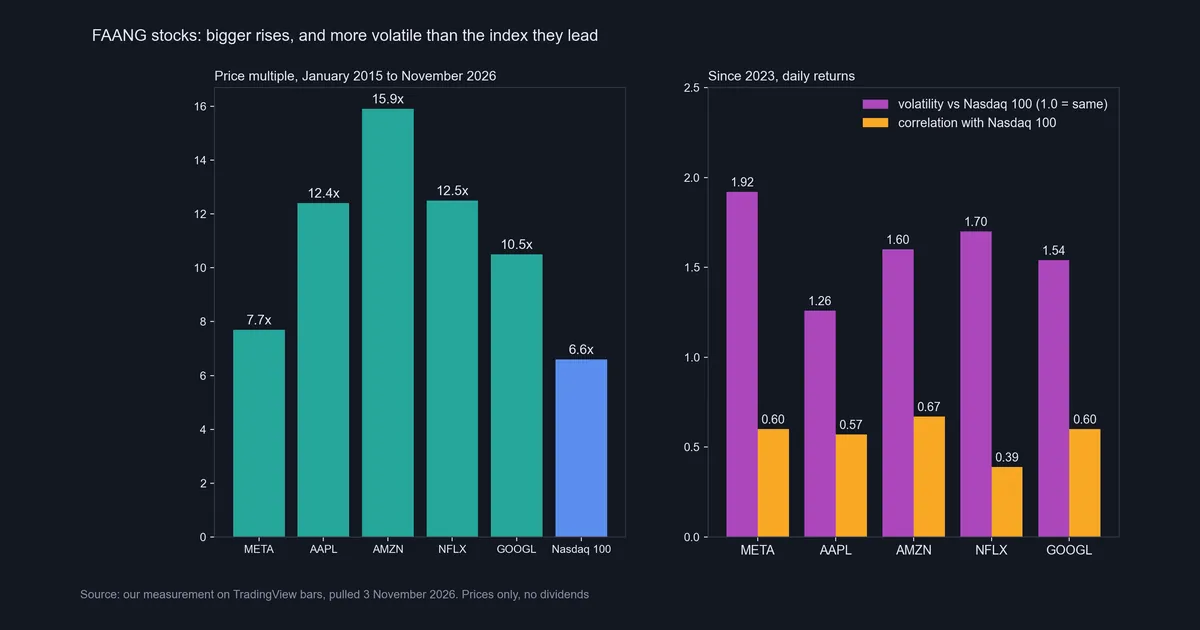
Every stock beat the index’s 6.6x multiple over our window, and META came closest. In 2022, four of the five fell further than the index, and only Apple fell less.
| Stock | Multiple since 2015 | 2022 | Worst fall by close | Years | Multiple needed to recover |
|---|---|---|---|---|---|
| AMZN | 15.9x | -49.6% | -94.4% | 1999-2001 | 17.9x |
| NFLX | 12.5x | -51.1% | -82.0% | 2011-2012 | 5.6x |
| AAPL | 12.4x | -26.8% | -60.9% | 2007-2009 | 2.6x |
| GOOGL | 10.5x | -39.1% | -65.3% | 2007-2008 | 2.9x |
| META | 7.7x | -64.2% | -76.7% | 2021-2022 | 4.3x |
| Nasdaq 100 | 6.6x | -33.0% | Not measured |
Recovering from Amazon’s worst fall needed 17.9x, more than the 15.9x it made from 2015 to 2026. The second chart adds the daily picture since 2023. Volatility against the index runs from 1.26x for Apple to 1.92x for META. Correlation runs from 0.39 for Netflix to 0.67 for Amazon, so even the closest stock is far from a copy of the index. We measured each stock against the index, not against each other.
Why a forex or index trader might care
These shares are not a forex market, and we measured no link to any currency pair, so we claim none. The case for caring is narrow. If you trade a Nasdaq 100 CFD or future, your index is built from large Nasdaq companies of this kind. So their earnings dates belong on your calendar. Our guide to Nasdaq 100 futures on TradingView covers the symbols, and our CFD guide explains that other route.
Shares also have a daily close and an open, unlike major pairs on a weekday. New prices appear while the regular session is shut, and pre-market trading shows some of that. Our comparison of forex and stocks for day trading covers the rest.
Download the complete indicator database
Put these concepts on your charts. One email unlocks the full library of 1,380+ indicators with compiled MT4 and MT5 files, plus my TradingView scripts. No paywall, no spam, unsubscribe any time.
Get free access to my indicator database
One email unlocks 1,380+ free MT4, MT5 and TradingView indicators — the complete library. No single-tool download; you get the whole database.
Where it fails: the survivorship problem
Survivorship is the headline limit of every table on this page. These five carry the label because they won, so a list of their gains starts with the answer. The acronym came after early success, not before it. Other large companies of that era never joined any acronym, and our data cannot show them. So read 15.9x as a fact about Amazon’s past, not as the likely result of buying a famous share. Our note on backtesting mistakes covers the same trap.
Our start date has a similar flaw. We chose January 2015 after seeing the outcome, and other dates could tell a different story.
Data limits matter too. AAPL, NFLX and NDX start on 27 December 2002 in our file, and AMZN starts on 5 January 1999. So “worst fall in our data” does not mean worst ever. We also did not measure the index’s own worst fall.
Prices alone miss things in both directions. The D flags mark dividends we did not add back, so payers look worse than a total return would show. But we also counted no trading costs, and those pull results down.
Finally, volatility and correlation come from one stretch since 2023, and both can shift. Our captures also show the biggest fall in each view, not a typical day. A median range of 2.31% describes an ordinary META session far better than -26.4% does.
The latest falls: Apple and Alphabet
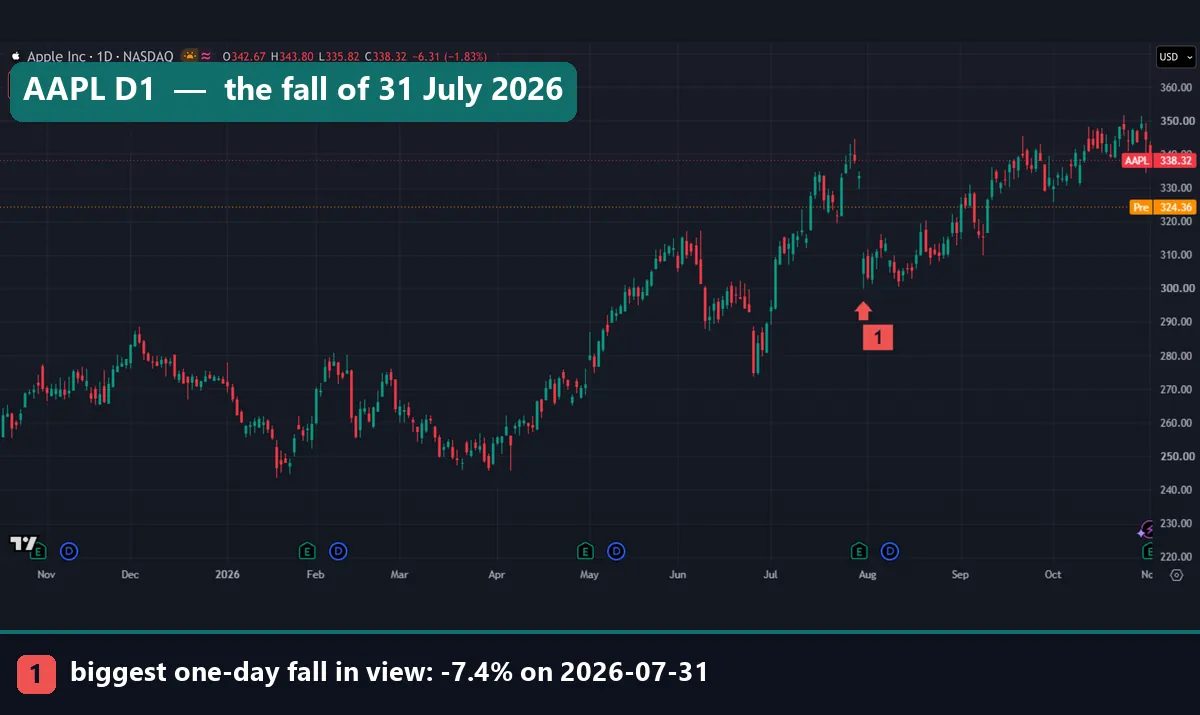
The Apple chart covers the last 260 sessions. Marker 1 sits under 31 July 2026, down 7.4%, the biggest one-day fall in that view. On the axis, price drops from about 330 to about 310, and an E flag sits beside it. Price then climbed back to near 350 by late October. So even the group’s mildest stock can gap hard.
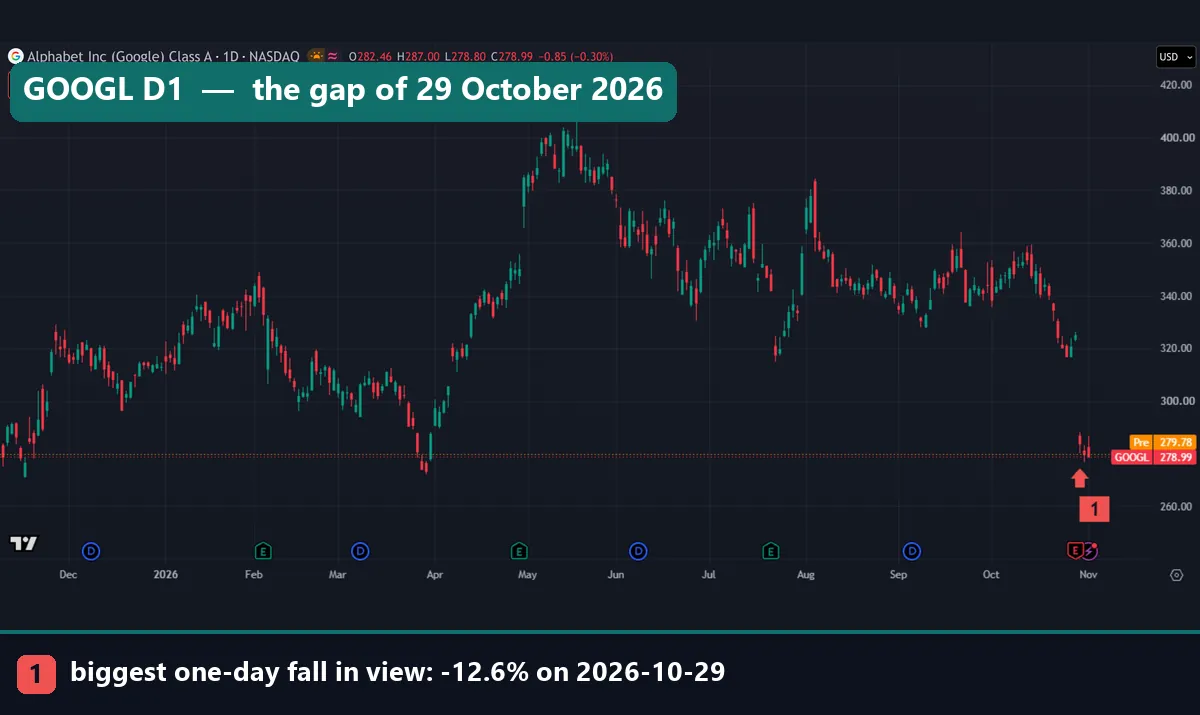
Alphabet’s fall is fresher, and you can see it at the far right of the chart. On 28 October 2026 GOOGL closed at 324.89. The next day it opened at 286.88, which is 11.7% lower, and closed at 283.82, down 12.6%. That candle sits well below the one before it, with empty space between them. It is the biggest one-day fall in our GOOGL series, which starts on 19 August 2004.
The 2 November close was 278.99, and the highest close in this view was 402.62 on 13 May 2026. That makes a fall of 30.7%, past the 10% to 20% band of a market correction. The day’s high was only 288.33, so a sell stop anywhere from there up to 324.89 had no regular-session trade at its level.
Common mistakes with FAANG stocks
Reading a multiple as a forecast. AMZN’s 15.9x describes one stretch of time. The same stock lost 94.4% in an earlier one.
Treating the five as one trade. Netflix’s correlation with the index is 0.39, while Amazon’s is 0.67. Calendar 2022 ran from -26.8% to -64.2% across the group.
Trusting a stop through an earnings report. A stop-loss limits a loss only while price trades near it. After a gap, the fill comes near the new price, and the gaps above show how far that can be.
Sizing a share like an index. META’s median daily range is twice the index’s. Measure the range first, for instance with ATR, and then set the position.
Where to go next
Read what drawdown means in trading for the logic behind the worst-fall column. Then go back to our guide to indices to see the Nasdaq 100 beside other benchmarks. Our market correction guide explains the 10% and 20% thresholds.
FAQ about FAANG stocks
What does FAANG stand for?
It stands for Facebook, Apple, Amazon, Netflix and Google. Today the first company is Meta, and the listed parent of Google is Alphabet.
Who coined the term FAANG?
Wikipedia’s Big Tech entry credits Jim Cramer with FANG in 2013 and with adding Apple in 2017. It also says his RealMoney.com colleague Bob Lang pointed out the word’s double meaning.
Is FAANG an index or a fund?
The acronym itself is neither. It has no weights and no rulebook, so there is no single FAANG price to chart. Some index and fund products use similar names, so read their holdings.
Which FAANG stock rose the most since 2015?
In our data AMZN did, at 15.9x from January 2015 to November 2026. NFLX made 12.5x, AAPL 12.4x, GOOGL 10.5x and META 7.7x, against 6.6x for the Nasdaq 100. These are prices only, with no dividends or costs.
Which FAANG stock fell the most in 2022?
META fell the most, at 64.2%. NFLX lost 51.1%, AMZN 49.6%, GOOGL 39.1% and AAPL 26.8%. The Nasdaq 100 lost 33.0%, so only Apple fell less than the index that year.
Are Microsoft and Nvidia part of FAANG?
No. According to the same Wikipedia entry, Cramer later suggested MAMAA, which swaps Netflix for Microsoft. The newer Magnificent Seven label adds Nvidia and Tesla to Alphabet, Amazon, Apple, Meta and Microsoft, and it leaves Netflix out.
Can I trade FAANG stocks on MetaTrader or TradingView?
TradingView charts all five, and that is where our data comes from. On MetaTrader it depends on your broker, because some list shares as CFDs and some do not. So check the symbol list in your terminal and read the contract terms.
Are FAANG stocks a safe long-term holding?
We cannot call them safe. Each one lost more than 60% at some point in our data, and AMZN lost 94.4%. Survivors also flatter any backward-looking table. These figures describe the past only, so results are not guaranteed; past performance is not indicative of future results.
Last updated: 3 November 2026.

About the author
Written by Dominic Walsh, a Forex trader and MT4/MT5 indicator, Expert Advisor and script developer. Every tool on forexmt4systems.com is tested on live charts before release and ships with ready-to-use compiled MT4 (.ex4) and MT5 (.ex5) files. Learn more about the trader and developer behind this site.
How we build, test and correct every tool: Editorial & Testing Policy. Trading carries risk; see the disclaimer.