
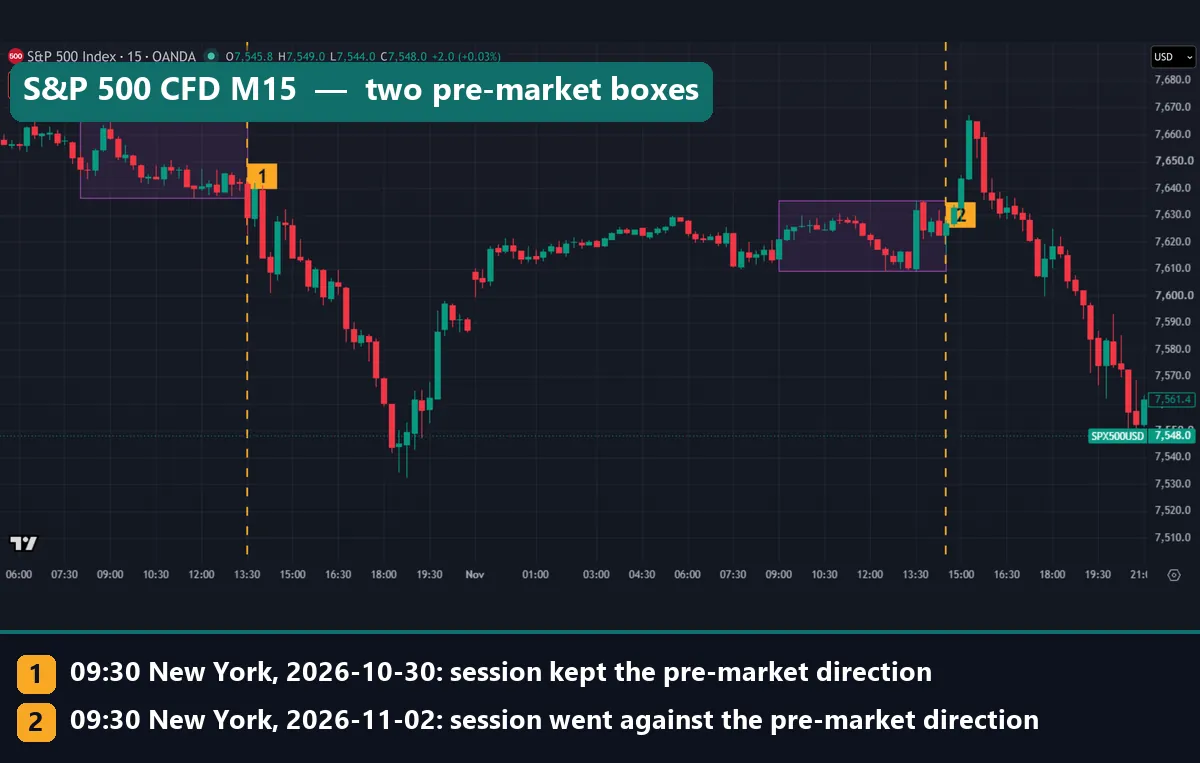
Pre market trading is the buying and selling that happens before the regular US stock session opens at 09:30 New York time. This guide settles two questions. Who can actually trade in that window, and does it tell you anything about the day ahead? To find out, we measured 231 New York weekdays on three US index CFDs. In short, it gives you a range to watch, but it gave us no direction. Below, purple boxes mark the 04:00 to 09:30 range and gold lines mark the 09:30 open.
What pre market trading actually is
Regular hours for US stocks run from 09:30 to 16:00 Eastern Time. That definition comes from the SEC’s extended-hours bulletin on Investor.gov. Trading before that window is the pre-market, and trading after it is the after-hours session. The SEC groups both under one name: extended-hours trading.
The start time depends on the venue. Nasdaq’s market activity page lists pre-market trading from 04:00 to 09:30. The NYSE hours and calendars page shows more detail. NYSE Arca Equities runs an early session from 04:00, while NYSE American starts at 07:00. NYSE Tape A has no early session at all, so orders entered from 06:30 wait for the 09:30 opening auction.
So one clock does not fit every stock or every broker. The SEC tells investors to ask their broker if and when these sessions are available.
Why liquidity is thin before the open
Fewer people trade before the open than during the session, and that drives most of the risk. The SEC bulletin says there is generally less trading interest and less price competition in extended hours. That can raise costs and make orders harder to fill. Some stocks may not trade at all.
Three practical points follow. First, quote spreads tend to be wider, and sometimes there are no quotes. Our guide to why spreads widen covers the same effect in forex. Second, many brokers accept only limit orders in these hours, so an order can sit unfilled if price moves away. Third, these trading systems are not linked, so two venues can show different prices at the same moment.
The bulletin also warns that many extended-hours traders are professionals with more information than individual investors. For the wider idea, see our guide to liquidity in trading.
How it works: stocks, futures, CFDs and the gap
People use one word for several different things, so split them first. Only the first three below can trade before 09:30.
- Stocks. Real shares trade on the venues above, in thin conditions. The SEC warns that these prices may not match the price at the regular open.
- Index futures. A future is an agreement to buy or sell at a later date, at a price fixed now, and it generally trades through an exchange, as the CFTC’s basics of futures trading explains. Index futures keep trading while the cash market is shut. See our guides to Dow Jones futures and Nasdaq 100 futures.
- CFDs. A CFD is a contract on a price, not the index and not an index fund. Our guide to what CFDs are covers the mechanics.
- The cash index. It does not trade before 09:30, and its chart has no bars outside the session.
Three small sums then describe a morning.
pre-market range = highest high - lowest low, 04:00 to 09:30pre-market move = 09:30 open - 04:00 openopening gap % = (cash open - previous cash close) / previous cash close x 100
While the cash market is shut, news and overseas trading keep moving the products that stay open. Then, at 09:30, the cash index prints its first value of the day. The distance from yesterday’s close is the opening gap, and our guide to types of gaps covers the main kinds. So the gap is the night’s move, seen on a chart that cannot show the night.
How we tested
We pulled 15-minute bars from the TradingView web chart on 3 November 2026. The symbols were OANDA:SPX500USD, OANDA:NAS100USD and OANDA:US30USD, which we call the S&P 500, Nasdaq 100 and Dow CFDs. The window holds 231 New York weekdays, from December 2025 to November 2026. For the cash index we used SP:SPX: the last 750 daily bars for gaps, plus 15-minute bars for one picture. Our general method sits in our editorial testing policy.
These CFDs stand in for index futures and for stock pre-market trading, because they trade nearly 24 hours. That is a real limit. The cash index does not trade before 09:30, and a single stock’s pre-market behaves differently. We also placed no trades and counted no costs.
One warning: intraday charts show UTC on the time axis. New York 09:30 was 13:30 UTC until 1 November 2026, then 14:30 UTC. That is why the two gold lines in the first chart sit at different axis times. So do not read clock times off the axis as New York time.
The parameters behind our numbers
These are the exact definitions we used. Whatever tool draws your box, check that its times match New York and not your broker’s server clock.
| Parameter | Value in our test | Why it matters |
|---|---|---|
| Pre-market window | 04:00 to 09:30 New York | Matches Nasdaq’s stated hours |
| Regular session | 09:30 to 16:00 New York | The SEC’s regular hours |
| Bar size | 15 minutes | Sets how finely we see highs and lows |
| Same direction | Session close minus 09:30 open has the same sign as the pre-market move | This is the coin-flip test below |
| Big pre-market move | Top quarter of absolute moves: S&P 0.322%, Nasdaq 0.481%, Dow 0.433% | Only 58 days each, so a small sample |
| Level broken | Session traded past the pre-market high or low | Says nothing about what happened next |
| First 30 minutes | Range from 09:30 to 10:00 as a share of the session range | Shows how much of the day comes early |
| Cash gap | SP:SPX open against the previous close, last 750 days | Measured on the index, not the CFD |
Reading the pre-market range on a chart
Start with the box, then ask two questions. Which way did price travel inside it, and what did the session do to its edges? The Nasdaq chart answers both.
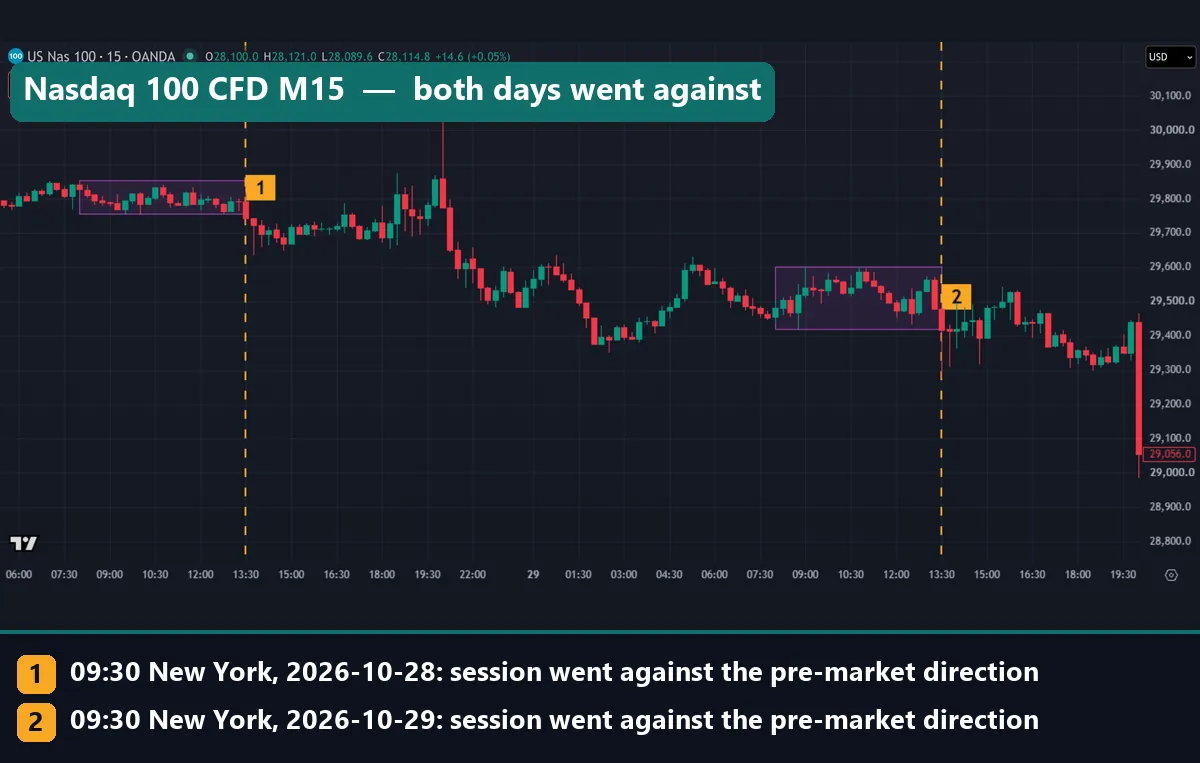
On 28 October the box ran from 29,755.6 to 29,854.2. Price fell 47.8 points from the 04:00 open to the 09:30 open. The session then rose 64.3 points, against the pre-market, and traded through both edges. On 29 October the pre-market rose 23.8 points and the session fell 40.2. The high of 29,602.6 held, but the low of 29,419.8 broke. The long red bar at the far right starts at the 16:00 close, so it sits outside our session window.
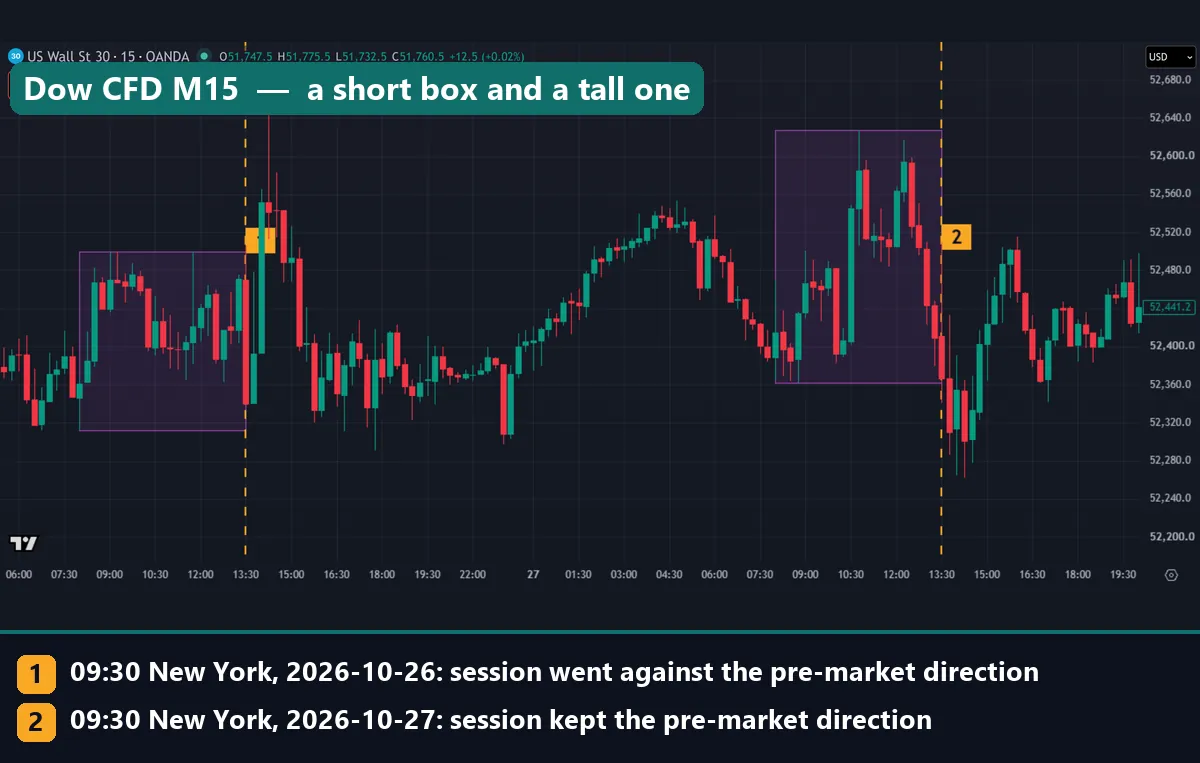
Now look at the Dow chart, which shows how much box height can vary. On 26 October the box spanned 187.5 points, the pre-market rose 124.0 and the session fell 80.7, breaking both edges. On 27 October the box ran from 52,361.5 to 52,627.0. At 265.5 points it beat that whole session, which spanned 254.2. That is unusual, because the median Dow ratio of pre-market range to session range is 0.56.
Worked example: two S&P 500 mornings
Go back to the first chart. It holds two sessions on the S&P 500 CFD, one on each side of the US clock change. All figures below are index points.
| Measure | 30 October 2026 | 2 November 2026 |
|---|---|---|
| Pre-market low to high | 7,636.6 to 7,666.4 | 7,609.4 to 7,635.6 |
| Pre-market range | 29.8 | 26.2 |
| 04:00 open to 09:30 open | 7,651.4 to 7,641.6 | 7,613.8 to 7,622.8 |
| Pre-market move | -9.8 | +9.0 |
| Session low to high | 7,532.2 to 7,642.6 | 7,547.2 to 7,667.3 |
| Session range | 110.4 | 120.1 |
| Session close | 7,586.7 | 7,552.2 |
| Session move | -54.9 | -70.6 |
| Same direction? | Yes | No |
| Edges broken | Low only | Both |
On 30 October the pre-market fell 9.8 points, and the session fell another 54.9. The high held too, so the box looked like a ceiling. Then came 2 November. The pre-market rose 9.0 points, yet the session fell 70.6. It also ran through both edges: 31.7 points past the high and 62.2 past the low.
The pre-market range came to 27% of the session range on the first day and 22% on the second, both well below the 0.52 median. So a calm morning did not mean a calm day. Of course, two days prove nothing, and that is why we counted all 231.
What 231 days showed
The session went the same way as the pre-market on 50.0% of days on the S&P, 47.6% on the Nasdaq and 49.8% on the Dow. That is a coin flip. Big moves did not rescue it. After the top quarter of pre-market moves, the figures were 46.6%, 44.8% and 63.8%. Those are three different answers on 58 days each, so do not build a rule on the Dow figure.
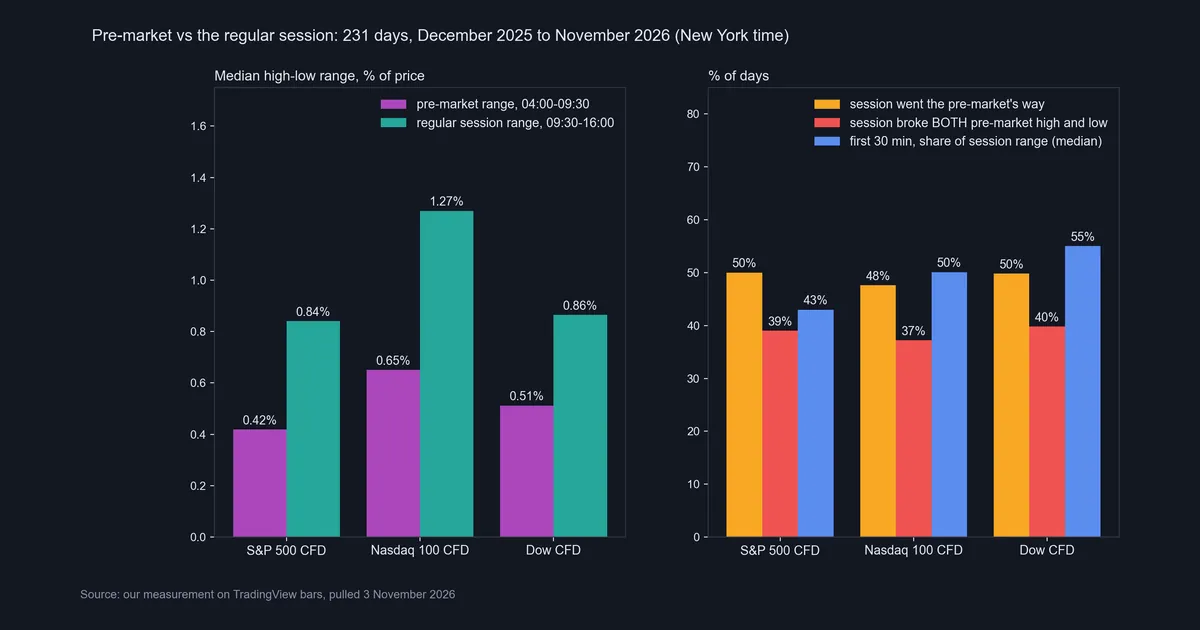
Levels got run through most of the time. On the S&P the session broke the pre-market high on 68.4% of days and the low on 68.4%. It broke both on 39.0% and neither on just 2.2%. Meanwhile, the pre-market range came to about half the session’s range, with median ratios of 0.52, 0.54 and 0.56.
| Measure | S&P 500 CFD | Nasdaq 100 CFD | Dow CFD |
|---|---|---|---|
| Median pre-market range | 0.419% | 0.651% | 0.512% |
| Median session range | 0.841% | 1.27% | 0.865% |
| Session went the same way | 50.0% | 47.6% | 49.8% |
| Same way after a big move (58 days) | 46.6% | 44.8% | 63.8% |
| Broke pre-market high | 68.4% | 67.1% | 69.7% |
| Broke pre-market low | 68.4% | 68.0% | 69.3% |
| Broke both | 39.0% | 37.2% | 39.8% |
| Broke neither | 2.2% | 2.2% | 0.9% |
When the index CFDs actually move
The next chart shows where the range lives. On the S&P the median 15-minute range was 0.098% at 09:15, then 0.253% at 09:30. The Nasdaq went from 0.158% to 0.484%, and the Dow from 0.138% to 0.382%. After that the bars shrink through the day. The first 30 minutes printed a median 43% of the whole session range on the S&P, 50% on the Nasdaq and 55% on the Dow.
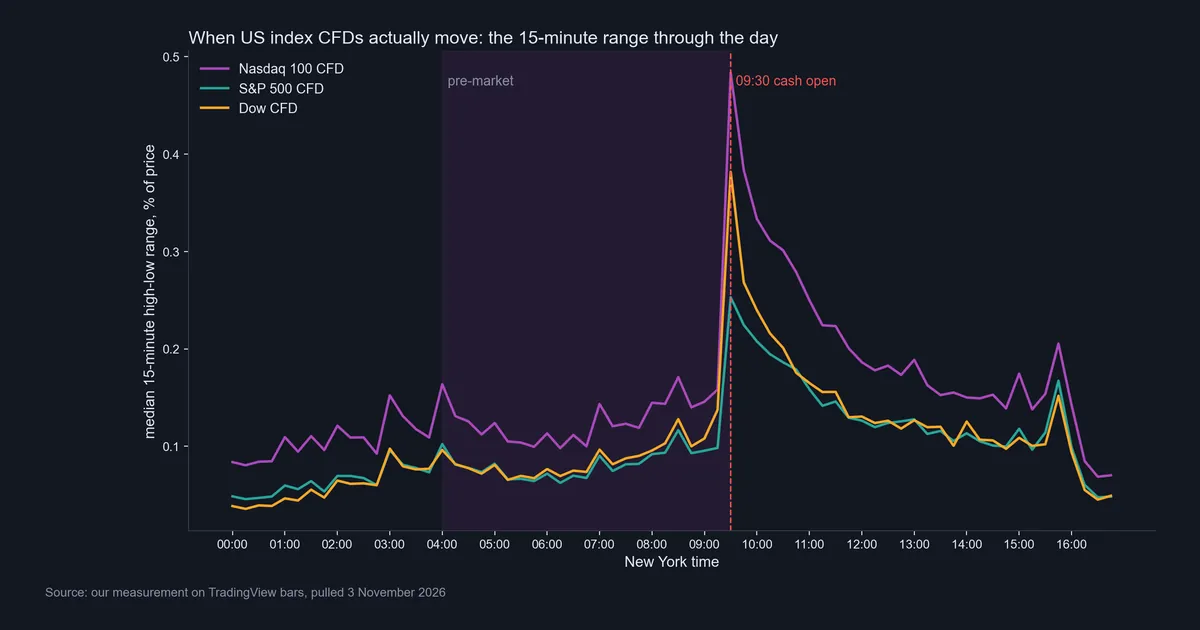
You can also spot a small bump at 08:30, the slot where most major US data lands, though we did not test that link. So what is the pre-market good for? It shows the overnight reaction and gives you levels to watch. We did not test it as a forecast of session width.
Download the complete indicator database
Put these concepts on your charts. One email unlocks the full library of 1,380+ indicators with compiled MT4 and MT5 files, plus my TradingView scripts. No paywall, no spam, unsubscribe any time.
Get free access to my indicator database
One email unlocks 1,380+ free MT4, MT5 and TradingView indicators — the complete library. No single-tool download; you get the whole database.
Where it fails
Our biggest limit is the instrument. We measured OANDA CFDs, not shares and not the cash index. The cash index has no pre-market to measure. A single stock behaves differently too, because its own news and thin book drive it, and we did not test single stocks.
The sample is short as well. It covers 231 days in one stretch of market conditions, and the top-quarter buckets hold only 58 days each. The feed matters too, since these highs and lows are OANDA’s prices. Another broker or a future would print other levels.
We also measured prices and not trades. Nothing here includes spread, swap or commission, or shows the fill you would get before the open. A broken level only means that price traded past it, so this is not a breakout test. Our ORB strategy guide tests a close cousin of that idea, and it found no edge as a stand-alone rule.
Finally, the window is a choice. A box that starts at 07:00 and not at 04:00 can only be the same size or smaller, so the break figures would rise.
What the cash index shows instead
The cash S&P 500 gives the cleanest view of the open, because it has no overnight bars to blur it. The daily chart holds the two largest opening gaps of this stretch. On 17 September the index opened 1.05% above the previous close: look for the small green candle sitting well above the long red one before it. On 30 October it opened 1.16% below, and the big red candle at the right edge shows that drop.
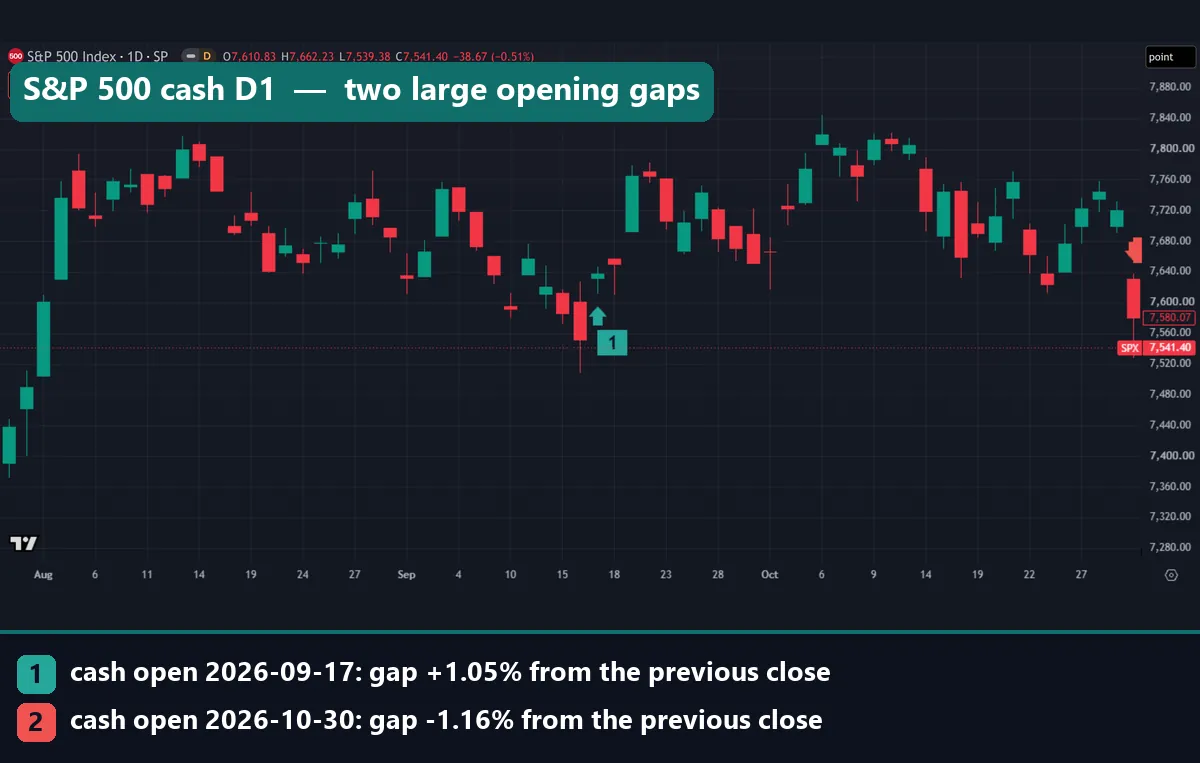
Gaps that size are not the norm. Over the last 750 days the median opening gap came to 0.24%. It passed 0.5% on 21.3% of days and 1% on only 5.9%. The chart header shows the newest bar, 2 November, just past the right edge. It opened at 7,610.83, which is 0.41% above the 30 October close of 7,580.07. The CFD opened at 7,622.8 that morning, about 12 points higher. So the name is the same, but the price is not.
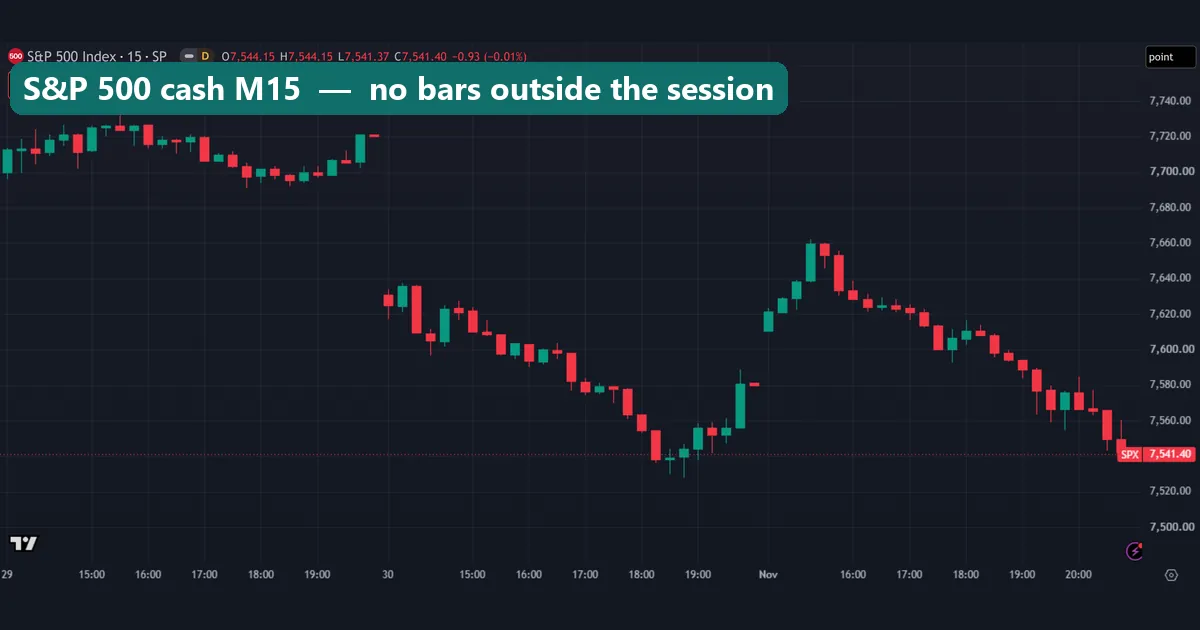
The 15-minute chart makes the limit visible. Each day’s bars stop at the close and restart at the next open, with nothing between them. On 30 October the jump from about 7,720 to about 7,630 is empty space. So when someone quotes the S&P pre-market, they mean a related product such as a future or a CFD, never the index itself.
Common mistakes with the pre-market
- Taking the morning’s direction as the day’s direction. In our sample it matched about half the time, and big moves gave mixed answers.
- Treating the high and low as walls. The session broke each one on roughly two days in three. So a stop loss placed just past one of them sits where price often travels.
- Reading an index CFD as a stock’s pre-market. A CFD chart can look smooth while a given stock barely trades. Check the share’s own quotes and spread before you order.
- Sizing risk from the quiet candles. The median 15-minute range on the S&P more than doubles at the open. A stop that fits an 08:00 bar can sit inside normal noise at 09:30. Our guide to using ATR as a stop loss shows one way to tie the distance to measured range.
Where to go next
To study the open itself, start with our guide to the New York trading session, then read the ORB test results linked above. Forex traders meet the same gap idea at the weekly open, and our page on the weekend gap in forex covers it. For the rules that apply to you, go back to the SEC bulletin and the NYSE hours page near the top.
FAQ: pre market trading questions
What time does pre market trading start?
Nasdaq lists 04:00 to 09:30 Eastern Time. NYSE venues vary: NYSE Arca Equities starts at 04:00, NYSE American at 07:00, and NYSE Tape A has no early session.
Can anyone trade in the pre-market?
Only if your broker offers it, and the SEC tells investors to ask. Many brokers accept only limit orders then.
Why did my pre-market order not fill?
Thin trading is the usual reason. A limit order fills only at your price or better, so it stays open if price moves away. Ask your broker whether an unfilled order cancels or carries into the regular session.
Does the pre-market predict the day?
Not in our data. The session went the same way as the pre-market on 50.0% of days on the S&P CFD, 47.6% on the Nasdaq CFD and 49.8% on the Dow CFD.
Does the S&P 500 index trade before 09:30?
No. The cash index has no bars outside the session. A pre-market S&P figure comes from a related product such as a future or a CFD.
How big is a normal opening gap?
On the cash S&P 500 over the last 750 days, the median came to 0.24%. The gap passed 0.5% on 21.3% of days and 1% on 5.9%.
Do pre-market highs and lows act as support and resistance?
We cannot say, because we only counted breaks and did not test reactions. The session broke the high on about 68% of days and the low on about 68%, and both on 37% to 40%. So expect them to get run through.
Do these figures apply to a single stock?
No. We measured index CFDs, and a single stock’s pre-market depends on its own news and its own thin book. Use our numbers as a description of one sample, not as a forecast: results are not guaranteed; past performance is not indicative of future results.
Last updated: 3 November 2026.

About the author
Written by Dominic Walsh, a Forex trader and MT4/MT5 indicator, Expert Advisor and script developer. Every tool on forexmt4systems.com is tested on live charts before release and ships with ready-to-use compiled MT4 (.ex4) and MT5 (.ex5) files. Learn more about the trader and developer behind this site.
How we build, test and correct every tool: Editorial & Testing Policy. Trading carries risk; see the disclaimer.