
An ORB strategy trades the first break of the price range set in the opening minutes of a session. This guide settles one question with our own data: does the opening range breakout give forex traders an edge? We ran 12,568 rule-based trades on nine symbols. Before costs, the total came to minus 118.6R. So the short answer is no, not as a stand-alone rule. The rest of the page shows how the method works, how to read it on a chart, and where it breaks down.
What an ORB strategy is
ORB stands for opening range breakout. First, you mark the high and the low of a short window right after a market opens. That window is the opening range. Then you wait for price to leave it. A close above the range high is a long signal. A close below the range low is a short signal.
The idea comes from stock and futures trading, where the cash open is a single clear moment. In forex there is no single open, because the market trades around the clock. So traders borrow a busy session start instead. The two common choices are the London trading session and the New York trading session. London is the largest FX centre in the BIS Triennial Central Bank Survey at bis.org, which is why many traders pick its open.
The logic is simple. Orders build up while a centre is closed. When it opens, those orders hit the market and can push price one way. The opening range is meant to show where that push starts. In short, the ORB is a breakout rule tied to a clock, not to a pattern or an indicator.
How the opening range breakout works
The mechanism fits in four lines. Each one is a plain price comparison, with no smoothing and no lookback.
range_high = highest high from open to open + N minutesrange_low = lowest low from open to open + N minuteslong trigger: close > range_high; short trigger: close < range_lowrisk = |entry - opposite side of range|; target = entry +/- risk
So the range does two jobs. It sets the trigger, and it also sets the stop. A narrow range gives a tight stop and a close target. A wide range gives a wide stop and a far target. Because the target equals the risk, each trade wins or loses about 1R, unless the time exit closes it first.
Some traders enter on a touch of the range edge. We used a close instead, because a touch fires on every wick. That said, a close-based entry comes later and at a worse price. Neither version fixes the core problem shown below. For the general idea of a range break, see the breakout definition at Investopedia.
How we tested the ORB strategy
We used MetaTrader 4, build 1471, on Capital Point Trading history read from the terminal’s .hst files. The test ran on M15 bars from 2 June 2025 to 26 August 2026. It covered nine symbols: AUDCAD, AUDUSD, EURUSD, GBPUSD, NZDCAD, USDCAD, USDCHF, USDJPY and XAUUSD.
The rule was the same for every symbol. The London range started at 07:00 UTC. The New York range started at 13:30 UTC, the stock market open. We tested range lengths of 15, 30 and 60 minutes. Then we took the first M15 close outside the range, entered at the next bar’s open, and placed the stop at the other side. The target was 1R. Any open trade closed at 20:00 UTC, and we allowed one trade per day.
Every result is in R and is before spread, swap and commission. AUDUSD and USDJPY had shorter M15 history in this terminal, so their cells hold about 100 trades instead of about 300. The chart images come from the TradingView web chart with OANDA data, captured on 9 October 2026. Our general method is set out in our editorial testing policy.
ORB strategy settings we tested
These are the exact parameters behind every number on this page. If you change one, expect different results.
| Parameter | Value in our test | Why it matters |
|---|---|---|
| Session open | 07:00 UTC (London), 13:30 UTC (New York) | Fixed UTC times, so they drift one hour against local time when clocks change |
| Range length | 15, 30 or 60 minutes | Longer ranges give wider stops and fewer trades |
| Chart | M15 | The trigger is an M15 close, not a tick |
| Trigger | First M15 close outside the range | Only the first break of the day counts |
| Last entry | 12:00 UTC (London), 18:00 UTC (New York) | No signal after this time means no trade |
| Entry | Open of the next bar | Avoids using a price we could not trade |
| Stop | Opposite side of the range | Risk equals range size plus any gap past the edge |
| Target | 1R | Equal reward and risk |
| Time exit | 20:00 UTC | Closes trades that hit neither level |
| Costs | None included | Real costs lower every figure |
Reading the opening range on a chart
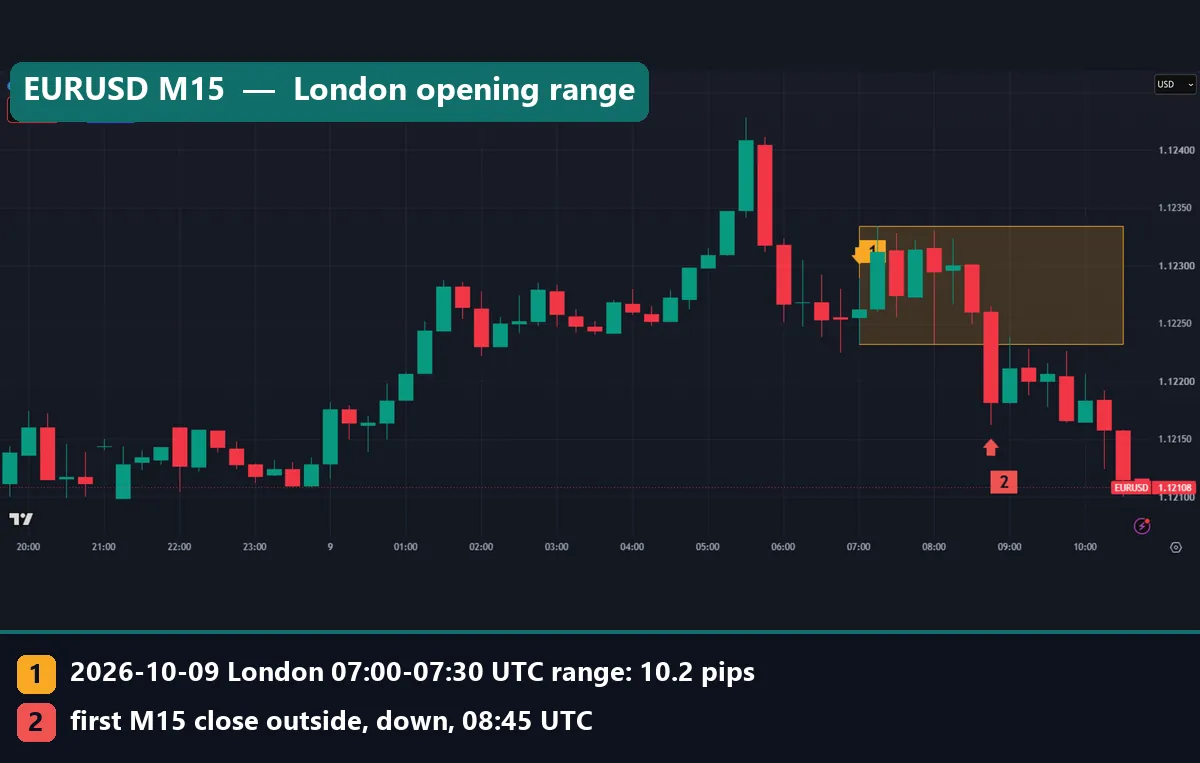
On our images, the yellow box is the London range from 07:00 to 07:30 UTC. It covers the 07:00 and 07:15 M15 bars. We extended it to the right so you can see where price sits against it later in the morning. Marker 1 labels the range and its size. Marker 2 sits on the first M15 bar that closed outside the box.
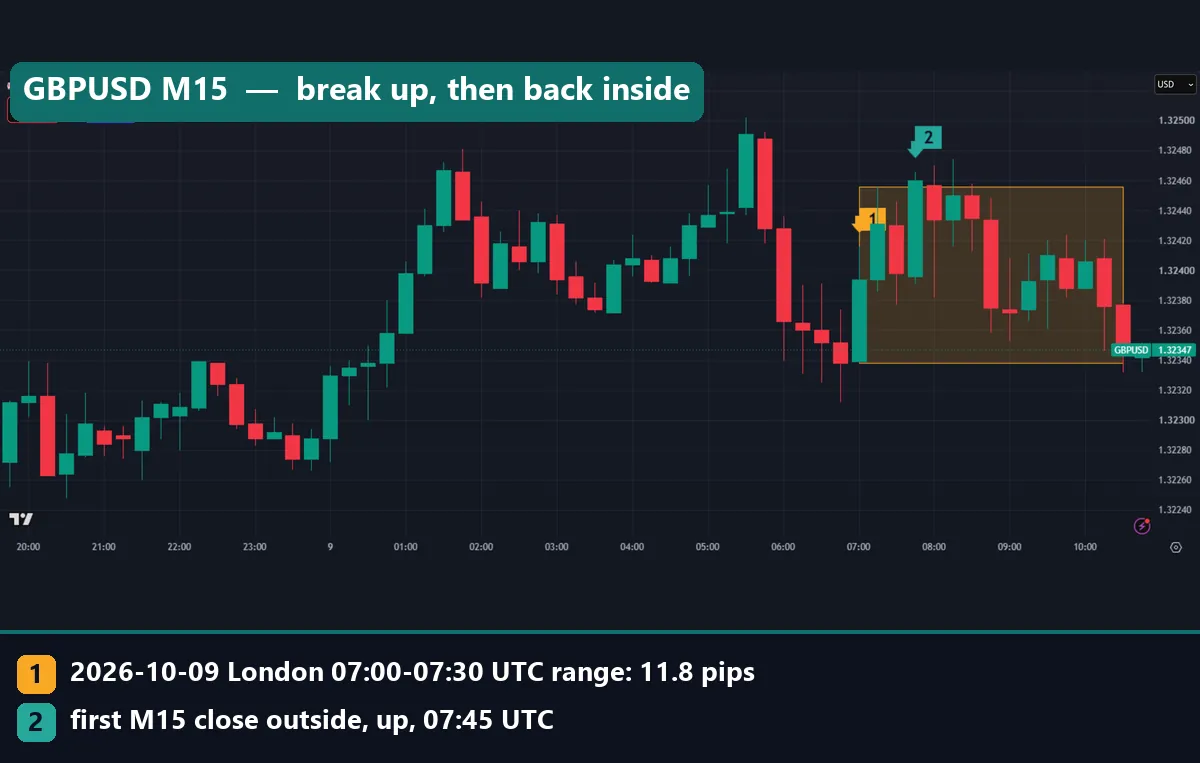
On GBPUSD on 9 October 2026, the range ran from 1.32338 to 1.32456, or 11.8 pips. The 07:45 bar closed above the top, so the rule went long. Look at what came next, though. Price spent the rest of the morning back inside the box. By the last bar on our chart, the low had printed 1.32332, just under the range low and the stop.
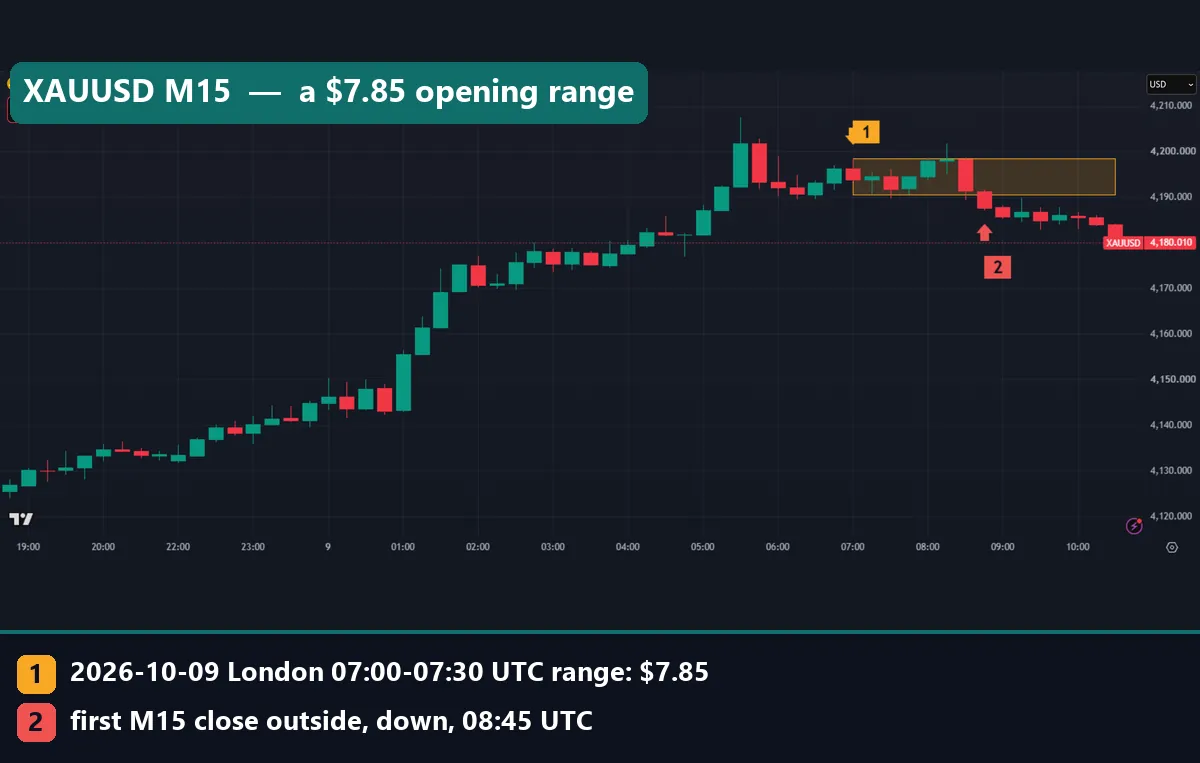
Gold looks different. On XAUUSD the same window measured $7.85, from $4,190.67 to $4,198.52. The first close outside came at 08:45 UTC, on the downside. After that, price kept stepping lower, and the chart’s last price was $4,180.01. Gold is quoted in dollars here, not pips; our gold pip value guide explains the conversion.
Both charts follow the same rule. Still, one trade went with the break and one came straight back. That pattern repeats across the full sample.
Worked example: EURUSD on 9 October 2026
Image 1 at the top shows EURUSD on M15. The London range ran from 1.12232 to 1.12334, so it measured 10.2 pips. Price stayed inside the box for more than an hour. Then the 08:45 bar closed below 1.12232, and marker 2 marks that close.
Here is how the rule turns that into a trade. First, the entry is the open of the next bar, the 09:00 bar. Next, the stop goes at the range high, 1.12334. The risk is the 10.2-pip range plus however far below the range low the entry bar opens. Then the target sits the same distance below the entry. Finally, if neither level is hit, the trade closes at 20:00 UTC.
By the last bar on our chart, EURUSD closed at 1.12108. That is 12.4 pips under the range low. However, our chart ends at about 10:30 UTC, so it does not show how this trade ended. We do not claim a result for it.
Ranges change a lot from day to day. The table lists the London range for the three days in our TradingView data.
| Symbol | 7 Oct 2026 | 8 Oct 2026 | 9 Oct 2026 |
|---|---|---|---|
| EURUSD | 17.6 pips, down at 07:30 | 15.3 pips, up at 08:00 | 10.2 pips, down at 08:45 |
| GBPUSD | 13.4 pips, down at 07:45 | 19.8 pips, up at 08:00 | 11.8 pips, up at 07:45 |
| USDJPY | 9.4 pips, down at 07:45 | 12.8 pips, up at 08:45 | 8.4 pips, up at 07:30 |
| XAUUSD | $7.44, up at 07:30 | $11.06, down at 10:15 | $7.85, down at 08:45 |
What 12,568 ORB trades showed
Across all 54 cells (nine symbols, two sessions, three range lengths), the rule took 12,568 trades. The total was minus 118.6R, or about minus 0.009R per trade. Only 25 of the 54 cells finished above zero. That is close to a coin toss, and it is before any cost.
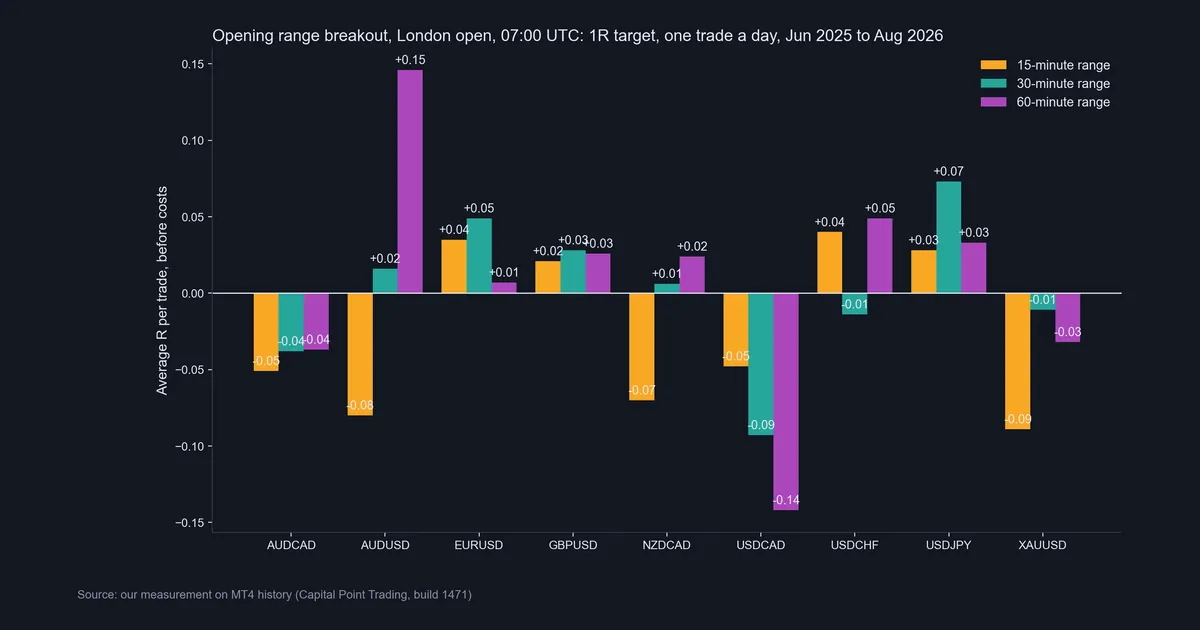
The London chart shows the scatter. The 15-minute range was the weakest: 2,182 trades and minus 53.4R. The 30-minute and 60-minute ranges sat near zero, at minus 0.006R and minus 0.005R per trade. USDCAD lost in all three London lengths, down to minus 0.142R per trade on the 60-minute range.
The tallest bar is AUDUSD on the 60-minute range, at plus 0.146R. But it rests on only 102 trades. Also, the same pair on the 15-minute range scored minus 0.08R. A real effect would not flip sign that easily between neighbouring settings.
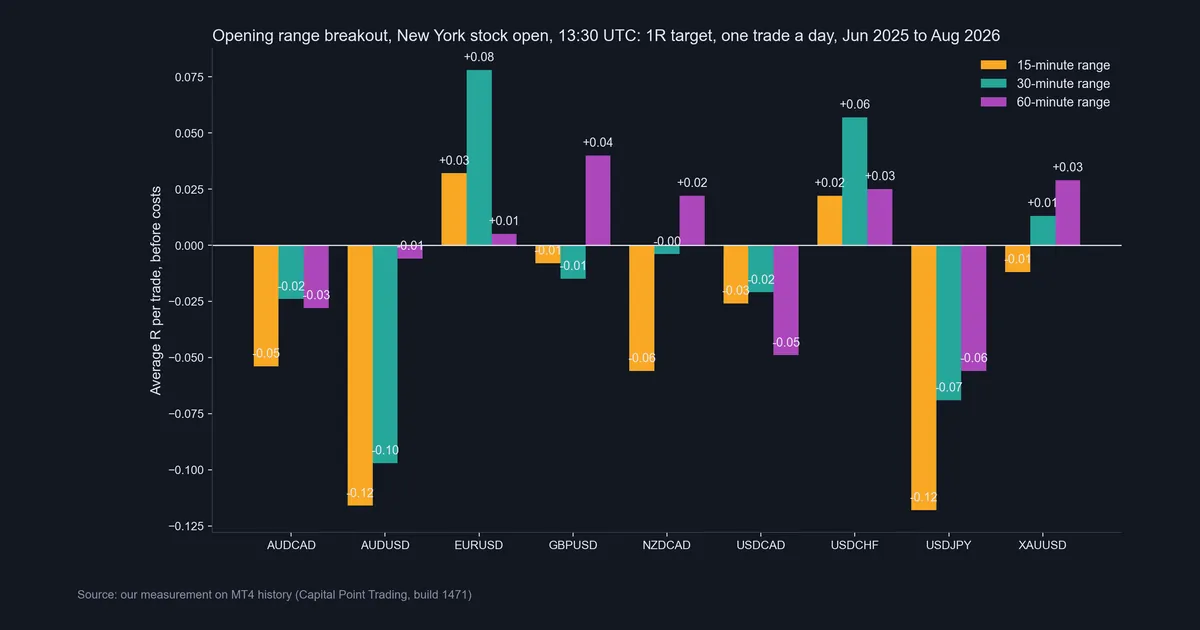
New York told the same story. The 15-minute range lost 53.5R over 2,152 trades. The 30-minute and 60-minute ranges came out at plus 0.004R and plus 0.001R per trade, which is flat. EURUSD was the one symbol above zero in all six cells. Even so, its best figure was plus 0.078R on the New York 30-minute range, with 52.4% of trades closing in profit.
London open or New York open
Neither open gave a clear edge in our data. Still, they behave differently. The London range is quieter. Median EURUSD ranges were 7.2, 9.6 and 13.4 pips for the 15, 30 and 60-minute windows. In New York the same windows measured 8.4, 12.2 and 16.8 pips. For gold, the median London 15-minute range was $7.54, while the New York 60-minute range reached $23.66.
Wider ranges mean wider stops. So costs take a smaller share of each trade in New York. That is one reason the longer New York ranges sat closer to zero than the 15-minute ones.
The New York time also needs care. The NYSE lists the cash open as 9:30 a.m. Eastern Time on its NYSE hours and calendars page. That equals 13:30 UTC only while US daylight time is in force. In winter it falls at 14:30 UTC. Our fixed 13:30 UTC rule therefore used a pre-open window for part of the year. For more on how sessions overlap, read our forex trading sessions guide.
Download the complete indicator database
Put these concepts on your charts. One email unlocks the full library of 1,380+ indicators with compiled MT4 and MT5 files, plus my TradingView scripts. No paywall, no spam, unsubscribe any time.
Get free access to my indicator database
One email unlocks 1,380+ free MT4, MT5 and TradingView indicators — the complete library. No single-tool download; you get the whole database.
Where it fails
The ORB strategy has five clear weak spots, and our test hit all of them.
- No edge before costs. The full sample lost 118.6R. Most cells sat within a few hundredths of an R from zero.
- Small stops make costs heavy. A 15-minute EURUSD range had a median of 7.2 pips. A spread of one pip or so is a large slice of that, on entry and again on exit.
- False breaks. Price often closes outside the box and then returns. GBPUSD on 9 October did exactly that.
- Fixed clocks drift. Daylight saving moves the real open by an hour against UTC twice a year.
- Cherry-picked cells. With 54 cells, a few will look good by chance. AUDUSD London 60-minute is one example.
None of this means a range break never runs. Gold on 9 October ran. But a rule needs to work across many days, and this one did not in our sample.
Two ORB failures on the chart
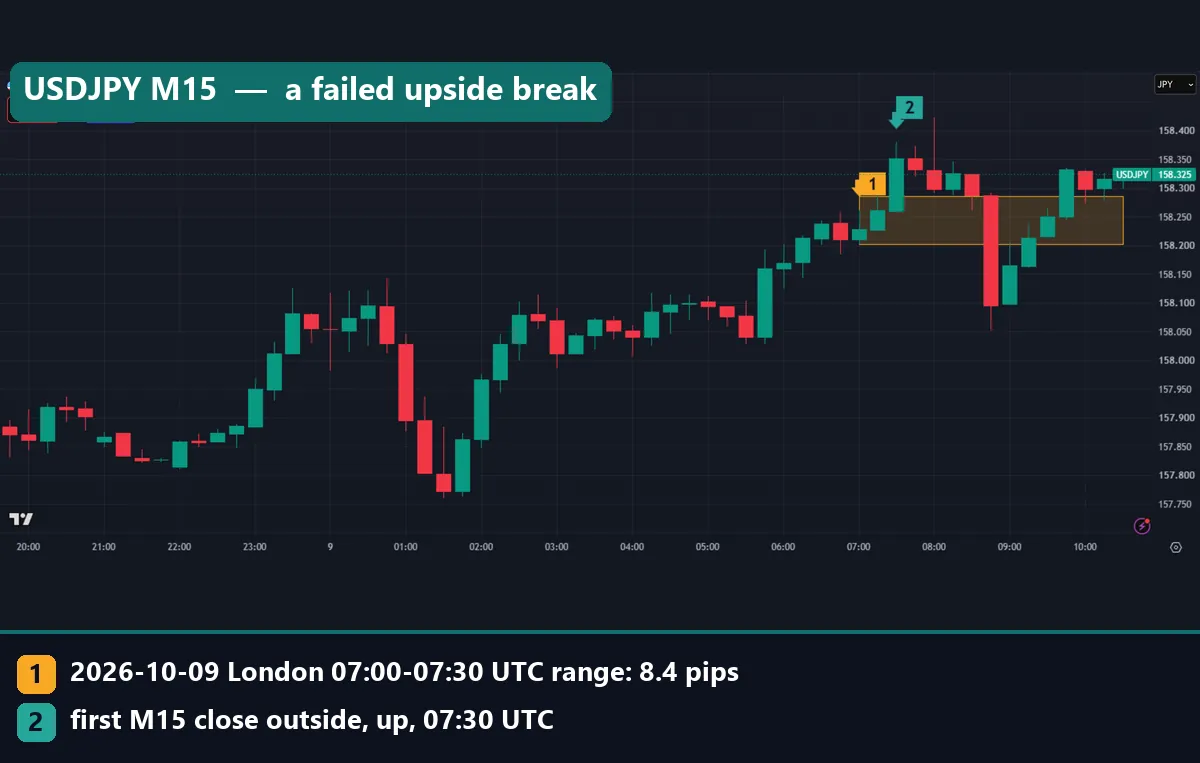
USDJPY on 9 October set a London range of 158.202 to 158.286, or 8.4 pips. The 07:30 bar closed above it, so the rule went long. The move stalled within a few bars. Then the 08:45 bar dropped through the whole range and below 158.10. That takes out a stop placed at the range low.
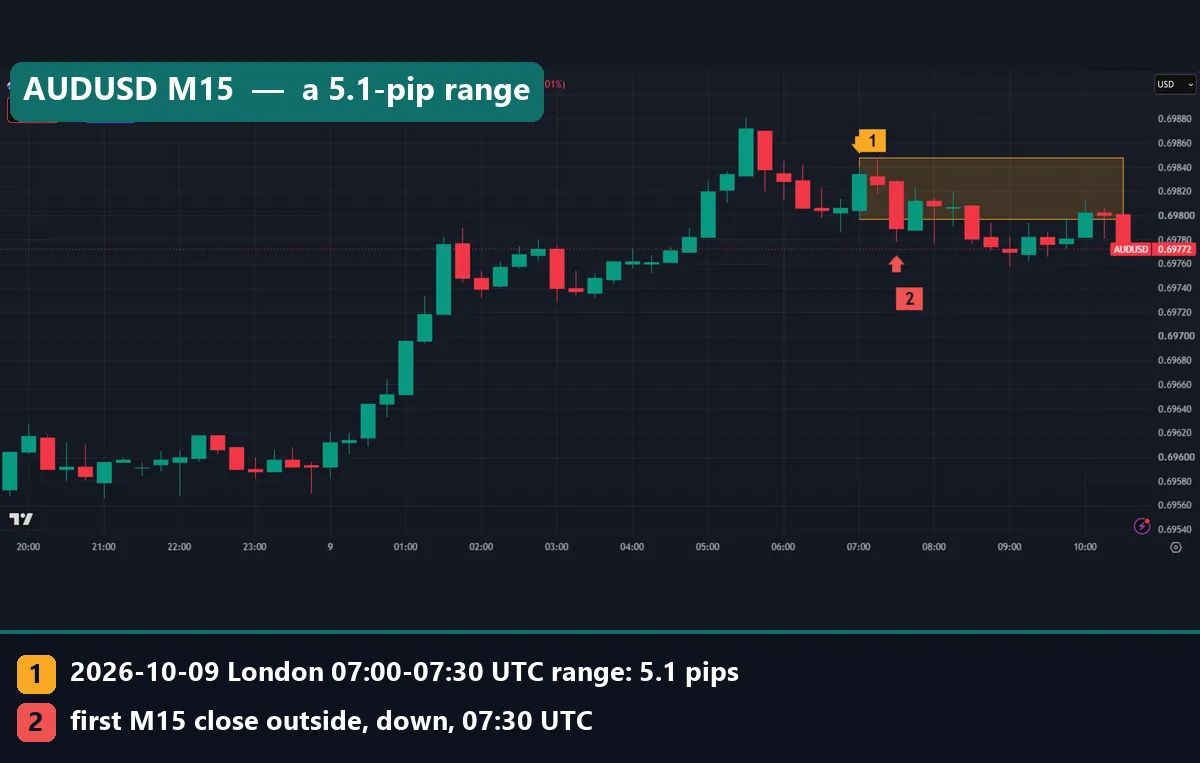
AUDUSD shows the cost problem. Its range was only 5.1 pips, from 0.69797 to 0.69848. The 07:30 bar closed below it, so the rule went short. After that, price chopped sideways and closed back inside the box on the 10:00 bar. On our capture, the quote panel showed 1.3 pips between the bid and the ask. That reading comes from the moment of capture, not from 07:30. Even so, a gap of that size against a 5.1-pip range eats about a quarter of the stop distance. Our guide to why spreads widen covers when that gap grows.
Common mistakes with the opening range breakout
- Ignoring costs on narrow ranges. A 5-pip stop with a 1-pip spread is not the same trade as a 20-pip stop. Read our page on the spread in forex before trading tight ranges.
- Using a fixed lot. Range size changes every day, so the risk per trade changes too. Size each position from the stop distance with a position size calculator and a set risk per trade.
- Taking the second and third break. After a false break, traders often flip and chase the other side. That doubles the cost and rarely fixes the trade.
- Trusting the best cell. Picking the one pair and range length that looked good in the past is curve fitting. Test the same rule on fresh data first.
Where to go next
If you want to see what usually happens in the hours after the London open, read ICT daily profiles. For timing in general, our guide on when to buy and sell on forex compares the sessions. The ICT Asian range strategy uses the overnight range instead of the opening one. Our daily forex pips study shows how far each pair moves in a full day.
To draw the box on MT4, try the opening range breakout indicator. On TradingView, the Pine Script sessions documentation at TradingView explains how a script finds a session window. That helps if you want to code your own range.
FAQ: ORB strategy questions
What does ORB stand for in trading?
ORB means opening range breakout. You mark the high and low of the first minutes after an open, then trade the first close outside that range.
Does the ORB strategy work in forex?
Not on its own in our test. Across 12,568 trades on nine symbols from June 2025 to August 2026, the total was minus 118.6R before costs.
What time is the London opening range?
We used 07:00 to 07:30 UTC for the images, and 15, 30 and 60-minute windows from 07:00 UTC in the test.
Is a 15-minute or 60-minute range better?
In our data the 15-minute range was the weakest in both sessions, near minus 53R each. The longer ranges sat close to zero, which is still no edge.
Where should the stop go on an ORB trade?
Our rule put the stop at the opposite side of the range. That makes the risk equal to the range size plus any gap between the edge and the entry.
Does the ORB strategy work on gold?
XAUUSD did not stand out. Its London 15-minute cell lost 0.089R per trade over 271 trades, and its other cells sat near zero.
Why do costs matter more on an ORB strategy?
Opening ranges are small. A median 15-minute EURUSD range was 7.2 pips, so spread and commission take a large share of each 1R.
Can I improve the ORB with filters?
You can test filters such as trend or volatility, but test them on data you did not use to pick them. Treat any rule as a research idea; results are not guaranteed; past performance is not indicative of future results.
Last updated: 9 October 2026.

About the author
Written by Dominic Walsh, a Forex trader and MT4/MT5 indicator, Expert Advisor and script developer. Every tool on forexmt4systems.com is tested on live charts before release and ships with ready-to-use compiled MT4 (.ex4) and MT5 (.ex5) files. Learn more about the trader and developer behind this site.
How we build, test and correct every tool: Editorial & Testing Policy. Trading carries risk; see the disclaimer.