
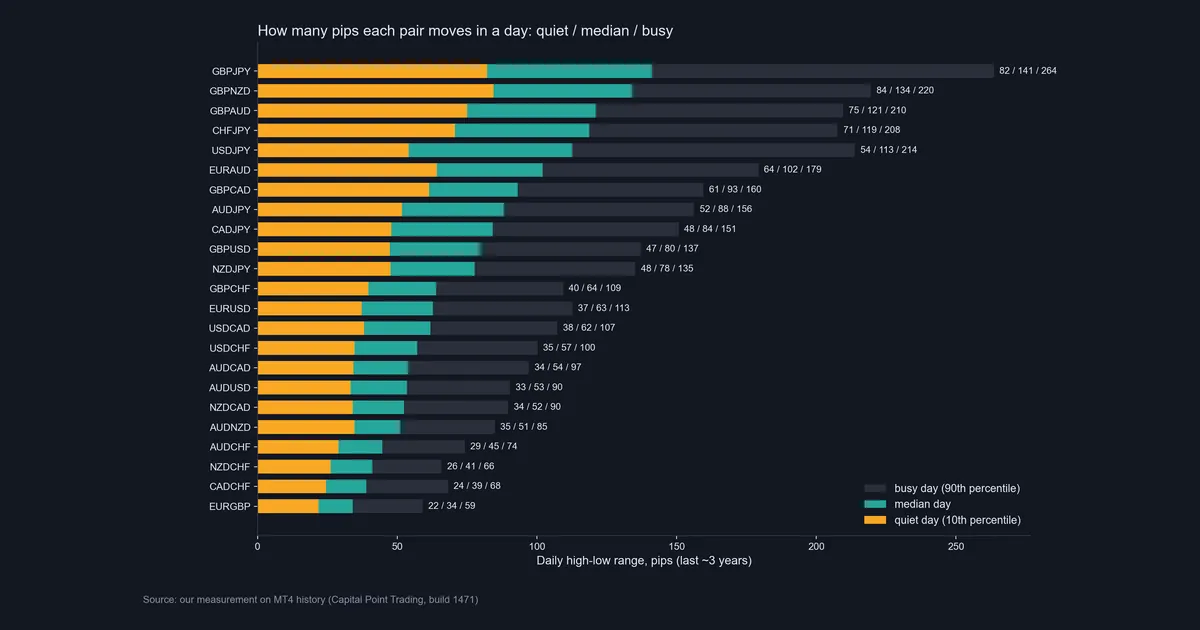
Daily forex pips is the number of pips a currency pair travels from its daily low to its daily high. We measured it on 23 pairs over the last 750 trading days, so this guide settles a plain question: how many pips does each pair move on a quiet day, a normal day and a busy day? You also get the weekday and session split, two dated chart examples, and the places where an average range lets you down.
What daily forex pips actually means
A pip is the standard price step of a currency pair. On most pairs it is the fourth decimal, so 0.0001. On yen pairs it is the second decimal, so 0.01. Our guide to the pip in forex covers the basics, and pips vs points explains why MT4 often shows ten times more “points” than pips.
So when traders ask about daily forex pips, they mean the daily range in pips. It is not the distance from open to close. A day can swing 100 pips and close flat. The range only tells you how much ground price covered. It says nothing about direction, and it says nothing about whether you could have caught any of it.
That distinction matters. The range is a measure of room. It helps you size stops, set realistic targets and pick pairs that suit your timeframe. It is not a forecast and it is not a profit figure.
How the daily range is calculated
The formula is short. For one day:
daily range (pips) = (daily high - daily low) / pip size
For EURUSD the pip size is 0.0001. For USDJPY it is 0.01. For example, a EURUSD day with a high of 1.13368 and a low of 1.12152 covers 0.01216, which is 121.6 pips.
One day is noise, though. So most tools average the range over a window. An average daily range (ADR) indicator usually takes the mean of the last 5, 10 or 20 days. The Average True Range (ATR) goes one step further. It also counts gaps from the previous close, then smooths the result. TradingView documents the ATR formula in its Average True Range help page on TradingView.
We chose the median instead of the mean. One shock day can drag a mean far upward. The median is the middle day, so half the days were smaller and half were larger. Then we added two edges: the 10th percentile as a “quiet day” and the 90th percentile as a “busy day”.
How we tested
All pair numbers come from our own MT4 terminal history: Capital Point Trading, MetaTrader 4, build 1471, read straight from the .hst files. The daily file holds 23 FX pairs from 12 June 2018 to 24 August 2026. For the range table we used the last 750 trading days in that file, which is about three years.
Next, for the session split, we used M15 bars on 9 symbols from 2 June 2025 to 26 August 2026. Those are AUDCAD, AUDUSD, EURUSD, GBPUSD, NZDCAD, USDCAD, USDCHF, USDJPY and gold. For each day we took the high-low range inside four UTC windows, then the median.
The chart examples are TradingView web charts with OANDA data, captured on 7 and 8 October 2026. Each one marks the busiest and quietest day of the last 60 bars. Our full method rules are on the editorial testing policy page.
One caveat applies throughout. Ranges are raw price movement. They ignore spread, swap and commission, and they say nothing about trade results.
The measurement settings in one table
These are the parameters behind every number in this guide. If you rebuild the test, change one of them and the figures will shift.
| Parameter | Our setting | Why it matters |
|---|---|---|
| Range definition | D1 high minus D1 low, in pips | Ignores gaps from the prior close, unlike ATR |
| Lookback | Last 750 trading days | About three years; older regimes drop out |
| Central value | Median | One shock day cannot drag it up |
| Quiet day | 10th percentile | 10% of days were smaller |
| Busy day | 90th percentile | 10% of days were larger |
| Weekday | Server date of the D1 bar | Monday’s bar includes the Sunday evening open |
| Sessions (UTC) | Asia 21:00-06:59, London 07:00-11:59, NY AM 12:00-15:59, NY PM 16:00-20:59 | Session lengths differ, so compare pips per hour too |
| Gold | Dollars, not pips | A gold “pip” here is a $0.10 step |
Daily forex pips by pair: our measured table
The table lists nine common pairs. The chart at the top of this guide shows all 23 in the same quiet / median / busy order.
| Pair | Quiet day (p10) | Median day | Busy day (p90) |
|---|---|---|---|
| GBPJPY | 82.2 | 141.2 | 263.6 |
| USDJPY | 54.1 | 112.6 | 213.8 |
| GBPUSD | 47.3 | 79.6 | 137.2 |
| EURUSD | 37.2 | 62.8 | 112.7 |
| USDCAD | 38.1 | 61.9 | 107.3 |
| USDCHF | 34.7 | 57.1 | 100.2 |
| AUDUSD | 33.3 | 53.4 | 90.3 |
| AUDCHF | 29.0 | 44.6 | 74.2 |
| EURGBP | 21.8 | 34.0 | 59.1 |
The spread between pairs is wide. GBPJPY’s median day is more than four times EURGBP’s. The pound crosses fill the top of the list: GBPNZD at 134.1 and GBPAUD at 121.0. Then come CHFJPY at 118.8 and USDJPY at 112.6.
The quiet end belongs to pairs whose two currencies tend to move together. EURGBP, CADCHF at 38.9 and NZDCHF at 41.1 sit at the bottom. That fits our wider notes on volatile forex pairs.
Reading the daily range on a chart
You do not need a script to see the range. Every daily candle already shows it: the distance from wick top to wick bottom. The trick is to compare one candle against the normal day for that pair.
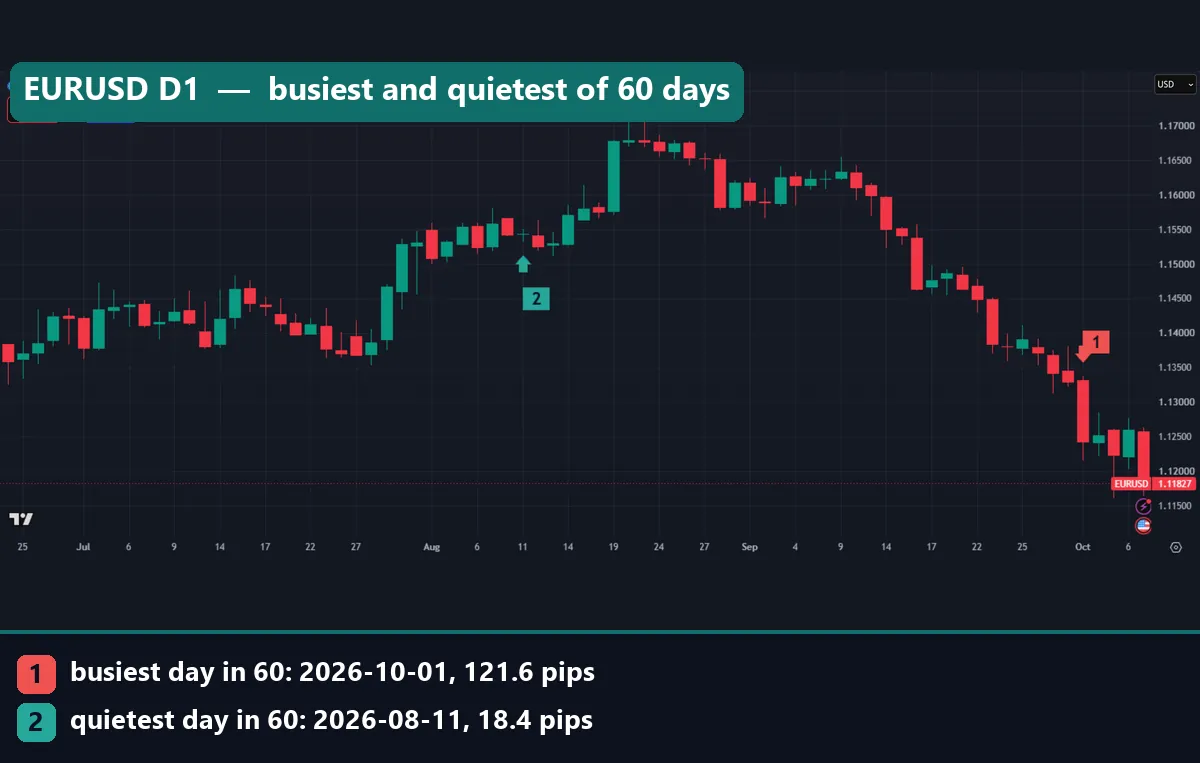
Look at EURUSD first. Marker 1 is 1 October 2026, the busiest day of the 60 shown, at 121.6 pips. Marker 2 is 11 August 2026, the quietest, at 18.4 pips. Both sit outside our three-year band of 37.2 to 112.7 pips. So in just 60 bars, the pair printed a day busier than the 90th percentile and a day quieter than the 10th.
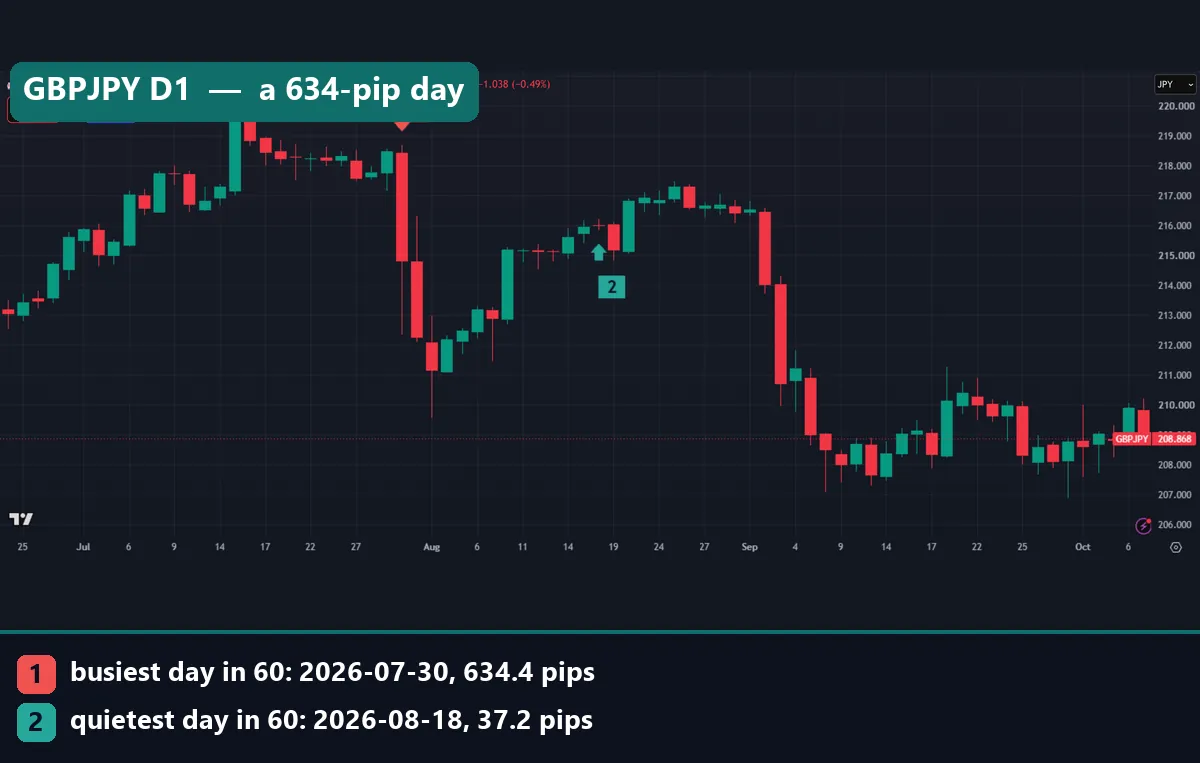
GBPJPY shows the same thing on a larger scale. Marker 1 is 30 July 2026, a 634.4-pip day. Marker 2 is 18 August 2026, at 37.2 pips. The busy day is more than double our p90 of 263.6. Also note how the chart changes after a big day. Late July ran wide, while the middle of August went flat.
In short, your eye should judge each candle against the pair’s own median, never against a fixed number like “100 pips”.
Worked example: EURUSD on 1 October 2026
Here is the arithmetic on a real day from our chart. On 1 October 2026, OANDA’s EURUSD daily bar opened at 1.13317, made a high of 1.13368 and a low of 1.12152, then closed at 1.12426.
- First, take the range: 1.13368 minus 1.12152 equals 0.01216.
- Next, divide by the pip size of 0.0001. That gives 121.6 pips.
- Then compare it with our median of 62.8. The day ran almost twice the normal range.
- Finally, compare it with the busy-day edge of 112.7. It cleared that too, so it was a top-10% day.
Now the quiet side. On 11 August 2026 the bar ran from 1.15314 to 1.15498. That is 18.4 pips, well under the quiet-day edge of 37.2. The bar opened at 1.15429 and closed at 1.1543, so it barely moved.
What does that tell a trader? A 60-pip target was easy room on 1 October. On 11 August, the same target needed more than three times the day’s whole range. That is why range numbers belong in planning. To turn pips into money for your lot size, use our guide to calculating pip value.
Which weekdays and sessions move the most pips
We scaled each weekday by the pair’s own median, then took the middle value across all 23 pairs. The result is a mild pattern, not a strong one.
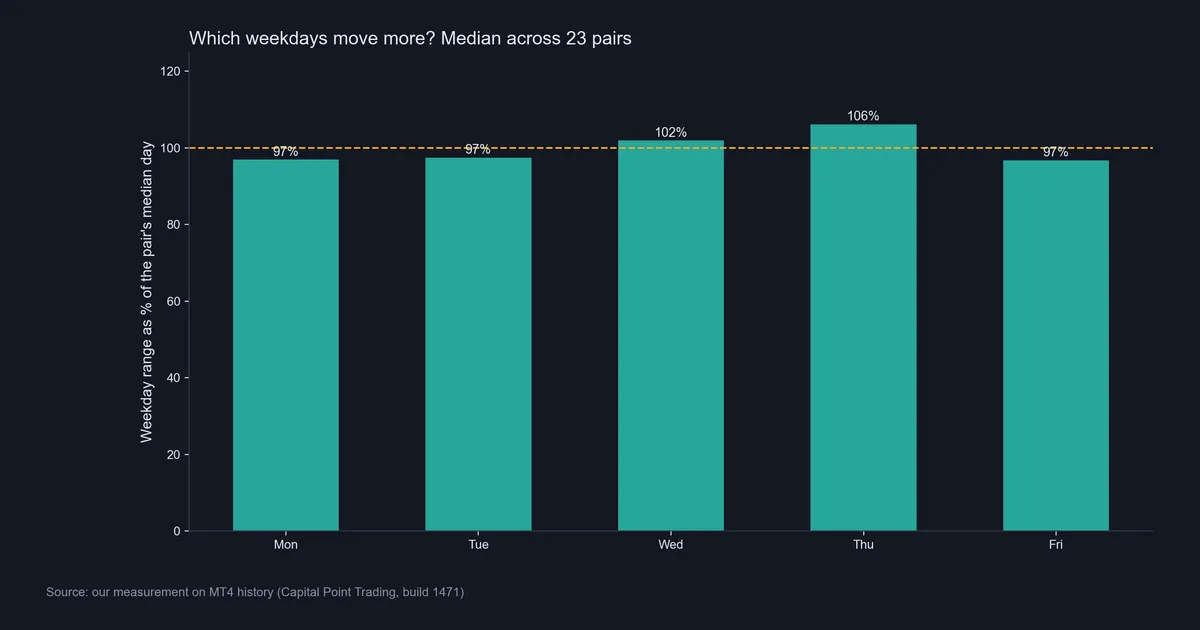
Thursday ran at 106% of a normal day and Wednesday at 102%. Monday, Tuesday and Friday each came in at 97%. So the gap between the busiest and the quietest weekday is under ten points. For example, EURUSD’s Thursday median was 66.7 pips against 59.8 on Monday. That is real, but it is small next to the gap between a quiet and a busy day.
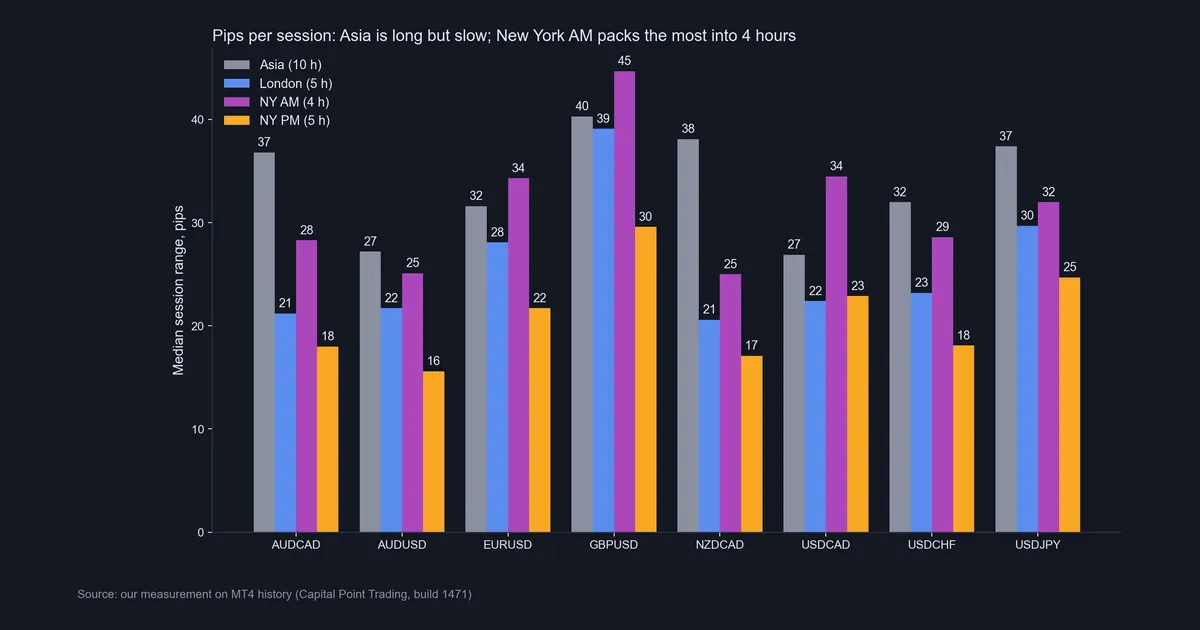
Sessions tell a sharper story. On EURUSD, Asia covered 31.6 pips in ten hours. New York AM covered 34.3 pips in four. London’s five hours gave 28.1, and New York PM gave 21.7. GBPUSD had the biggest New York AM range at 44.7. USDCAD’s New York AM, at 34.5, beat its Asia session by a wide margin.
Note one trap. Session ranges do not add up to the daily range, because sessions overlap in price. Our forex trading sessions guide shows the clock times.
Download the complete indicator database
Put these concepts on your charts. One email unlocks the full library of 1,380+ indicators with compiled MT4 and MT5 files, plus my TradingView scripts. No paywall, no spam, unsubscribe any time.
Get free access to my indicator database
One email unlocks 1,380+ free MT4, MT5 and TradingView indicators — the complete library. No single-tool download; you get the whole database.
Where it fails
An average daily range is a rear-view number. It describes the last three years, and markets change regime. A pair can sit in a quiet stretch for weeks, then double its range after one central bank decision. Our tables cannot see that coming.
The median also hides the tails. Ten percent of EURUSD days ran wider than 112.7 pips. Those are the days that hit stops placed at “the average”. The range also ignores where the day closed, so a 120-pip day can still leave a trend trader with nothing.
Broker data differs too. Our MT4 server day and TradingView’s OANDA day may start at different hours. So the same calendar date can show a different high and low. Monday’s server bar, for example, includes the Sunday evening open.
Finally, our session data covers only 9 symbols and about 15 months. That is a small window. Treat the session split as a pattern from that period, not a law. Gold has a further limit: our MT4 gold daily file holds only 210 bars.
Gold and USDJPY: two charts that break the average
Gold needs its own units. A gold “pip” in our data is a $0.10 step, so we write gold in dollars. Over 210 daily bars, the median gold day covered $89.96. Our guide to gold pip value explains the contract maths.
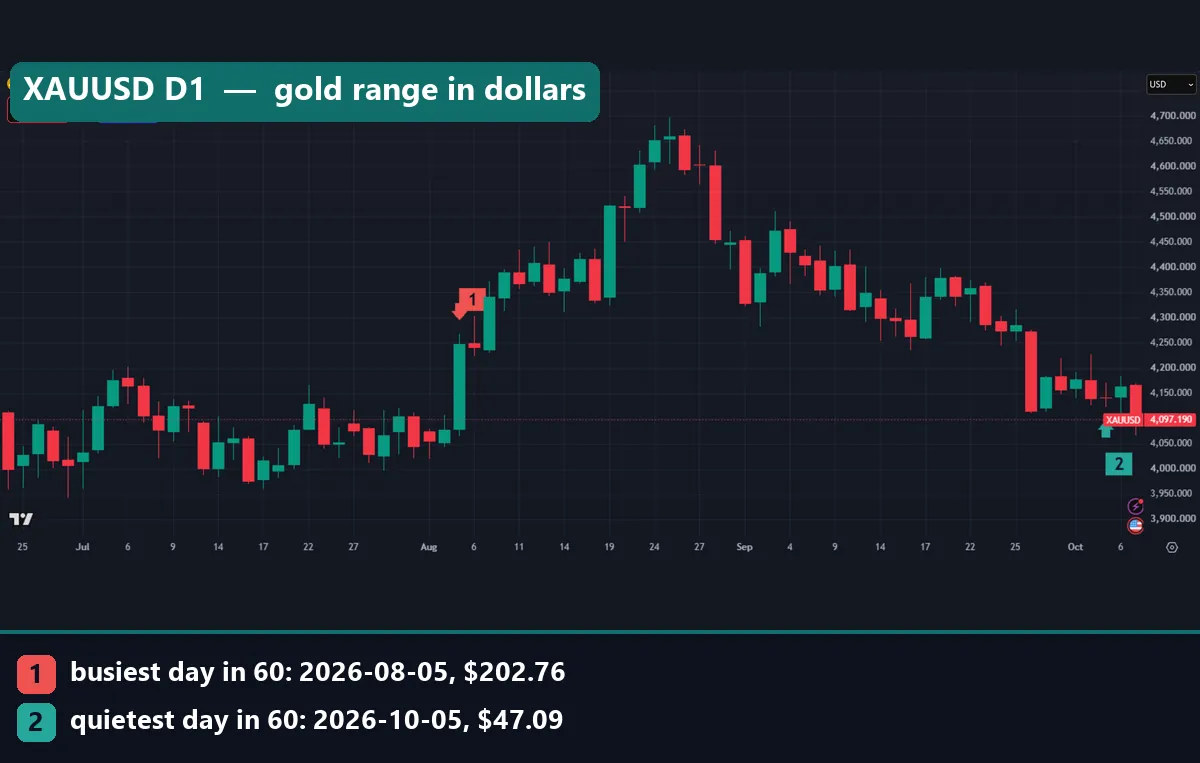
On the gold chart, marker 1 is 5 August 2026, a $202.76 day. Marker 2 is 5 October 2026, at $47.09. So within 60 bars, gold ranged from about half its median day to more than double it.
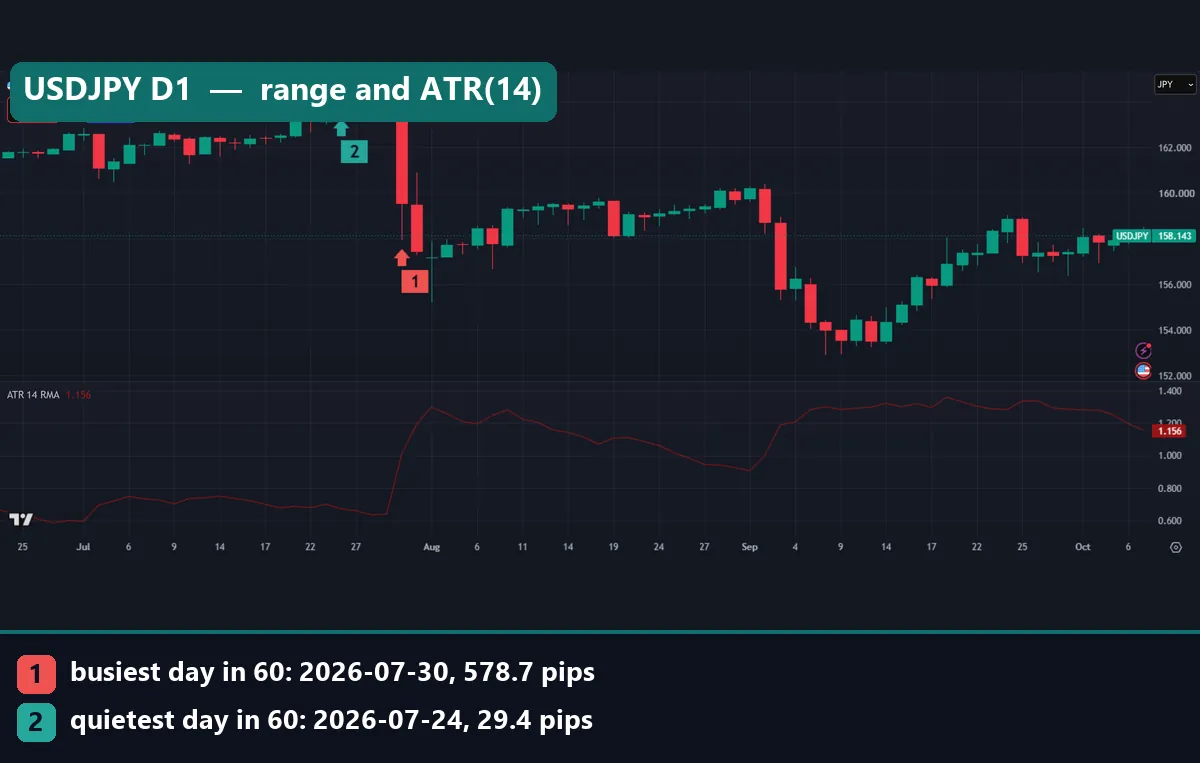
USDJPY adds an ATR(14) pane. Marker 2, near the July top, is 24 July 2026, a quiet 29.4-pip day. A few sessions later, on 30 July, the pair moved 578.7 pips. Marker 1 sits just below that long red candle, and the ATR line in the lower pane climbs sharply right after it. On the capture date the ATR read 1.156 yen, which is 115.6 pips. That is close to our three-year median of 112.6, yet it got there after a shock.
Common mistakes with daily pips
1. Treating the average as a target. The range is room, not a promise. Half of all days run below the median, so a target set at the median will miss often.
2. Using one pip size for every symbol. Yen pairs use 0.01 and gold uses dollars here. Mix them up and your numbers will be off by a factor of 100.
3. Ignoring the tails. A stop sized to the median day sits inside the range on roughly half of all days. Instead, check the busy-day number too. Our guide on using ATR as a stop loss covers that sizing step.
4. Comparing pairs without scaling. A 60-pip day is busy for EURGBP but quiet for GBPJPY. So always read a range against the pair’s own history, not against another pair.
Where to go next
If you want the range on your own chart, start with our Average Daily Range (ADR) indicator. The average daily range indicator is a second take on the same idea, and the daily range indicator marks today’s high-low box. For a one-off check, try the forex volatility calculator.
Then link the range to your style. Our guide to the best forex pair for swing trading uses the same data, and what ATR means in trading explains the smoothed version.
For outside reading, the pip definition at Investopedia covers the unit, and BabyPips’ lesson on pips and pipettes explains the fifth decimal. Also see the BIS Triennial FX Survey at bis.org for which currencies trade most.
FAQ
How many pips does EURUSD move per day?
In our three-year sample the median EURUSD day covered 62.8 pips. A quiet day, the 10th percentile, was 37.2 pips, and a busy day, the 90th percentile, was 112.7 pips.
Which forex pair moves the most pips per day?
GBPJPY had the widest median range of our 23 pairs, at 141.2 pips. GBPNZD followed at 134.1 and GBPAUD at 121.0. But bigger ranges also mean wider stops for the same risk.
Which pair moves the fewest pips per day?
EURGBP was the quietest, with a median of 34.0 pips. CADCHF at 38.9 and NZDCHF at 41.1 came next. These pairs join two currencies that often move together.
Is ADR the same as ATR?
No. ADR averages the plain high-low range of each day. ATR also counts gaps from the previous close and smooths the result, so it reacts a little differently after weekend gaps.
Which day of the week has the biggest range?
Thursday, by a small margin. Across 23 pairs it ran at 106% of a normal day, and Wednesday at 102%. Monday, Tuesday and Friday each sat at 97%.
Which session moves the most pips?
For most of our 9 symbols, New York AM packed the most pips into the fewest hours. On EURUSD it covered 34.3 pips in four hours, while Asia needed ten hours for 31.6.
How should I count pips on gold?
Write gold in dollars. In our data a gold “pip” is a $0.10 step, so the median day of $89.96 equals about 900 such steps. Brokers differ, so check your symbol’s contract details.
Can I use daily pips to set profit targets?
You can use them to judge whether a target is realistic for the day, but not to predict one. Half of all days run below the median, and the range ignores direction; results are not guaranteed; past performance is not indicative of future results.
Last updated: 8 October 2026.

About the author
Written by Dominic Walsh, a Forex trader and MT4/MT5 indicator, Expert Advisor and script developer. Every tool on forexmt4systems.com is tested on live charts before release and ships with ready-to-use compiled MT4 (.ex4) and MT5 (.ex5) files. Learn more about the trader and developer behind this site.
How we build, test and correct every tool: Editorial & Testing Policy. Trading carries risk; see the disclaimer.