
When to buy and sell on forex is really a question about time: which hours of the day the market actually moves, and which hours it mostly sits still. We measured that on nine symbols over fourteen months of 15-minute history. This guide settles three things. First, which UTC hours carry the biggest ranges. Second, whether any hour tends to keep the direction of the hour before it. Third, how much of a typical day’s range is already printed by lunchtime in London. It does not tell you which way to trade, because our data says the clock cannot answer that.
When to buy and sell on forex: what the question really means
Most people who type this question want a time of day. Forex trades from Sunday evening to Friday evening, but activity is far from even.
So we split the question in two. The first half is about size: when do candles get big enough to cover a spread and reach a target? The second half is about direction: is there an hour when price tends to rise or fall? Our tests answer the first half clearly. The second half has no useful answer, and we say so throughout.
In short, a good time to trade is when the market moves enough for your plan, not when it is likely to go your way. If you want the background on session names first, our primer on forex trading sessions covers the basics.
How the trading day works: three sessions and a hand-off
The forex day has no single exchange. Instead, banks in different cities take over as their working day starts. Sydney and Tokyo open the week, London takes over in the morning, and New York joins after lunch in Europe. The BIS Triennial Survey of FX turnover shows how much trading clusters in a few centres, with the UK and the US on top.
That clustering is why ranges change through the day. When London and New York both work, bars grow. When only Asian desks trade, most dollar and euro pairs drift.
To compare symbols with very different pip sizes, we used one simple ratio for every hour:
hour score = (hour high - hour low) / median M15 bar range of that symbol
A score of 2.0 means the hour covered twice the range of a normal 15-minute bar. Then we took the median score per UTC hour across all nine symbols.
For direction, we checked whether each hour closed the same way as the hour before it.
How we tested
We read 15-minute history from MetaTrader 4, build 1471, on the Capital Point Trading terminal. The window runs from 2 June 2025 to 26 August 2026. The nine symbols were AUDCAD, AUDUSD, EURUSD, GBPUSD, NZDCAD, USDCAD, USDCHF, USDJPY and XAUUSD.
The terminal clock runs on server time, so we converted every bar to UTC. Server time is UTC plus 3 hours in European summer and plus 2 hours in winter. We then grouped bars by UTC hour and session. Daily figures use D1 history on 23 pairs, last 750 trading days.
The chart screenshots come from the TradingView web chart with OANDA data, captured on 7 October 2026. They show EURUSD H1, GBPUSD M15 and XAUUSD H1. The dashed lines mark the London open at 07:00 UTC in blue and the New York open at 12:00 UTC in purple.
All results are before spread, swap and commission. Our full method rules are in the editorial testing policy.
Session times and the typical range in each
The table lists our four session windows in UTC and the median high-low range of each, per day. Note that the windows have different lengths. Asia covers ten hours, London five, New York morning four and New York afternoon five. So compare ranges per hour, not only in total.
| Session (UTC) | Hours | EURUSD | GBPUSD | USDJPY | USDCAD | XAUUSD |
|---|---|---|---|---|---|---|
| Asia, 21:00 to 06:59 | 10 | 31.6 pips | 40.3 pips | 37.4 pips | 26.9 pips | $53.43 |
| London, 07:00 to 11:59 | 5 | 28.1 pips | 39.1 pips | 29.7 pips | 22.4 pips | $28.85 |
| New York AM, 12:00 to 15:59 | 4 | 34.3 pips | 44.7 pips | 32.0 pips | 34.5 pips | $45.51 |
| New York PM, 16:00 to 20:59 | 5 | 21.7 pips | 29.6 pips | 24.7 pips | 22.9 pips | $30.71 |
The pattern is clear. The four-hour New York morning beats the ten-hour Asian window on EURUSD, GBPUSD and USDCAD. For example, USDCAD moves 34.5 pips in those four hours but only 26.9 pips in ten Asian hours. To convert these times to your own clock, use our forex time zone converter.
Reading the clock on a chart: size yes, direction no
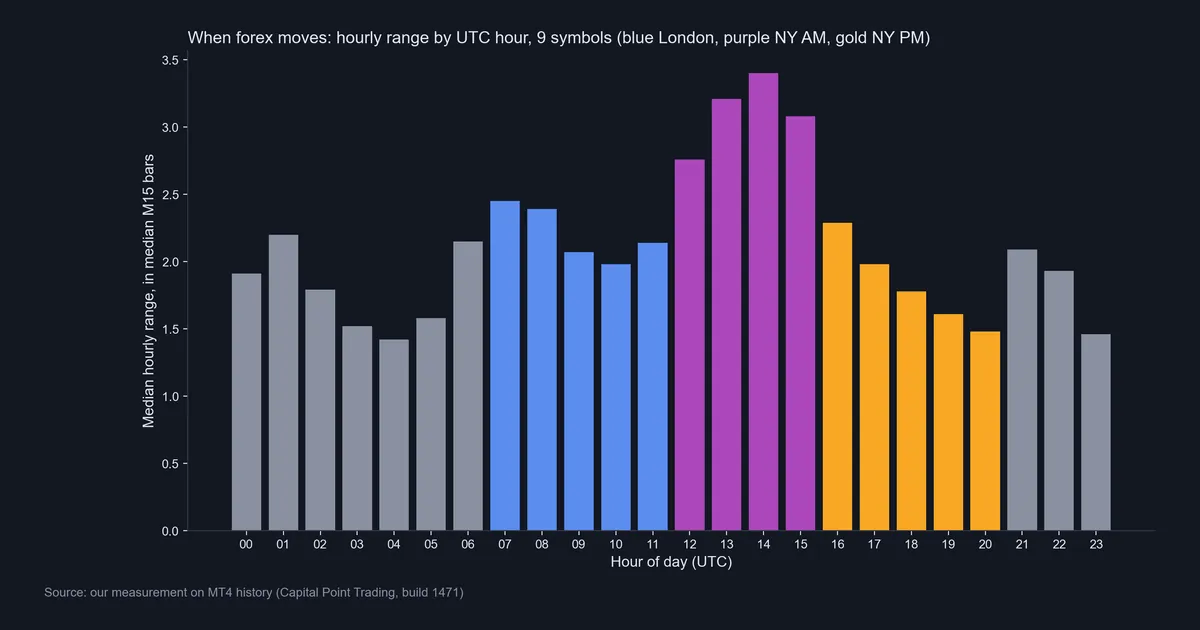
The first chart above shows the hourly scores. The quietest hour is 04:00 UTC at 1.42. Then the London open lifts the score to 2.45 at 07:00 and 2.39 at 08:00. After a lull, the New York morning takes over: 2.76 at 12:00, 3.21 at 13:00, 3.40 at 14:00 and 3.08 at 15:00. So the busiest hour moves more than twice as much as the quietest one.
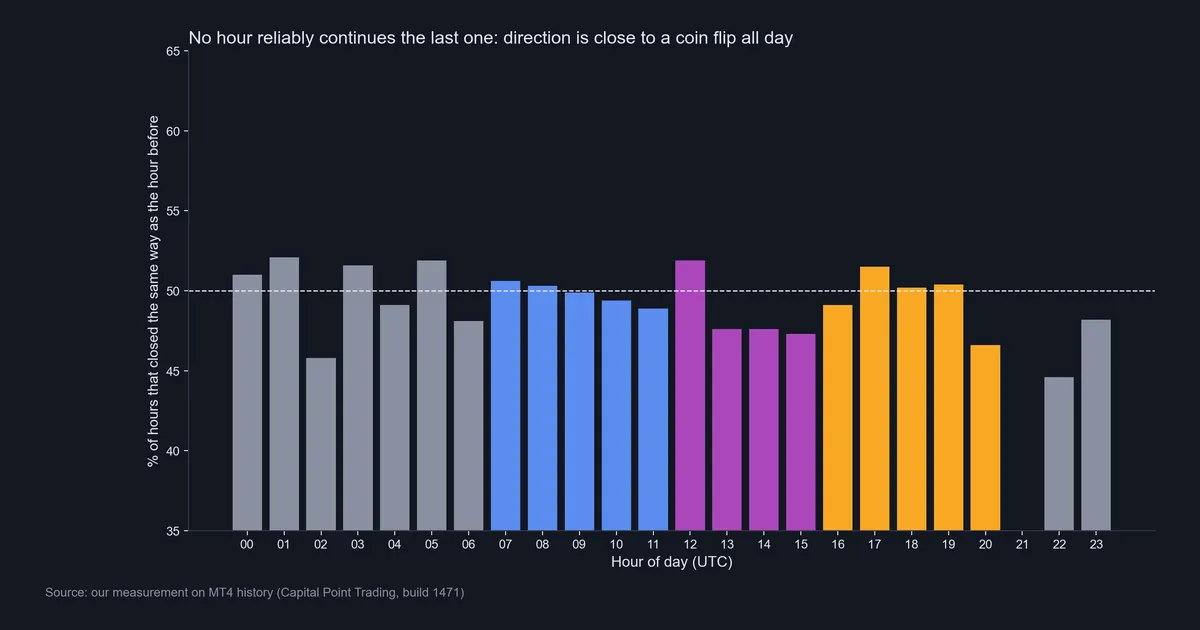
Direction tells a different story. The second chart shows how often an hour closed the same way as the hour before. Every bar sits between 44.6% and 52.1%. That is close to a coin flip in every hour. Even the busy hours of 13:00 to 15:00 sit at 47.3% to 47.6%, slightly below half.
In practice, the clock tells you when bars will be big, but not which way they will go. A rule like “buy the London open” has no support here.
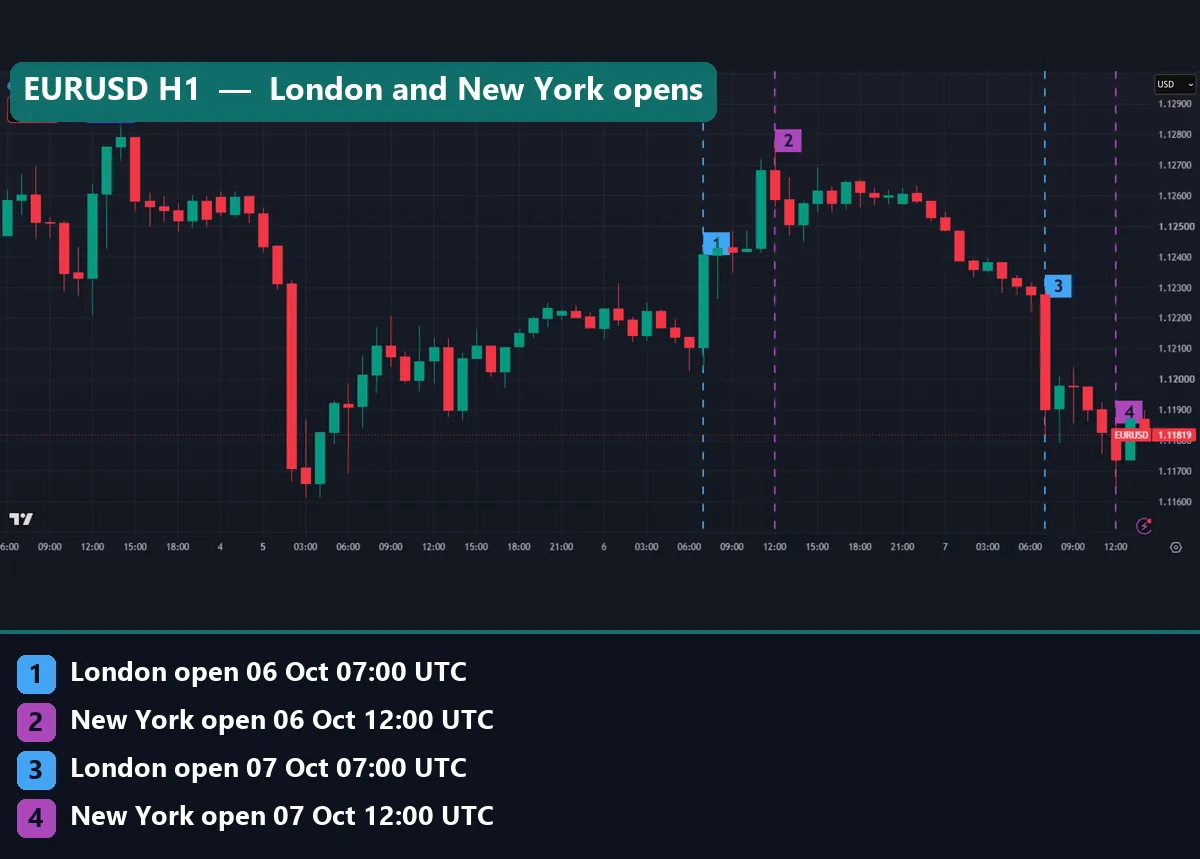
The EURUSD H1 chart puts the averages on real bars. Markers 1 and 3 sit on the London opens of 6 and 7 October. Markers 2 and 4 sit on the New York opens. On both days, the large candles cluster right after a dashed line. The move after London was up on 6 October and down on 7 October.
Worked example: EURUSD on 6 and 7 October 2026
Here are the numbers behind that chart, taken from the OANDA bars. The trading day of 6 October ran from 21:00 UTC on 5 October. Its high was 1.12768 and its low was 1.12028, a range of 74.0 pips. That is above the 62.8-pip median daily range we measured for EURUSD.
Now look at where those extremes printed. The low of 1.12028 came in the 06:00 UTC bar, the hour before London opened. Then the high of 1.12768 came in the 12:00 UTC bar, the hour New York opened. So both ends of the day sat right next to a session hand-off.
The 07:00 UTC bar on 7 October opened at 1.12276, reached 1.12292, fell to 1.11816 and closed at 1.11902. That single hour covered 47.6 pips. In other words, one London-open hour printed about three quarters of a median EURUSD day.
So the session opens are where range appears, but the same open can push either way. Timing set the size of the move, not its sign.
Each pair keeps its own clock
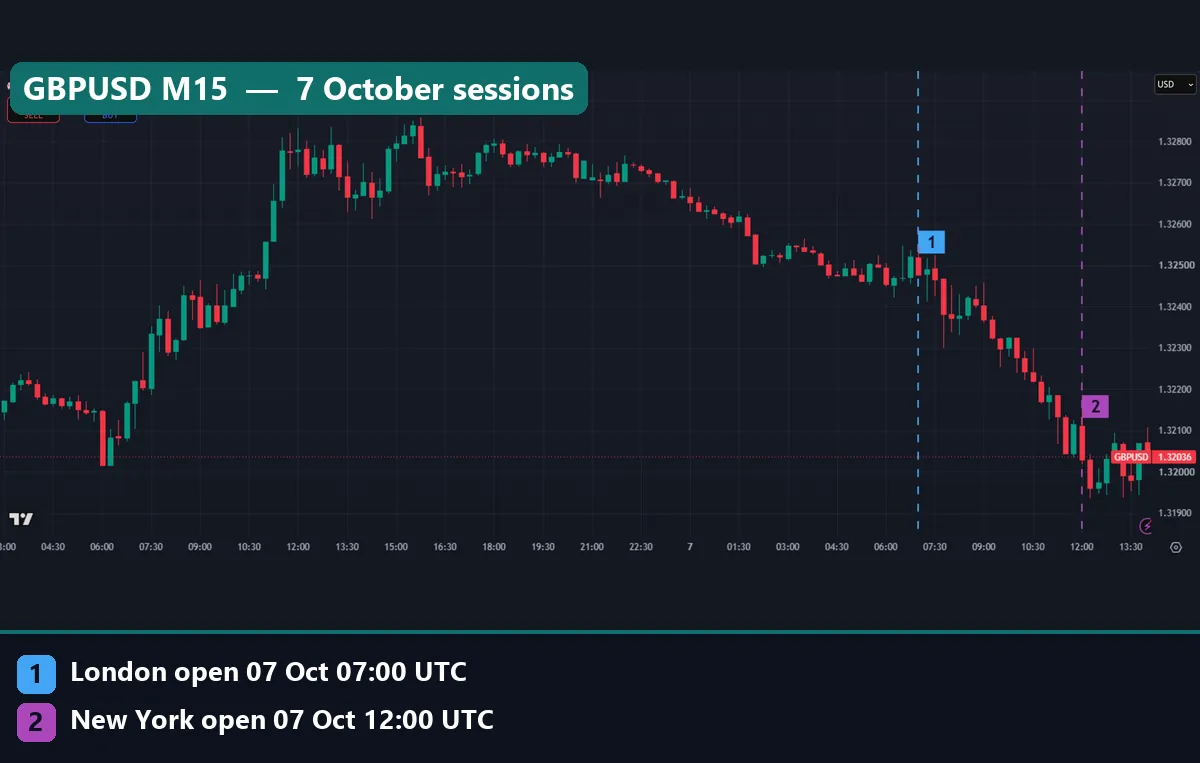
The GBPUSD M15 chart shows 7 October in more detail. Through the Asian hours, cable drifted lower in small bars. After the London line at marker 1, the bars grew and price slid from around 1.3250. The slide carried on into the New York line at marker 2, near 1.3200.
Still, not every symbol follows the EURUSD script. Our heatmap below shows the median bar size per hour for each symbol, with the trading day starting at 21:00 UTC.
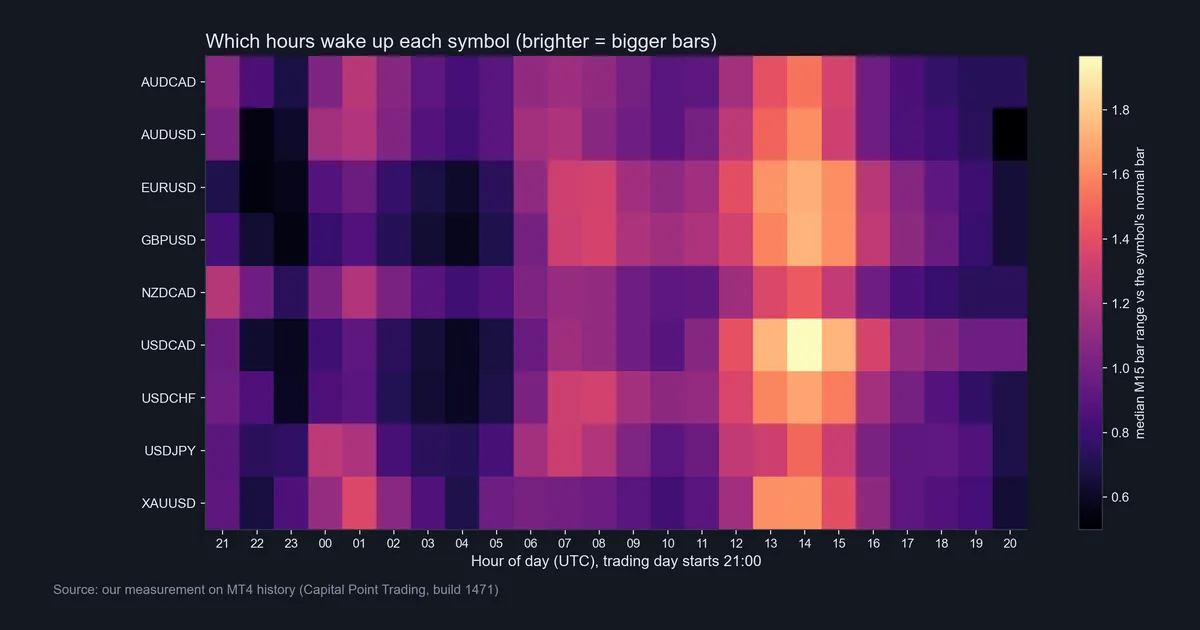
First, every symbol is brightest between 13:00 and 15:00 UTC, and USDCAD has the hottest cell of all at 14:00. Second, AUDCAD, AUDUSD, NZDCAD, USDJPY and XAUUSD wake up at 01:00 UTC, when Tokyo and Sydney are busy. Third, EURUSD and GBPUSD stay dark through most of Asia and only light up at 07:00.
So the right hours depend on what you trade. A euro trader can ignore most of the Asian session. An Aussie or yen trader cannot. Our page on volatile forex pairs compares the pairs by size, and the Asian trading session primer explains why those currencies move early.
Download the complete indicator database
Put these concepts on your charts. One email unlocks the full library of 1,380+ indicators with compiled MT4 and MT5 files, plus my TradingView scripts. No paywall, no spam, unsubscribe any time.
Get free access to my indicator database
One email unlocks 1,380+ free MT4, MT5 and TradingView indicators — the complete library. No single-tool download; you get the whole database.
Where this fails
Session averages are medians. They describe a normal day, and many days are not normal. A central bank decision or a jobs report can make a quiet hour the busiest of the week. The Federal Reserve’s FOMC meeting calendar and the ECB’s monetary policy decisions page list dates that break the usual shape.
Next, the clock shifts twice a year. London and New York change to summer time on different dates. For a few weeks each spring and autumn, the gap between the two opens is shorter or longer than usual.
Also, size cuts both ways. A busy hour can run through a stop just as fast as it reaches a target.
Then there is cost. We measured ranges before spread. Around the 21:00 UTC rollover, spreads often widen, which our page on why spreads widen covers. A small Asian range can vanish into a wide spread. Finally, our sample is one broker feed over fourteen months.
How much of the day is left after lunch
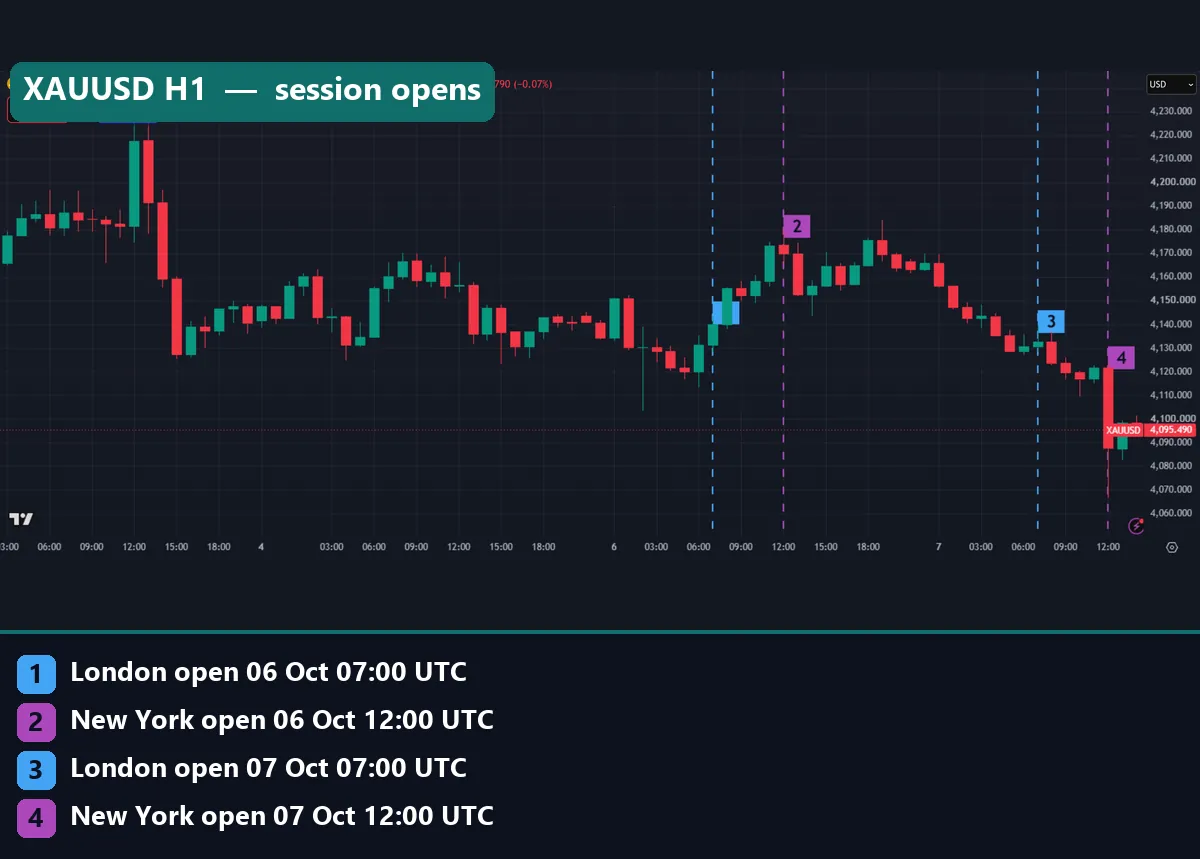
The gold H1 chart shows the same two days on XAUUSD. On 6 October, gold climbed after the London line and topped out near the New York open at marker 2. On 7 October, the biggest bar of the chart came at marker 4, at the New York open, with a wick reaching down toward $4,070. Again the size arrived on schedule, and again the two days moved in different directions.
Our last chart asks a related question. At each hour, how much of the day’s full range has already printed?
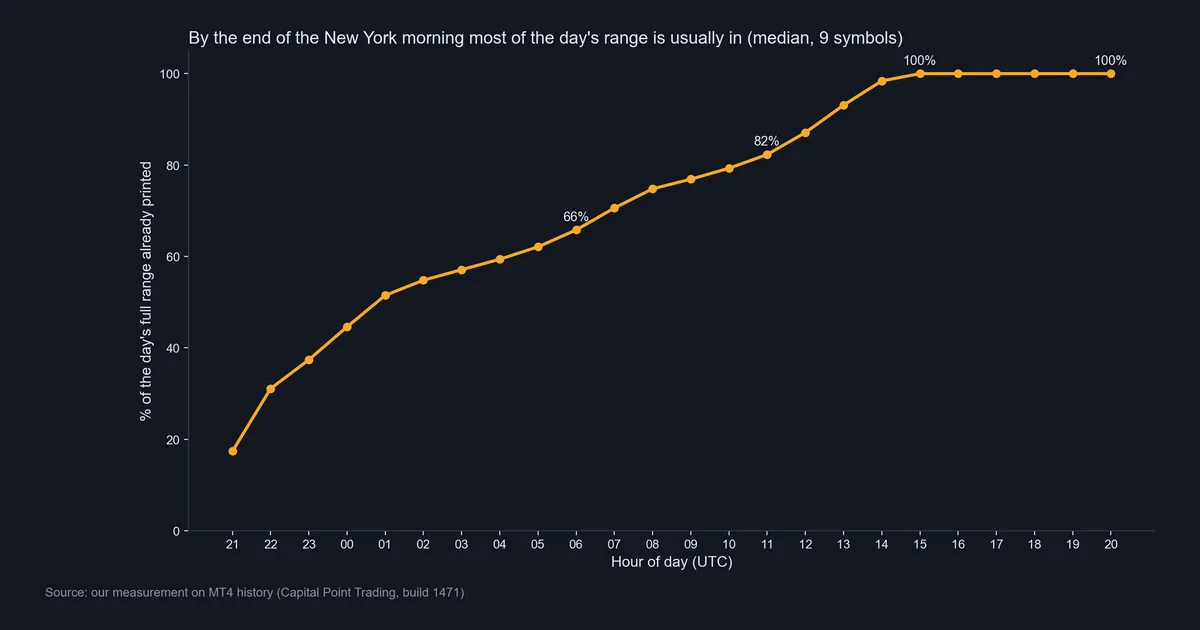
By the end of the 06:00 hour, before London opens, a median of 66% of the day’s range is already in. By the end of 11:00, that figure is 82%. By the end of 15:00, the median reaches 100%. In plain terms, on a typical day, the high and the low are both set by the close of the New York morning.
So if you enter in the late New York afternoon, the median day has little range left to give.
Does the day of the week matter?
A little, but less than the hour. Over the last 750 trading days, EURUSD had a median daily range of 59.8 pips on Monday and 66.7 pips on Thursday. GBPUSD went from 75.6 pips on Monday to 85.2 pips on Thursday. Wednesday and Thursday were the busiest days for both.
That gap of about 12% is small next to the hourly one, where the busiest hour scores more than twice the quietest. So pick your hours first.
Weekends are a separate case. Spot forex stops on Friday evening and reopens on Sunday evening, often with a gap. Our guide to forex trading on the weekend explains what is and is not possible, and the weekend gap page shows how the Sunday open can jump.
Four common timing mistakes
1. Treating an open as a signal. The London and New York opens bring range, not direction. Our same-direction figures stayed between 44.6% and 52.1% in every hour. So an entry needs a reason beyond the time on the clock.
2. Trading the wrong clock for the pair. EURUSD sleeps through most of Asia, while AUDUSD and USDJPY do not. Check the heatmap row for your symbol.
3. Ignoring the calendar. A scheduled release can turn a quiet hour into the busiest one of the week. Check the economic calendar and our list of forex news release times before each session.
4. Chasing a late extreme. The median day has its full range by the end of 15:00 UTC. Waiting until the evening for a breakout means waiting for an unusual day.
Where to go next
If you want the market hours as a live table, start with our forex market hours page. For more on each busy window, read the London trading session and New York trading session primers.
Traders who use ICT ideas can pair this data with our guide to ICT daily profiles. Also, to see the sessions drawn on your own chart, try the market session indicator, and to track how much of the day’s range is used, try the average daily range ADR indicator.
For outside reading, the foreign exchange market article on Wikipedia gives the structure of the market and its main centres.
FAQ
What is the best time of day to trade forex?
For size, the busiest window in our data was 13:00 to 15:00 UTC, when London and New York overlap. The 14:00 hour scored 3.40 times a normal 15-minute bar, the highest of the day.
Is there a time of day when price usually goes up?
Not in our test. Every hour closed the same way as the hour before between 44.6% and 52.1% of the time. So the clock gave no reliable direction.
When is the forex market quietest?
The 04:00 UTC hour was the quietest at 1.42 times a normal 15-minute bar. The hours of 03:00, 20:00 and 23:00 UTC were also low, all under 1.53.
Should I trade the Asian session?
It depends on the pair. AUD, NZD, JPY pairs and gold become active around 01:00 UTC. EURUSD and GBPUSD stay quiet through most of Asia, so the range may not cover your costs.
Which day of the week moves the most?
In our EURUSD and GBPUSD data, Thursday had the largest median range and Monday the smallest. The difference was about 12% on EURUSD, much smaller than the gap between busy and quiet hours.
How much of the daily range is left after the New York open?
By the end of 11:00 UTC, the median day had printed 82% of its full range. By the end of 15:00 UTC, the median reached 100%, so late entries usually have little new range ahead.
Do these times change with daylight saving?
Yes. The London and New York opens shift by one hour in local summer time, on different dates. Our fixed UTC windows blur those weeks a little.
Can timing alone make a trading plan work?
No. Timing tells you when bars are large, which helps with targets and stops. It does not tell you direction, and our results are before spread, swap and commission; results are not guaranteed; past performance is not indicative of future results.
Last updated: 8 October 2026.

About the author
Written by Dominic Walsh, a Forex trader and MT4/MT5 indicator, Expert Advisor and script developer. Every tool on forexmt4systems.com is tested on live charts before release and ships with ready-to-use compiled MT4 (.ex4) and MT5 (.ex5) files. Learn more about the trader and developer behind this site.
How we build, test and correct every tool: Editorial & Testing Policy. Trading carries risk; see the disclaimer.