
ICT daily profiles are templates for where a trading day prints its high and its low, and in which session each one forms. This guide settles one plain question: do the sessions really hold the day’s extremes the way the templates say? We counted 2,170 trading days on nine symbols to find out, and the answer has a twist most traders miss.
What ICT daily profiles are
ICT stands for Inner Circle Trader, a teaching brand built around time and liquidity. If the terms are new, start with our primer on what ICT trading is. A daily profile is a sketch of the day’s shape. It names the session that made the low, the session that made the high, and which came first.
For example, one classic bullish template puts the low in the Asian or London morning and the high in New York. A bearish template flips that. Other templates describe a quiet range first and a large move later. In ICT teaching, the profile goes hand in hand with the ICT daily bias: first you guess the direction, then the profile tells you when the turn is likely.
So a profile is a claim about time, not price. That makes it testable, because every high and low sits in exactly one session.
How a daily profile works
The mechanism is simple bookkeeping. First, fix a day boundary. Next, split the day into sessions. Then find the bar that printed the day’s high and the bar that printed the low. Finally, label the day by the two sessions and their order.
The trap is session length. A ten-hour session will hold more extremes than a four-hour one by pure chance. So a fair reading compares two numbers for each session: its share of highs or lows, and its share of the day’s hours. We use one ratio:
session weight = share of extremes in the session / share of the day's hours in the session
A weight of 1.0 means the session holds exactly the extremes its clock time would predict. Above 1.0, it holds more than its fair share. Below 1.0, it holds fewer. This one step changes the story, because the long Asian window looks dominant on raw counts and ordinary once you adjust for hours.
Our guide to ICT weekly profiles uses the same method with weekdays.
How we tested
We used MT4 terminal history from Capital Point Trading, MetaTrader 4, build 1471. The timeframe was M15, from June 2025 to August 2026. The nine symbols were AUDCAD, AUDUSD, EURUSD, GBPUSD, NZDCAD, USDCAD, USDCHF, USDJPY and XAUUSD. That gave 2,170 usable days.
The day is the server trading day. It starts at 21:00 UTC in summer and 22:00 UTC in winter, which is 17:00 in New York. Our sessions use fixed UTC clocks: Asia 21:00 to 06:59, London 07:00 to 11:59, New York AM 12:00 to 15:59 and New York PM 16:00 to 20:59. We skipped any day with fewer than 80 M15 bars, so holiday stubs did not count.
Days per symbol are uneven. EURUSD has 297 days and AUDCAD has 318, but USDJPY has 99 and AUDUSD has 109. So the pooled result leans on the crosses and the dollar pairs with long history. The chart examples come from the TradingView web chart on OANDA data, captured on 5 October 2026. Our full method rules sit in the editorial testing policy.
The settings behind our count
A daily profile has no indicator inputs, but it does have choices. Each one below moves the result.
| Setting | Our value | Why it matters |
|---|---|---|
| Day boundary | Server day, 21:00 UTC (summer) or 22:00 UTC (winter) | A midnight boundary would move the open and shift extremes between days |
| Asia | 21:00 to 06:59 UTC (10 hours, 41.7% of the day) | Longest window, so it collects extremes by chance |
| London | 07:00 to 11:59 UTC (5 hours, 20.8%) | An extreme at 06:45 UTC counts as Asia, not London |
| New York AM | 12:00 to 15:59 UTC (4 hours, 16.7%) | Holds most US data releases |
| New York PM | 16:00 to 20:59 UTC (5 hours, 20.8%) | Includes the thin hours before the day rolls over |
| Timeframe | M15 | Finer than H1, so ties and near ties split cleanly |
| Minimum bars | 80 M15 bars per day | Drops short holiday sessions |
Reading the session charts: where the high forms
The first chart below shows where the day’s high printed. Each session has two bars. The red bar is its share of highs. The grey bar is its share of the day’s hours.
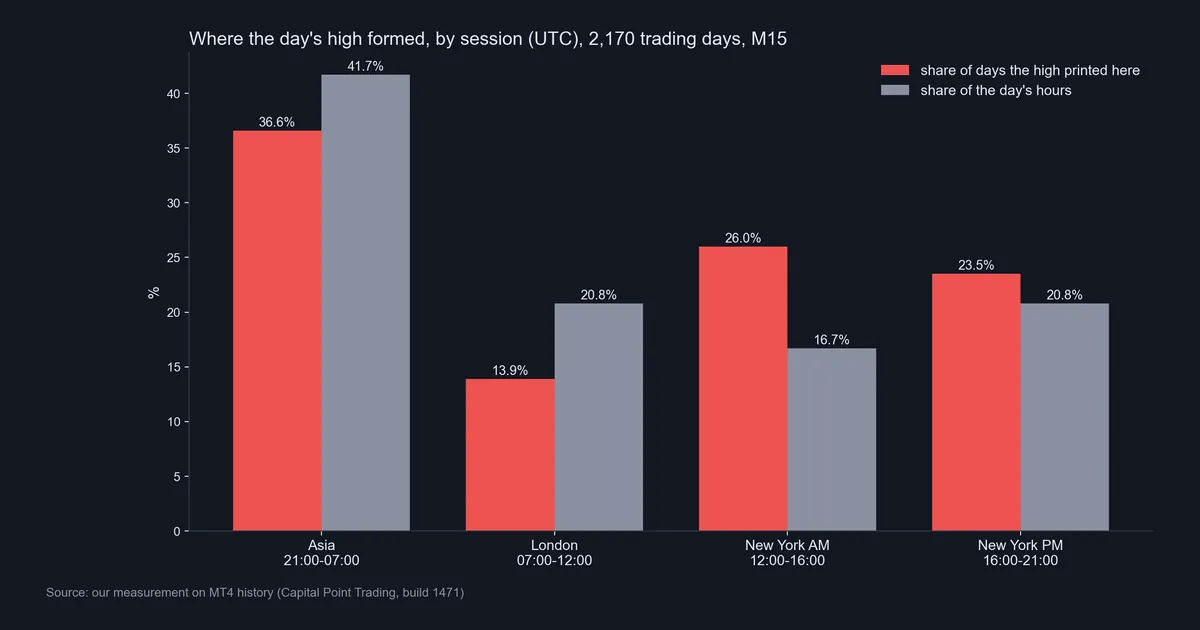
Asia held 36.6% of highs. That sounds large, but Asia is 41.7% of the day, so its weight is about 0.88. London held 13.9% of highs against 20.8% of the hours. That is a weight of about 0.67, the weakest of the four.
New York AM is the standout. It held 26.0% of highs in only 16.7% of the day, a weight near 1.56. New York PM held 23.5% against 20.8%, a weight near 1.13. In short, highs cluster in the New York morning and avoid London.
Many traders expect London to set the high on bearish days. Our count does not support that as a general rule.
Reading the session charts: where the low forms
The second chart repeats the method for the day’s low. The teal bar is the share of lows. The grey bar is again the share of hours.
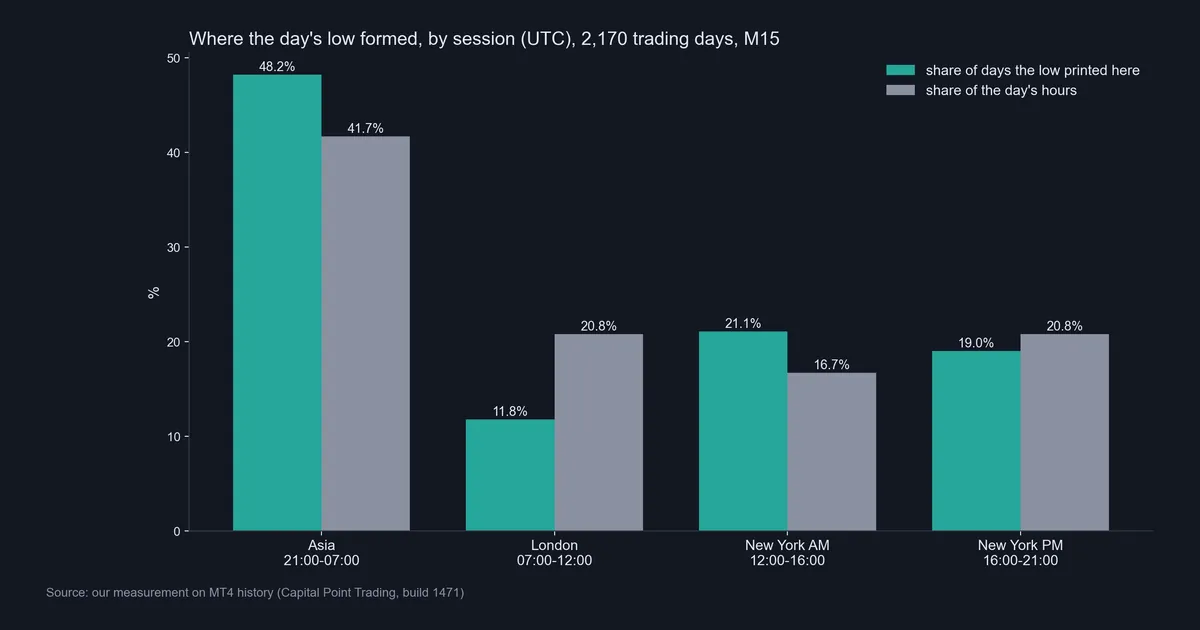
Here Asia leads on both counts. It held 48.2% of lows against 41.7% of the hours, a weight near 1.16. New York AM held 21.1% against 16.7%, a weight near 1.26. New York PM held 19.0% against 20.8%, a weight near 0.91.
London is again the weak spot. It held only 11.8% of lows against 20.8% of the hours. That is a weight near 0.57, the lowest figure in the whole study. So on our data, London held fewer extremes than its hours suggest, for highs and for lows.
Why would that be? We can only offer a reading, not proof. The Asian window opens the day, so the first bars often stand at an extreme by default. Then New York brings US data and the largest moves. London sits between them and often trades inside a range that one side or the other later breaks. See our Asian trading session guide.
Worked example: EURUSD on 1 October 2026
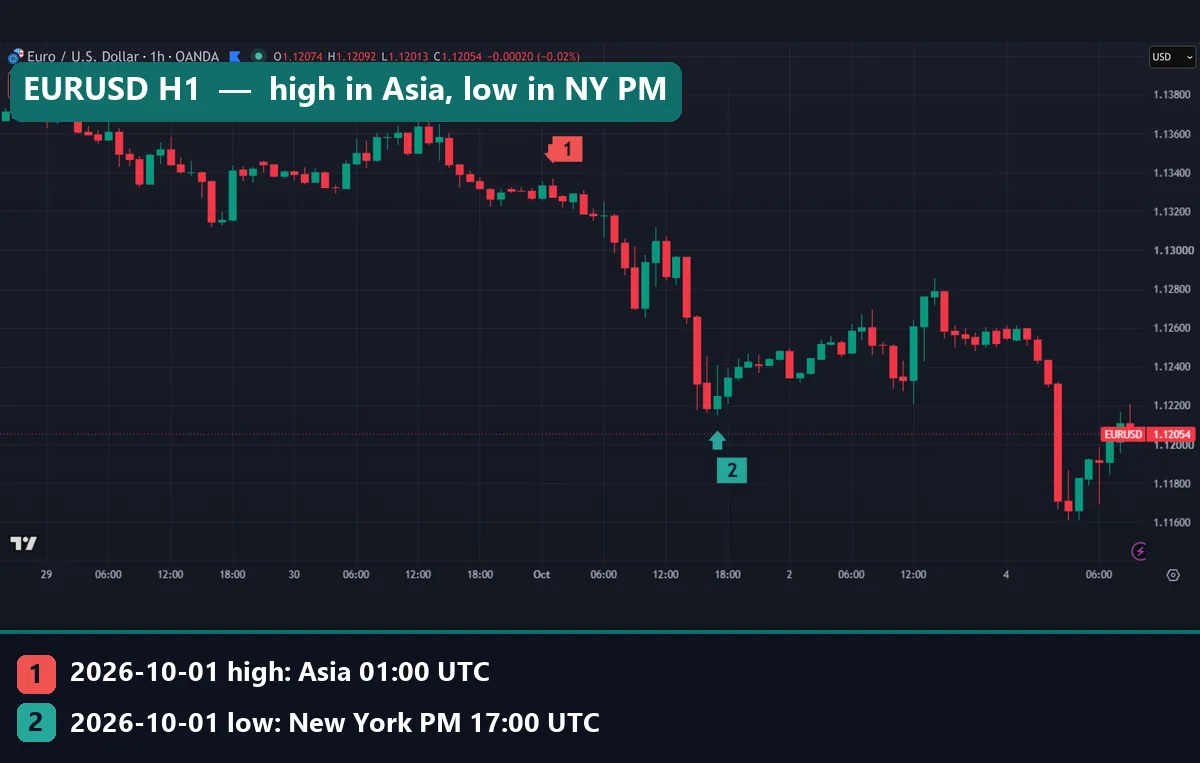
Our opening chart shows EURUSD on the H1 chart for the trading day of 1 October 2026. That day ran from 21:00 UTC on 30 September. Marker 1 is the high at 1.13368, which printed at 01:00 UTC in the Asian session. Marker 2 is the low at 1.12152, which printed at 17:00 UTC in New York PM.
So the day’s range was 121.6 pips. The high came first, early in Asia. Then price ground lower through London and dropped hard into the New York afternoon. On the M15 chart, the same extremes sit at 01:15 UTC and 17:15 UTC.
Now label it. This is a “high in Asia, then low in New York PM” day. That is the fourth most common profile in our count, at 10.9% of days. In other words, a textbook bearish template played out, but you could only name it after 17:00 UTC. At 01:00 UTC the high was just another bar.
The next day changed shape. On 2 October 2026, EURUSD printed its low, 1.12209 at 12:00 UTC, and its high, 1.12855 at 14:00 UTC, both in New York AM.
The eight most common ICT daily profiles in our data
Next we ranked every pairing of low session, high session and order. The chart lists the top eight.
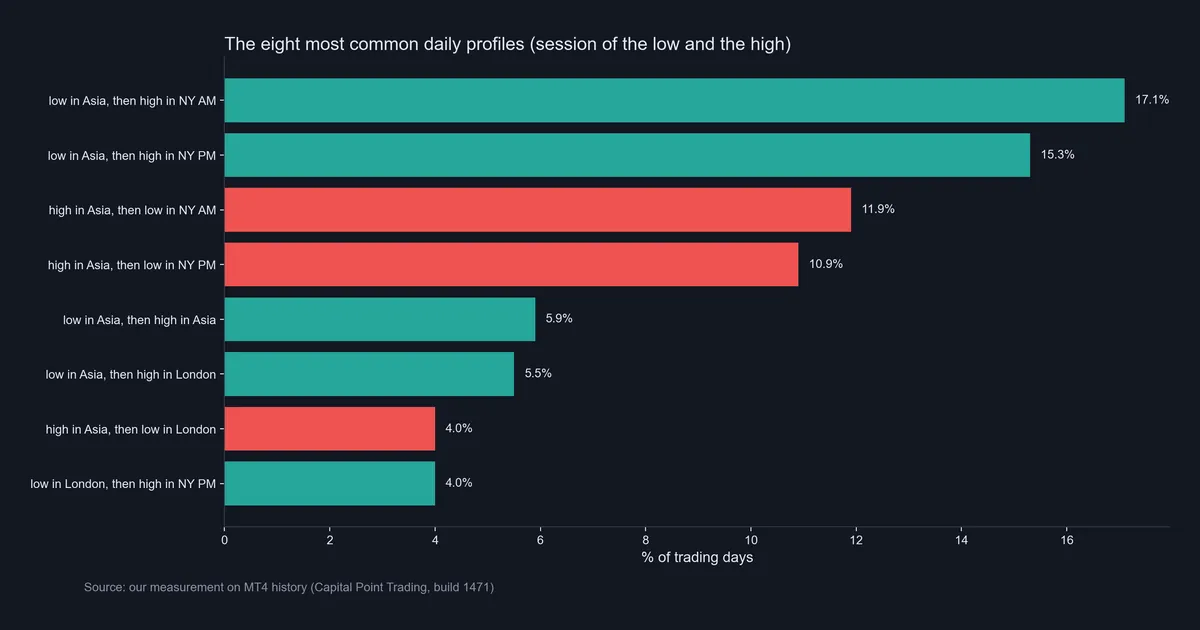
Two profiles lead clearly. “Low in Asia, then high in New York AM” took 17.1% of days. “Low in Asia, then high in New York PM” took 15.3%. Together, an Asian low followed by a New York high covered 32.4% of days. The bearish mirror, a high in Asia and a low in New York AM or PM, covered 11.9% plus 10.9%, or 22.8%.
Still, note what is missing. London appears only three times in the top eight, at 5.5%, 4.0% and 4.0%. The eight together cover 74.6% of days, so about a quarter fall outside them.
Our gold chart for 30 September 2026 is one such day. Marker 1 is the high at 4,219.415 at 12:00 UTC, in New York AM. Marker 2 is the low at 4,147.415 at 18:00 UTC, in New York PM.
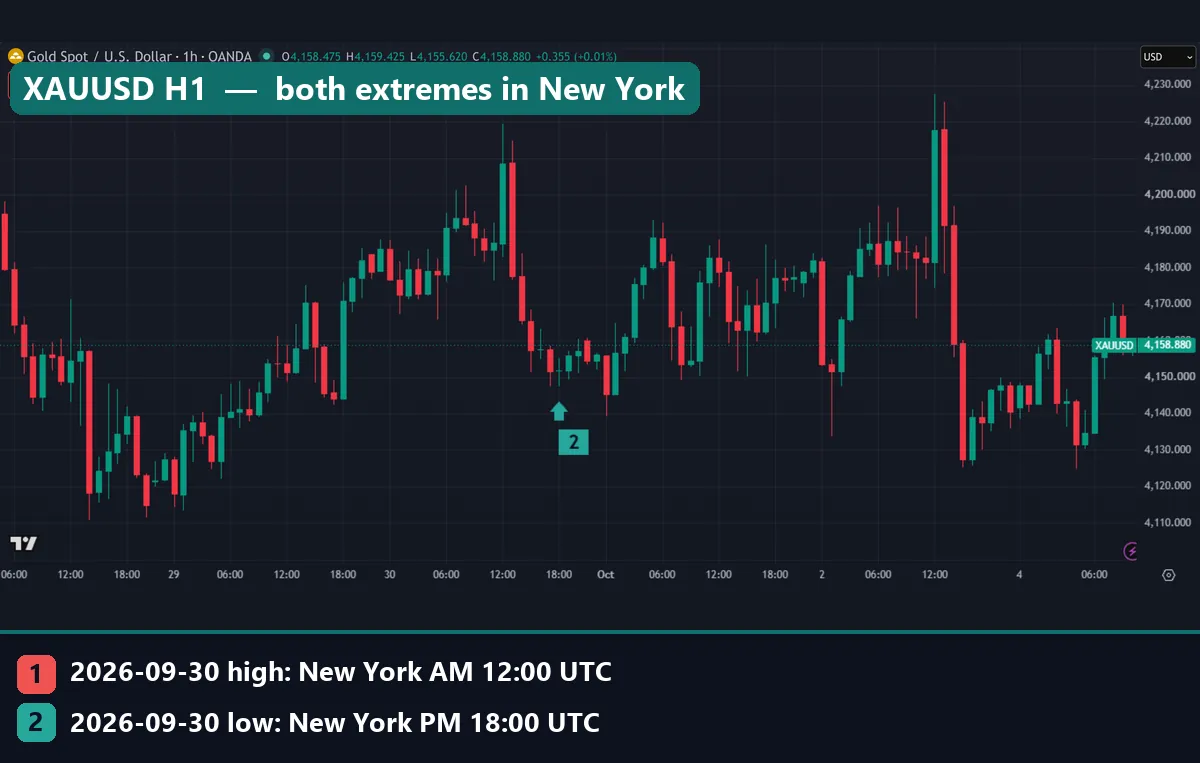
That is a $72.00 range with both extremes in New York. The pairing misses the top eight, yet such days add up.
Download the complete indicator database
Put these concepts on your charts. One email unlocks the full library of 1,380+ indicators with compiled MT4 and MT5 files, plus my TradingView scripts. No paywall, no spam, unsubscribe any time.
Get free access to my indicator database
One email unlocks 1,380+ free MT4, MT5 and TradingView indicators — the complete library. No single-tool download; you get the whole database.
Where it fails
First, every profile is a hindsight label. The day’s low is only the low once the day ends. At any moment, the current extreme can break. Our counts tell you where extremes landed, not where the one you are watching will land.
Second, our session clocks are fixed in UTC. London and New York shift with daylight saving, so for part of the year our windows sit an hour off the local opens. Also, the ICT London kill zone starts before 07:00 UTC in summer, so some of what ICT calls London falls in our Asia bucket. A different split could move several points between sessions.
Third, the Asian window holds the day’s open. The first bars of any day stand at an extreme until price moves away, so long opening windows gain extremes by default. That is part of why Asia leads on lows.
Fourth, the sample is short: about 14 months, and two symbols have fewer than 110 days each. It says nothing about stock indices. Finally, we did not test any trade rule, so these counts say nothing about profit after costs.
Two charts that show the limits
The GBPUSD M15 chart below shows the most common profile in our data. Marker 1 is the high at 1.32562 at 14:30 UTC on 2 October 2026, in New York AM. The low at 1.31815 printed at 01:30 UTC in Asia. Its marker is partly cut off at the bottom edge, but the teal arrow points to it.
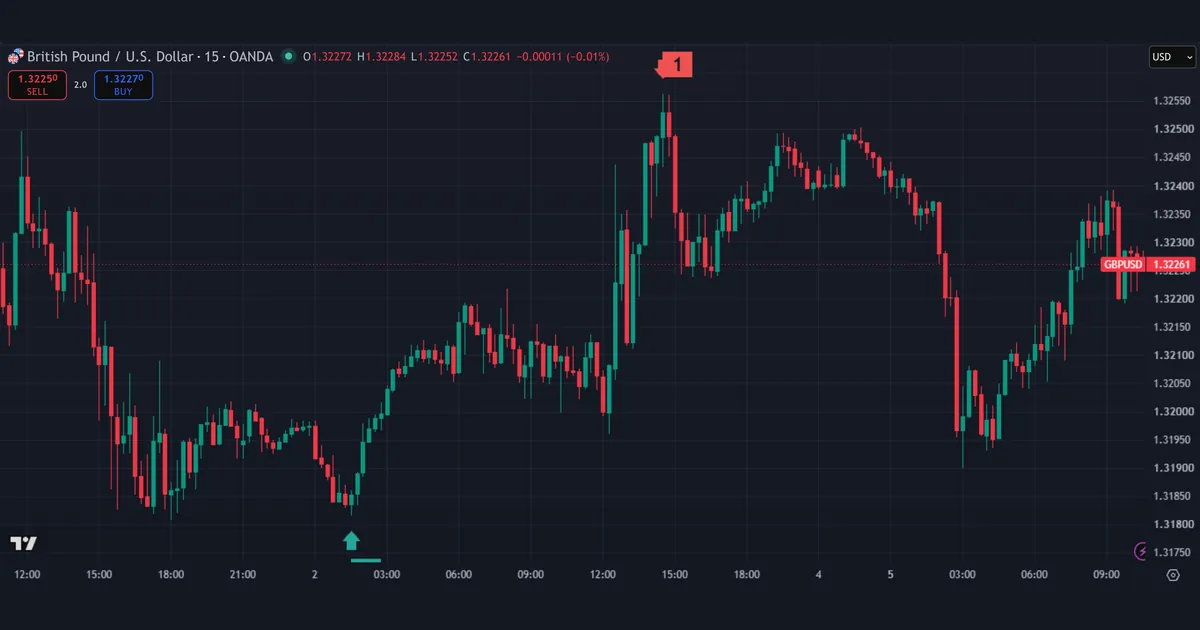
That is a 74.7-pip range and a clean “low in Asia, then high in New York AM” day. Yet the profile took 13 hours to confirm. At 01:30 UTC nothing on the chart said the low was in.
The gold chart below shows the opposite case. On 25 September 2026, XAUUSD printed its high at 4,315.795 at 11:00 UTC, in London. The low came at 4,254.58 at 14:00 UTC, in New York AM, for a range of about $61.22.
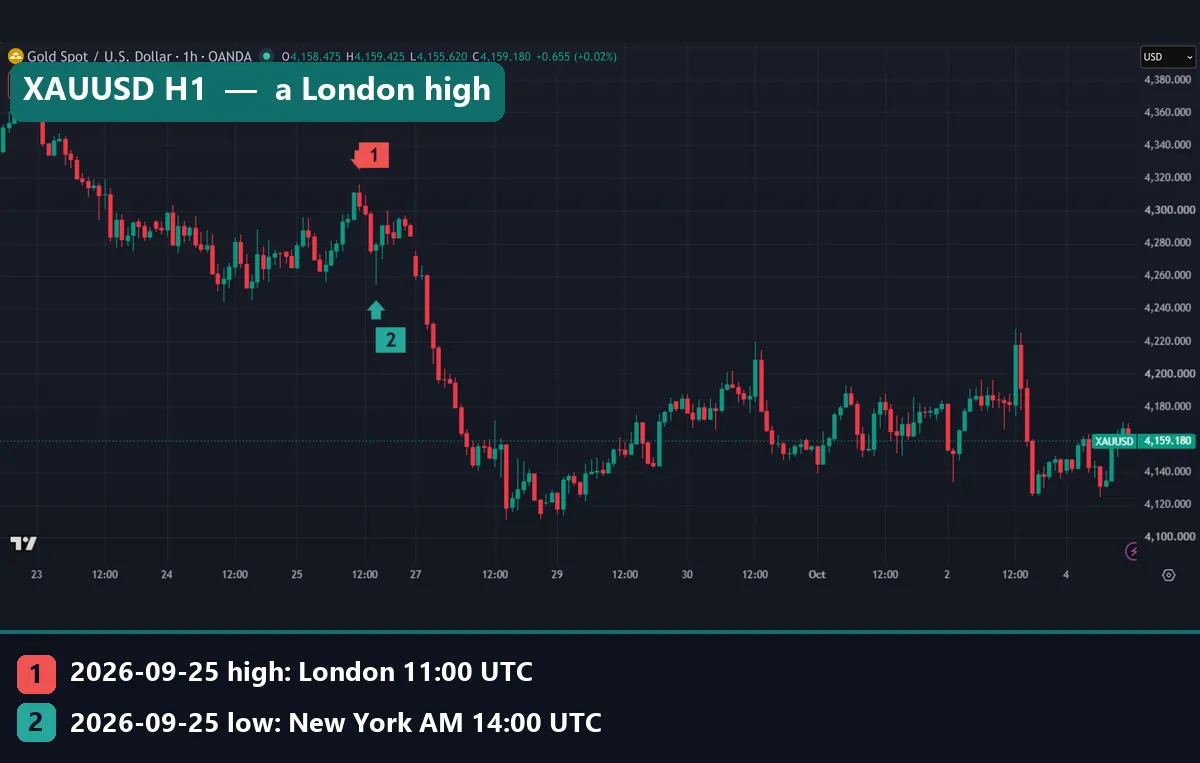
So London did set the high here, which happens on only 13.9% of days in our count. Then the selling carried into the next week. On 28 September, gold’s low reached 4,110.87 at 14:00 UTC. One profile tells you about one day, not about the trend that follows.
Common mistakes with ICT daily profiles
- Reading raw counts as edges. Asia holds the most lows, but it is also the longest window. Always divide by the share of hours before you call a session strong.
- Naming the profile too early. A low at 01:30 UTC is not the day’s low until the day closes. Treat any early label as a guess.
- Mixing clocks. ICT teaches in New York time, many charts show UTC, and MT4 servers often run at UTC+2 or UTC+3. Our forex time zone converter helps you line them up before you count anything.
- Ignoring the days that fit no template. About a quarter of our days fell outside the top eight profiles. Plan for them instead of forcing a label. Our list of SMC trading mistakes covers this habit in more detail.
Where to go next
To set the session windows on your own chart, read our overview of forex trading sessions. Then compare them with the London kill zone and the New York kill zone, since those are the windows ICT stresses. Our ICT times guide converts them to UTC.
For the day boundary, read about the ICT midnight open. For the move that often follows an early extreme, see buy-side and sell-side liquidity. If you want the sessions drawn for you, our ICT session indicator shades them on MT4. For any unfamiliar word, keep the ICT terms glossary open.
Outside our site, the BIS Triennial FX Survey at bis.org shows where FX turnover takes place by country. The sessions page in the TradingView Pine Script docs explains how to code session windows. The forex trading sessions lesson at BabyPips gives a basic map of the hours. The foreign exchange market article on Wikipedia covers how the market runs around the clock.
FAQ: ICT daily profiles
What is an ICT daily profile?
It is a template naming the session that makes the day’s low, the session that makes the high, and their order.
Which session makes the day’s high most often?
Per hour, New York AM leads: it held 26.0% of highs in 16.7% of the day across our 2,170 days.
Does London set the high or low of the day?
Less than its hours suggest: London held 13.9% of highs and 11.8% of lows in 20.8% of the day.
What is the most common daily profile?
In our data, a low in Asia then a high in New York AM, on 17.1% of days.
Why does Asia hold so many lows?
It is the longest window, at ten hours, and it holds the day’s open, where the first bars often stand at an extreme.
Can I trade daily profiles in real time?
Only as a guess, since the high and low confirm at the close, and we did not test any entry rule.
What time zone should I use for sessions?
Pick one clock and keep it; we used UTC, with a server day that starts at 21:00 UTC in summer.
Are ICT daily profiles reliable for trading decisions?
They describe past tendencies, and a quarter of our days fit none of the top eight, so treat them as context; results are not guaranteed; past performance is not indicative of future results.
Last updated: 5 October 2026.

About the author
Written by Dominic Walsh, a Forex trader and MT4/MT5 indicator, Expert Advisor and script developer. Every tool on forexmt4systems.com is tested on live charts before release and ships with ready-to-use compiled MT4 (.ex4) and MT5 (.ex5) files. Learn more about the trader and developer behind this site.
How we build, test and correct every tool: Editorial & Testing Policy. Trading carries risk; see the disclaimer.