
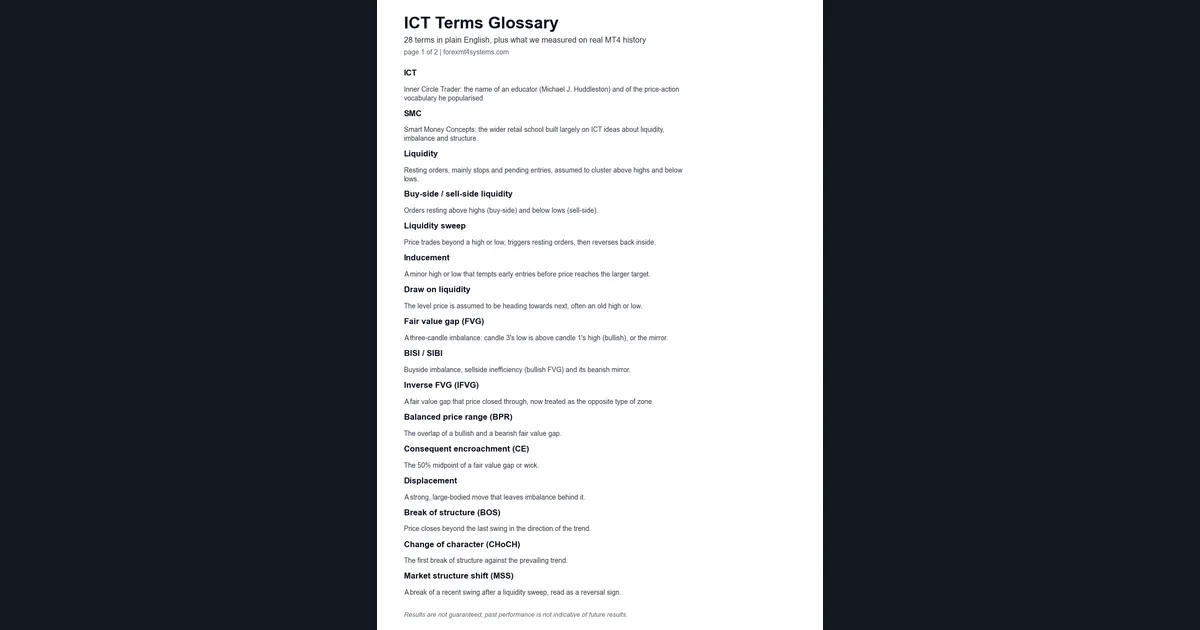
ICT terms are the shorthand that Inner Circle Trader and Smart Money Concepts traders use to name liquidity, gaps, structure, zones and time windows on a chart. This glossary settles what each of the 28 most common terms means in plain English. It also shows what we found when we measured the ones that can be counted. Each term links to its own page where we have one. A free two-page printable PDF of the glossary is available through the form further down.
What ICT terms are and where they come from
ICT stands for Inner Circle Trader. It is the name of an educator, Michael J. Huddleston, and of the price-action vocabulary he made popular. Our primer on what ICT trading is covers the history in more detail.
SMC means Smart Money Concepts. It is the wider retail school built largely on ICT ideas about liquidity, imbalance and structure. The labels differ in places, such as CHoCH versus market structure shift. Our page on ICT vs SMC lists those differences.
How the ICT terms fit together
The vocabulary tells one story in five steps. First, orders rest above highs and below lows. That is liquidity. Next, price runs those orders in a sweep. Then a fast move, called displacement, leaves a gap behind it. After that, price breaks a recent swing, which is the structure step. Finally, traders wait for price to return to a zone during a chosen time window.
A few terms rest on simple math. A bullish fair value gap exists when low[candle 3] > high[candle 1]. The bearish mirror is high[candle 3] < low[candle 1]. Consequent encroachment is the midpoint: CE = (gap high + gap low) / 2. Equilibrium works the same way on a whole range: EQ = (range high + range low) / 2.
The optimal trade entry uses Fibonacci levels. In an up move, the zone runs from high - 0.62 x (high - low) down to high - 0.79 x (high - low). In short, a term with a formula can be counted. A term that needs a trader to pick the swing cannot be counted fairly.
How we tested the ICT terms we could measure
We used MetaTrader 4 history from Capital Point Trading, build 1471. The daily set covers 23 FX pairs from 12 June 2018 to 24 August 2026, a total of 37,748 daily candles. The 15-minute set covers EURUSD, GBPUSD, USDJPY and XAUUSD from July 2025 to August 2026. Our liquidity counts used a wider M15 set of 14 symbols between June 2025 and August 2026. MT4 server time is UTC+3 in summer and UTC+2 in winter, so a “day” here means a server day.
The chart examples come from a TradingView web chart on OANDA data, captured on 1 October 2026, with times in UTC.
We measured gap fills, previous-day sweeps and one sweep-and-reclaim rule. Our editorial testing policy explains how we pick samples and report losers as well as winners.
The measurable parameters behind the glossary
Most ICT terms have no settings. However, the ones we tested needed fixed rules, listed below.
| Term | Parameter | Value we used |
|---|---|---|
| Fair value gap | Minimum gap size | 0.1 x ATR(14); smaller gaps ignored |
| Fair value gap | Fill window | 96 bars on M15, 48 on H1, 20 on D1 |
| FVG “filled” | Fill level | Price trades back to the far edge |
| Consequent encroachment | Midpoint touch | 50% of the gap |
| Previous-day high / low | Day boundary | MT4 server midnight |
| Sweep and reclaim | Trigger | M15 bar trades beyond the level, then closes back inside |
| Sweep rule | Trading hours | Server 07:00 to 16:59, flat at 20:00 |
| Sweep rule | Stop and target | Sweep extreme plus 1 pip; 1R and 2R targets |
Imbalance terms: FVG, BISI, SIBI, IFVG, BPR and CE
Fair value gap (FVG). A three-candle imbalance. The third candle’s low sits above the first candle’s high in a bullish gap, or the mirror in a bearish one. Our guides to the bullish FVG and the bearish FVG go deeper.
BISI / SIBI. Buyside imbalance, sellside inefficiency is ICT’s name for a bullish FVG. Sellside imbalance, buyside inefficiency is the bearish one.
Inverse FVG (IFVG). A gap that price closed through, now read as the opposite type of zone. See inversion FVG for the full rules.
Balanced price range (BPR). The overlap of a bullish and a bearish gap. Our balanced price range page shows how to draw it.
Consequent encroachment (CE). The 50% midpoint of a gap or a wick.
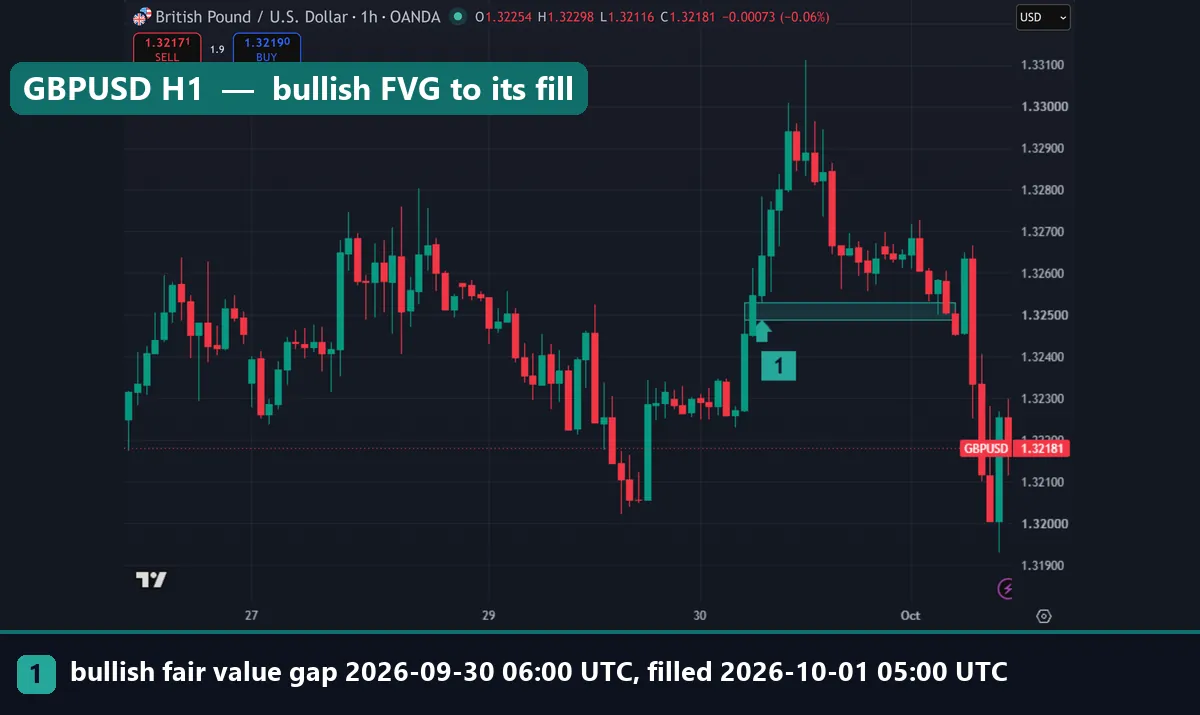
What did we measure? On M15 we found 14,385 gaps in 85,399 bars. Price filled 87.5% of them within 24 hours. On H1 it filled 80.4% of 3,304 gaps within 48 bars. On D1, across 23 pairs, it filled 72.7% of 5,361 gaps within 20 days. The midpoint got touched even more often: 90.4%, 84.8% and 78.7%. That said, most gaps are tiny. The median size was 3.6 pips on M15 and 7.8 pips on H1, so price often refills them by plain noise.
Liquidity terms: sweeps, inducement and the draw
Liquidity. Resting orders, mainly stops and pending entries, that traders assume cluster above highs and below lows. Our guide to liquidity in trading covers the idea, and the order book entry on Wikipedia explains how resting orders queue in a real market.
Buy-side / sell-side liquidity. Orders above highs are buy-side. Orders below lows are sell-side. Read more on buy-side and sell-side liquidity.
Liquidity sweep. Price trades beyond a high or low, triggers the orders there, then turns back inside. Our liquidity sweep example walks through one.
Inducement. A minor high or low that tempts early entries before price reaches the bigger target. See inducement in trading.
Draw on liquidity. The level price seems to be heading for next, often an old high or low. Our page on the draw on liquidity has examples.
Previous-day high / low. Yesterday’s extremes. They are the most common liquidity levels in ICT charts.
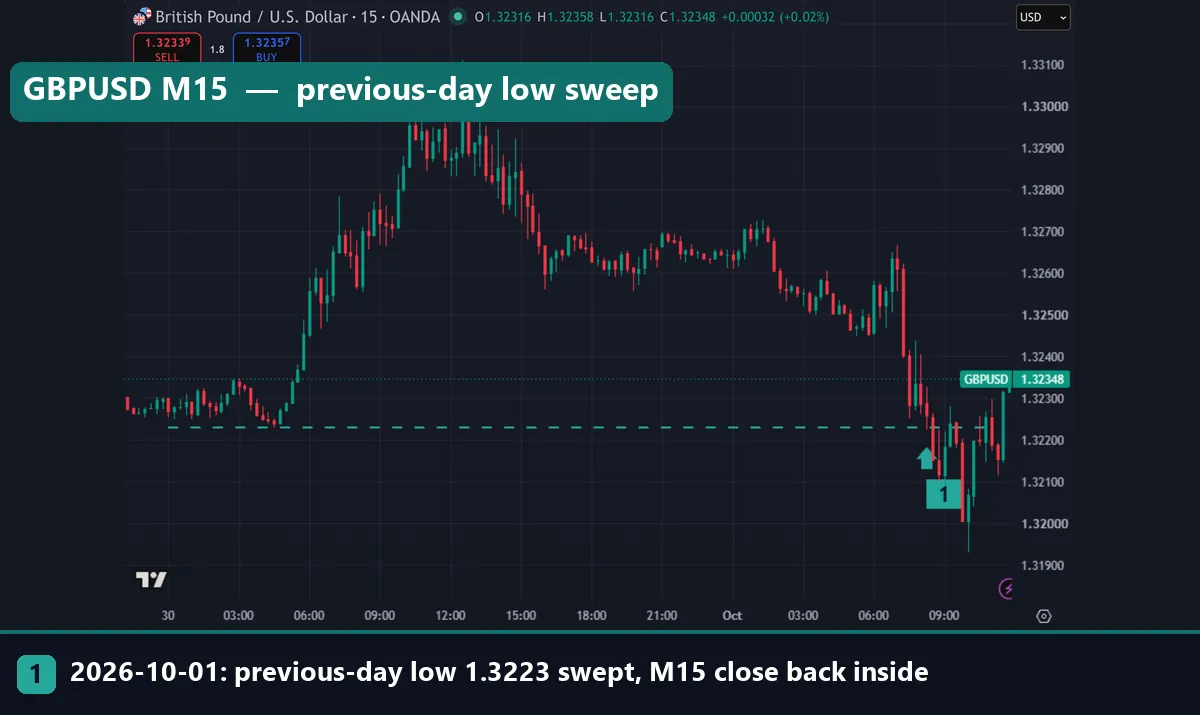
In the image above, the dashed line marks the GBPUSD previous-day low at 1.32230. At 08:15 UTC on 1 October 2026, an M15 bar traded below it and then closed at 1.32260, back inside. By definition that is a sweep. Still, the label says nothing about what comes next.
Worked example: one GBPUSD gap from start to fill
Here is the H1 gap from the earlier chart. On 30 September 2026, the three hourly candles from 06:00 to 08:00 UTC left a bullish gap. Its low edge sat at 1.32488 and its high edge at 1.32530. So the gap measured 4.2 pips, a little over half the 7.8-pip median we saw on MT4 H1 data.
Next, the midpoint. CE is (1.32530 + 1.32488) / 2, which gives 1.32509, the first level an ICT trader would watch.
At 07:30 UTC the same morning, price had already swept the previous-day high at 1.32557 and closed back at 1.32530 on M15. Then GBPUSD rallied to the day’s high anyway. In other words, the sweep did not mark a top.
Finally, the fill. Price came back to the low edge of the gap at 05:00 UTC on 1 October, 21 hours after the third candle closed. That fits inside our 48-bar H1 window, so our count would score it as filled. However, the gap did not hold as support. By the time we took the screenshot, GBPUSD traded at 1.32181, well below the zone. A filled gap and a working trade are not the same thing.
Structure terms: displacement, BOS, CHoCH and MSS
Displacement. A strong, large-bodied move that leaves an imbalance behind it. Our page on displacement in trading shows how traders judge “large”.
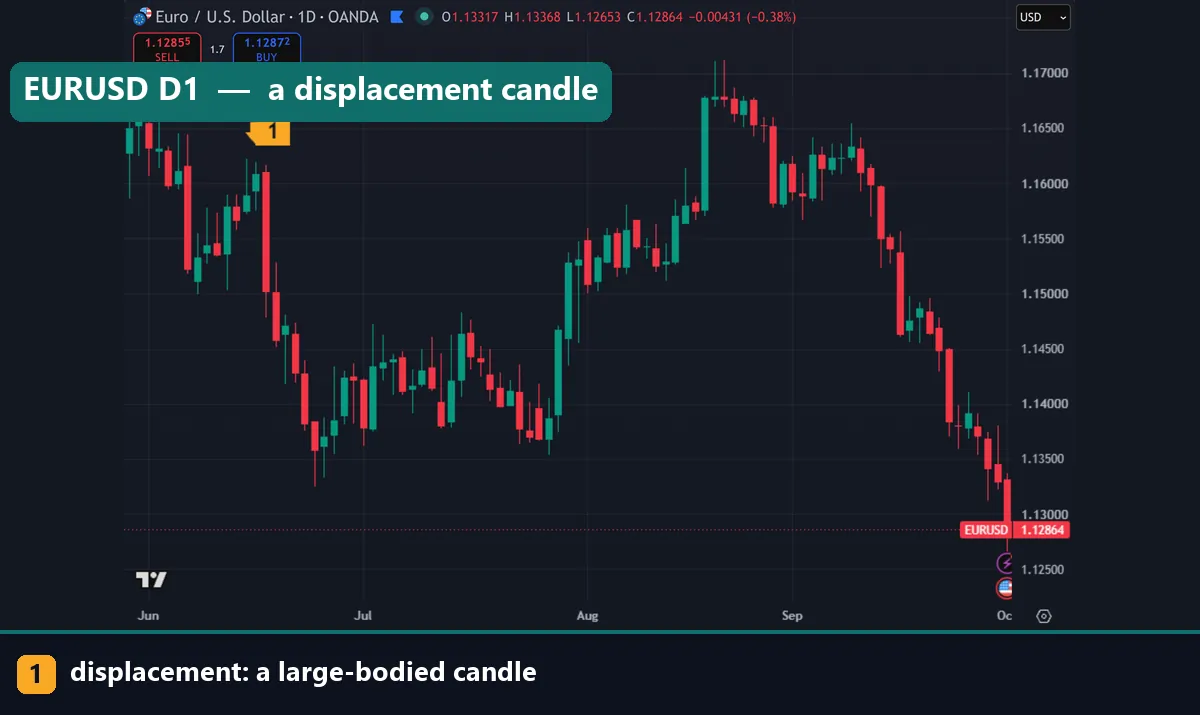
The marked EURUSD daily candle in mid-June is the kind of bar people mean. Its body runs from roughly 1.161 to roughly 1.150, far larger than the candles around it. But there is no fixed size rule.
Break of structure (BOS). Price closes beyond the last swing in the direction of the trend.
Change of character (CHoCH). The first break of structure against the trend. Our BOS vs CHoCH page compares the two side by side.
Market structure shift (MSS). A break of a recent swing right after a liquidity sweep, read as a sign of reversal. See market structure shift for the ICT version. All three depend on which swing you call “the” swing, so we did not test them.
Zone terms: order blocks, breakers and premium vs discount
Order block. The last opposite-colour candle before a displacement move. Our comparison of the fair value gap vs order block shows where the two overlap.
Breaker block. A failed order block that price broke through, then used from the other side. See breaker block.
Mitigation block. A failed swing without a sweep, revisited as a zone. Our mitigation block page shows how it differs from a breaker.
Premium / discount. The upper and lower halves of a range. ICT traders favour buys in discount and sells in premium. Read premium and discount for examples.
Equilibrium. The 50% level of a dealing range.
Dealing range. The high-to-low range a setup is measured inside. Our ICT dealing range page covers how to pick one.
Optimal trade entry (OTE). A pullback into the 62% to 79% retracement of a swing. See optimal trade entry.
Time terms: kill zones, silver bullet, PO3 and opening gaps
Kill zones. Session windows (Asian, London and New York) when ICT traders look for setups. We cover the London kill zone and the New York kill zone separately. For context on why those hours are busy, the BIS Triennial FX Survey shows where FX turnover is booked.
Silver bullet. A one-hour ICT time window strategy built around a fair value gap. Our ICT silver bullet strategy page shows the windows on a chart.
Power of three (PO3 / AMD). Accumulation, manipulation, distribution: a template for a day or a session. See accumulation, manipulation, distribution.
NWOG / NDOG. New week and new day opening gap: the gap between one period’s close and the next period’s open. Our new week opening gap page shows how to mark it. For the classic chart view of gaps, see gaps and gap analysis at StockCharts ChartSchool.
What our sweep counts say about liquidity
ICT teaching treats the previous day’s high and low as magnets. So we counted how often price actually reached them.
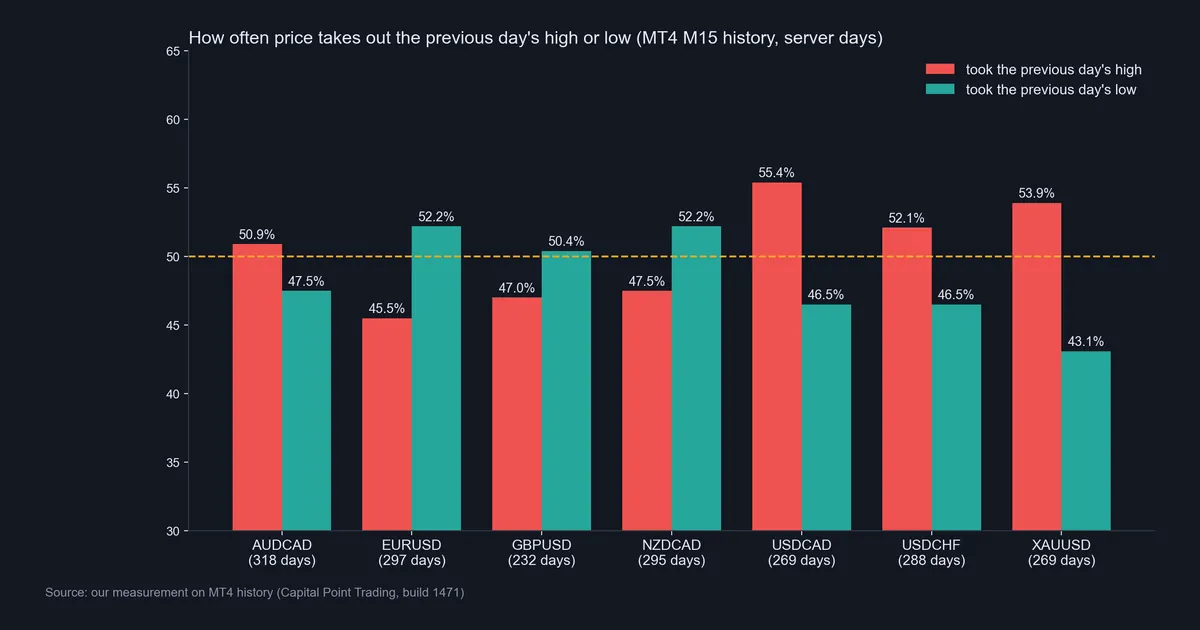
On EURUSD, price took the previous day’s high on 45.5% of 297 days and the low on 52.2%. USDCAD took the high on 55.4% of 269 days. XAUUSD took the high on 53.9% of 269 days but the low on only 43.1%. In short, each side gets hit about half the time.
Does a sweep predict a turn? After EURUSD swept the prior high, it closed back below it 51.9% of the time. That is close to a coin flip. Then we tested a rule. Buy when an M15 bar sweeps the prior-day low and closes back above it, with the stop under the sweep. Sell the mirror at the high. Before costs, it lost on all five symbols we ran. EURUSD lost 4.54R over 170 trades at a 1R target. GBPUSD lost 3.39R over 141 trades. USDCAD lost 23.04R over 166. USDCHF lost 22.32R over 181. XAUUSD lost 25.9R over 128. The 2R target lost on all five as well.
All of these numbers sit in the free two-page ICT terms PDF, next to the 28 definitions. Enter your email in the form below and we will send it to you.
Download the complete indicator database
Put these concepts on your charts. One email unlocks the full library of 1,380+ indicators with compiled MT4 and MT5 files, plus my TradingView scripts. No paywall, no spam, unsubscribe any time.
Download this glossary free
Enter your email and the file is yours. You also get the full MT4 and MT5 library.
Where it fails: the limits of ICT terms
The biggest problem is hindsight. A sweep is only a sweep once price turns back, and an order block only counts once the displacement has happened.
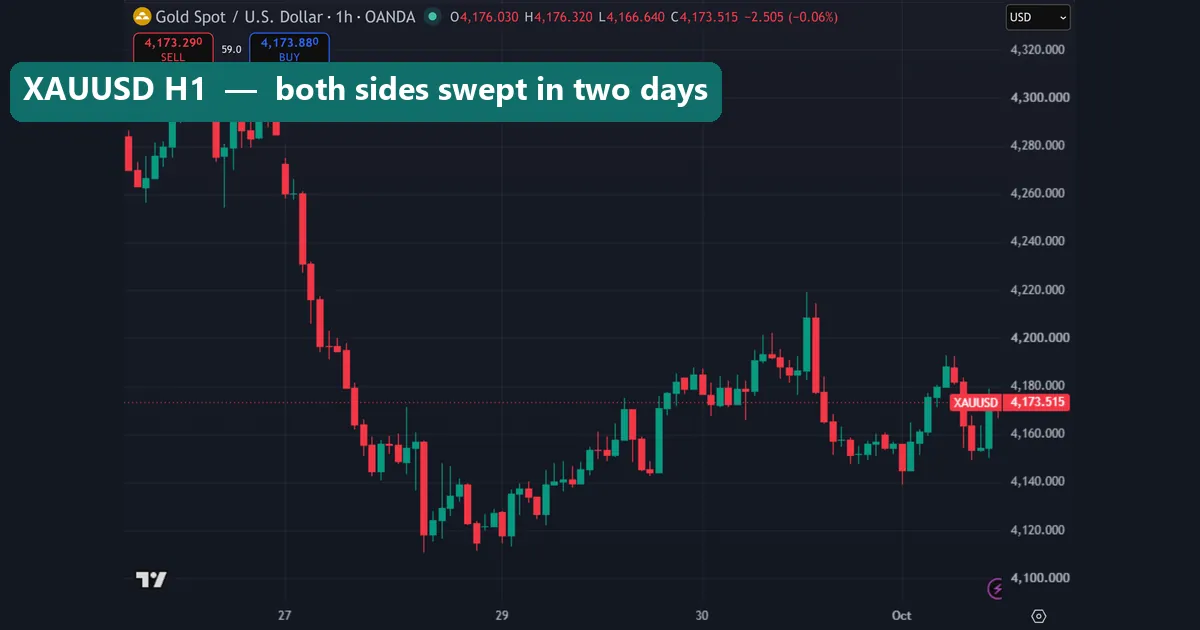
Gold shows this well. On 30 September, XAUUSD traded above the previous-day high at 4,187.68 and closed back below at 4,186.04 on M15. That looks like a bearish sweep. Yet early on 1 October it also swept the previous-day low at 4,147.415 and closed back at 4,159.67. Both sides were “swept” inside two days. So the label on its own picks no direction.
Second, zones depend on the frame you choose.
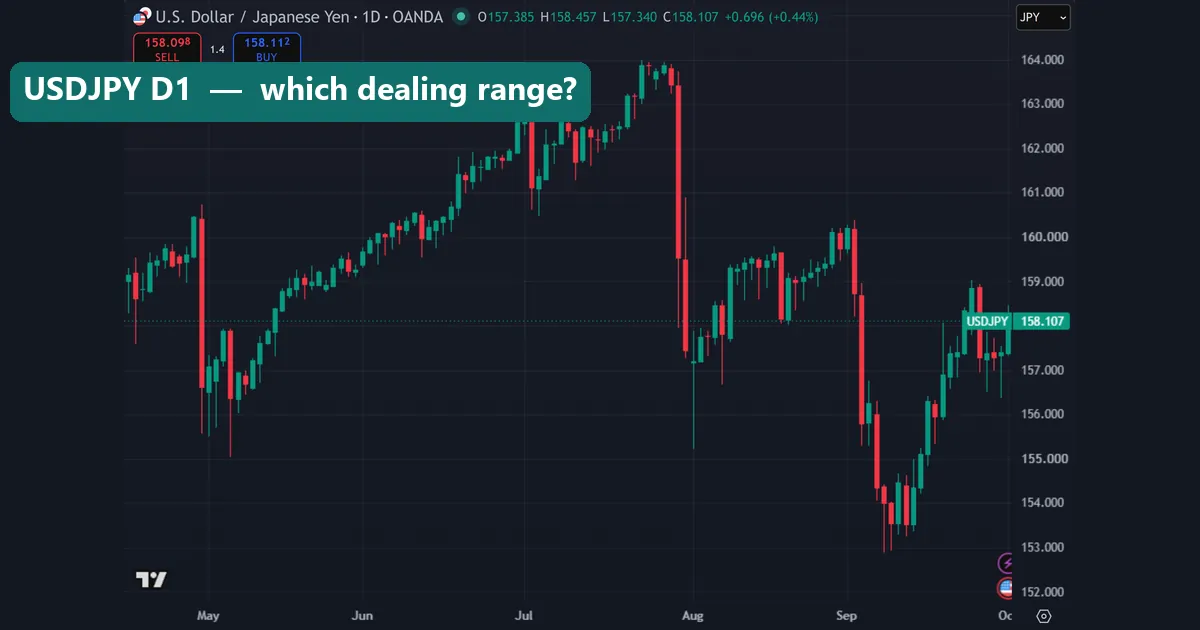
On the USDJPY daily chart, the top of the range sits near 164 in late July and the bottom near 153 in September. If you use those two points, equilibrium is near 158.5. However, pick the early-September high near 160 instead, and the “discount” zone moves. Neither choice is wrong, which is the problem. Third, our sweep rule lost before spread and commission, and costs would make every result worse. The NFA’s investor guide to trading forex is a sober read on those costs and risks.
Four common mistakes with ICT terms
- Treating a definition as a signal. A gap, a sweep or an order block is a description. A clean definition can still lose money.
- Quoting fill rates without size. An 87.5% fill rate sounds strong. But the median M15 gap was 3.6 pips.
- Moving the range after the fact. If you redraw the dealing range until price sits in discount, the premium and discount idea stops meaning anything.
- Mixing up near-twins. CHoCH and MSS, breaker and mitigation block, BISI and FVG are close cousins. Pick one definition and keep it. Our list of SMC trading mistakes covers more.
Where to go next
For a broader frame, read market structure in forex and the comparison of IFVG vs FVG. If you work the time windows, our page on ICT times lists the hours, and the ICT Fibonacci settings guide sets up the OTE levels. Then test one term at a time on your own history.
FAQ about ICT terms
What does ICT stand for in trading?
ICT stands for Inner Circle Trader, the brand of educator Michael J. Huddleston and his price-action vocabulary.
Is ICT the same as SMC?
Not quite, because SMC is the wider retail school that grew largely out of ICT ideas, and a few labels differ.
What is a fair value gap in plain English?
It is a three-candle pattern where the first and third candles never overlap, which leaves a price gap.
How often do fair value gaps fill?
In our MT4 data, 87.5% of 14,385 M15 gaps filled within 24 hours and 72.7% of 5,361 daily gaps filled within 20 days,
What is the difference between BOS and CHoCH?
A BOS breaks a swing in the direction of the trend, while a CHoCH is the first break against it, so it hints that the trend may be turning.
What is consequent encroachment?
It is the 50% midpoint of a fair value gap or a wick.
Does a liquidity sweep mean price will reverse?
Not on its own, since EURUSD closed back below a swept prior high only 51.9% of the time in our sample, close to a coin flip.
Can I trade ICT terms as a system?
You can test them, but our simple sweep-and-reclaim rule lost on all five symbols before costs, so treat the terms as a language rather than a strategy; results are not guaranteed; past performance is not indicative of future results.
Last updated: 1 October 2026.

About the author
Written by Dominic Walsh, a Forex trader and MT4/MT5 indicator, Expert Advisor and script developer. Every tool on forexmt4systems.com is tested on live charts before release and ships with ready-to-use compiled MT4 (.ex4) and MT5 (.ex5) files. Learn more about the trader and developer behind this site.
How we build, test and correct every tool: Editorial & Testing Policy. Trading carries risk; see the disclaimer.