
Indices are calculated numbers that track a basket of share prices, and you cannot buy one directly. This guide settles three questions: what an index is, how its weighting rule changes what it measures, and what “index trading” means when most retail accounts hold a CFD or a future. We also measured ten index CFDs side by side, because the one word covers very different daily behaviour.
What indices actually are
An index is a list plus a rule. An owner picks the members, sets the weights, and publishes one number that sums them up. That number has no shares behind it, no bid and no ask. So it works more like a thermometer reading than a product.
The list alone tells you a lot. For example, Nasdaq’s Nasdaq-100 index methodology defines its index as 100 of the largest Nasdaq-listed non-financial companies. Banks stay out by rule, however large they grow, so it is not a gauge of the whole US market.
Not every index holds shares, either. The US dollar index follows a basket of currencies. In this guide, “indices” means stock indices.
How indices are calculated: price weight and cap weight
Two families cover most of what traders meet. The first adds up share prices and divides by a divisor.
Price-weighted index = sum of member share prices / divisor
The second adds up company values instead.
Cap-weighted index = sum of (share price x shares counted) / divisor
The divisor keeps the level steady when the list changes. For example, Alphabet replaced Verizon in the Dow on 29 June 2026, and the divisor changed that day. S&P Dow Jones Indices’ press release on that Dow change says the Dow is price weighted, so persistently lower-priced stocks have an immaterial impact. It adds that Verizon made up only one-half of one percentage point, because of its lower share price.
Cap weight works the other way. State Street’s S&P 500 fund page describes the S&P 500 as float-adjusted market capitalization weighted. Float means that only shares open to public investors count. So company value decides influence. A stock split changes nothing there, because the price falls as the share count rises. However, the same split shrinks that share’s pull in a price-weighted index.
Many owners add limits on top. Nasdaq calls its scheme modified market capitalization weighting: at a review, any company above 24% gets cut back to 20%. Similarly, STOXX’s DAX index page says it caps any one share at 15%.
Why index trading means a CFD or a future
You always trade something that follows the number, and three routes exist.
- Index fund or ETF. It holds the member shares, or a close sample, and you own units of the fund.
- Future. This is an exchange-traded contract with an expiry date. See our guides to Dow Jones futures on TradingView and Nasdaq 100 futures on TradingView.
- CFD. This is a contract with a provider that settles the price difference. You own no shares, and our guide to CFDs covers the mechanics.
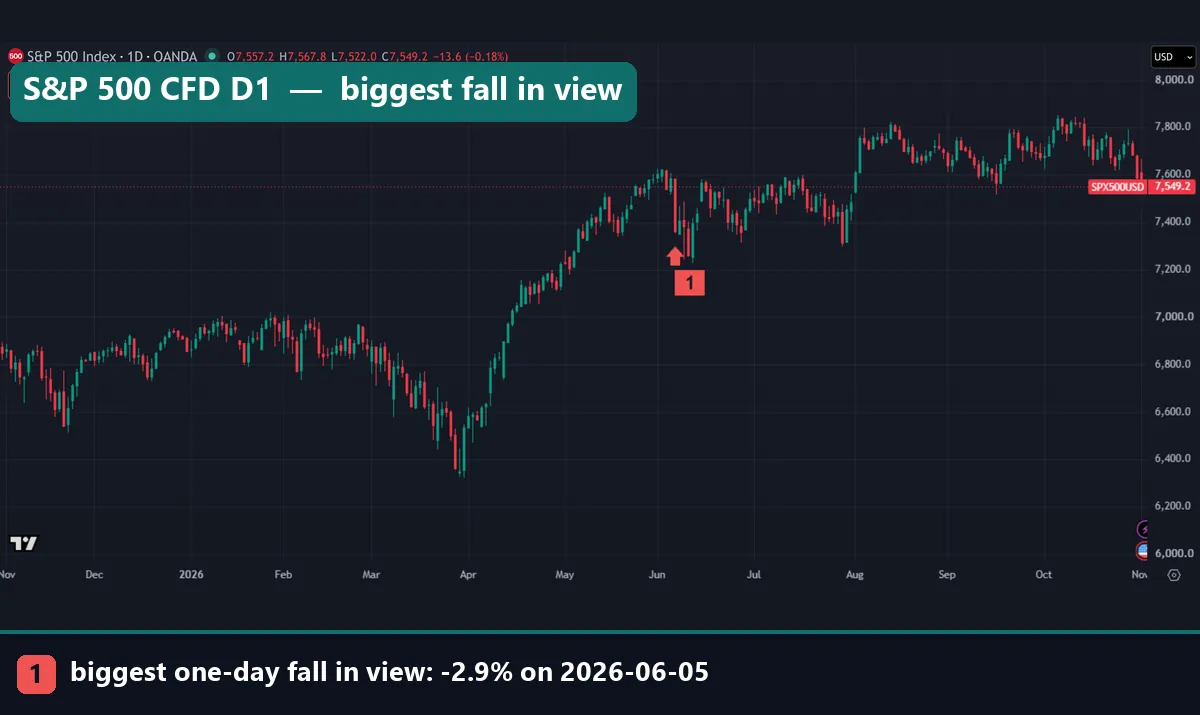
Most retail index trading uses the last two, because both let you go long or short on a margin deposit. But a CFD is not the index itself, and it is not an index fund. Look at the top left of the S&P 500 chart above. The SELL and BUY boxes show 7,549.0 and 7,549.5, and a calculated index has no such quotes. So that chart shows a provider’s price that follows the index.
How we tested these index CFDs
We measured ten OANDA index CFDs on the TradingView web chart: SPX500USD, NAS100USD, US30USD, DE30EUR, UK100GBP, FR40EUR, EU50EUR, JP225USD, HK33HKD and AU200AUD. We pulled the bars on 3 November 2026. Daily range uses the last 750 daily bars, and weekend gaps use the last 150 weekends. Correlations run from January 2023 to November 2026.
Hourly windows differ by symbol, and all end on 3 November 2026. The US indices and Japan start in June 2023, France in August 2024, and Hong Kong in November 2024. The UK, Germany and Europe start in April 2025, and Australia in June 2025. For contrast, we took opening gaps from the cash S&P 500 (SP:SPX) over its last 750 days.
Three limits apply. First, these are chart feeds, not the prices your broker would fill you at. Second, every figure comes before spread, swap and commission. Third, OANDA stamps daily bars at 21:00 or 22:00 UTC on the previous calendar day, so we quote the real trading day. Our editorial testing policy sets out the wider method.
Index parameters: how each one is built
You cannot change an index’s settings, but its parameters are worth reading before you trade it. We confirmed these four at the linked pages on 3 November 2026.
| Benchmark | Source | Weighting | Worth knowing |
|---|---|---|---|
| Dow Jones Industrial Average | S&P Dow Jones Indices | Price | Divisor changes when members change |
| S&P 500 | State Street fund page | Float-adjusted market cap | 503 holdings listed on 30 October 2026 |
| Nasdaq-100 | Nasdaq | Modified market cap | 100 companies, no financials |
| DAX | STOXX | Members picked by free-float market cap, 15% share cap | 40 companies; main version includes dividends |
Now look at the names. STOXX says the DAX went from 30 to 40 companies on 20 September 2021, while OANDA’s CFD, which we read as a DAX stand-in, still says Germany 30. So a number in a name is not a member count. STOXX also calls the DAX one of the few major country indices that includes dividends in its most popular version, so long-run comparisons are not like for like.
We left out the other benchmarks here, because we only print rules we read at the source for this guide. Each has its own rulebook, so check it before you size a trade.
Reading an index chart
Read three things first: the label, the currency and the scale. The label belongs to the provider. The currency sits in the symbol and in the box at the top right, so Germany 30 is in EUR and this Japan 225 CFD is in USD.
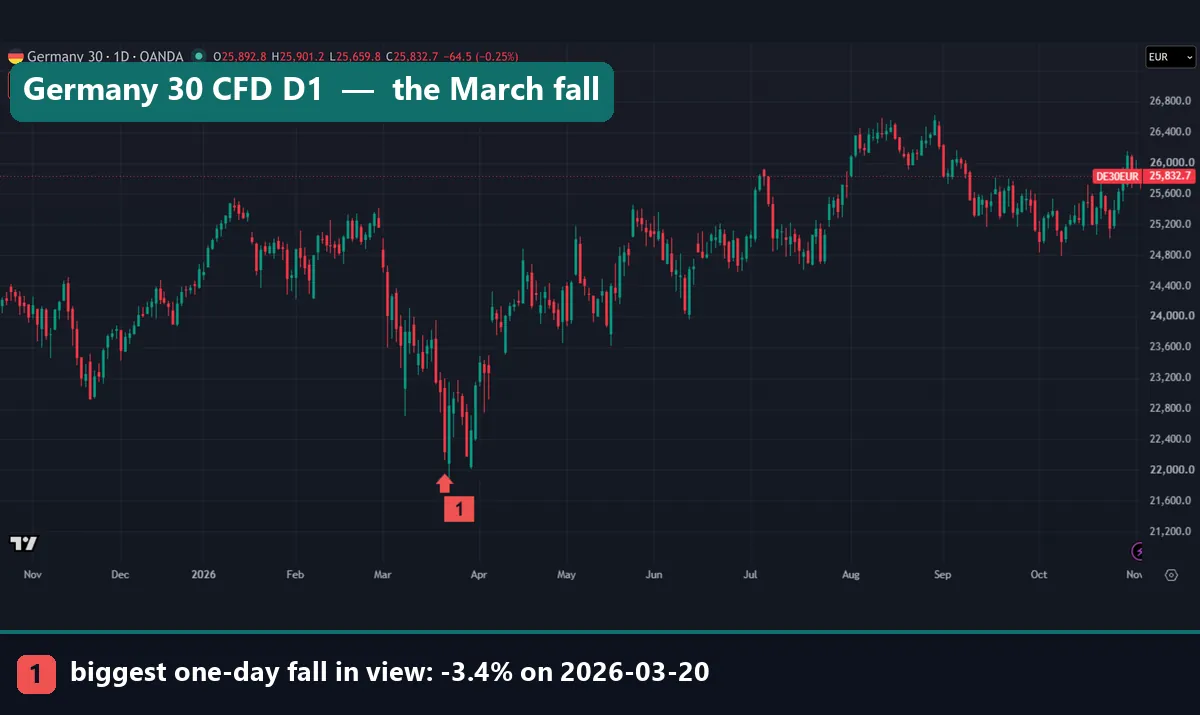
On Germany 30, the marker sits under the biggest one-day fall in view: -3.4% on 20 March 2026. That bar came close to the lowest prices on the chart, near 22,000. Price then climbed back above 26,000 by August.
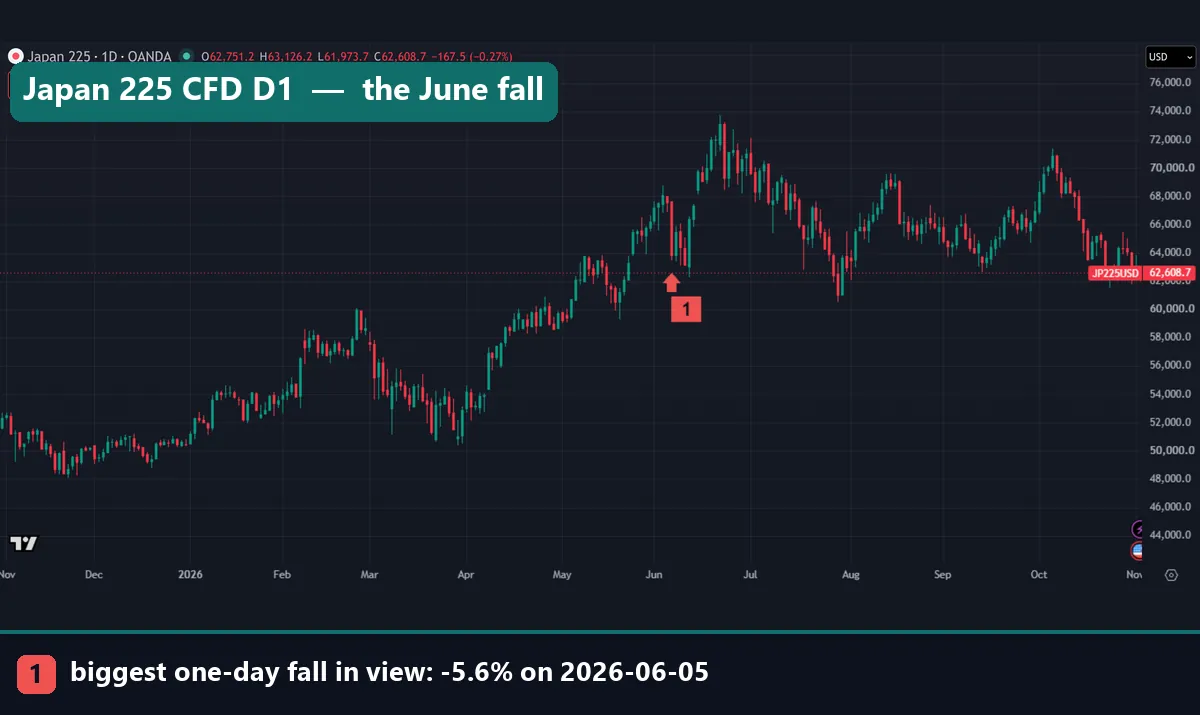
The Japan 225 scale looks far larger, running from under 50,000 to above 72,000. Its biggest one-day fall was -5.6% on 5 June 2026, the same date as the biggest fall on our S&P 500 chart, at -2.9%. So one date gave two very different percentages.
In short, never compare indices by raw level. A point on one is a very different size from a point on another, and the next section puts numbers on that.
Worked example: one 100-point stop on five indices
Take a 100-point stop and apply it everywhere. Multiply each last close by its median daily range, and you get a typical day in points. The closes come from our 3 November pull, and the screenshots came a little later, so their prices differ slightly.
| Index CFD | Last close | Median daily range | Typical day (points) | 100 points as a share of it |
|---|---|---|---|---|
| US S&P 500 | 7,544.2 | 1.07% | 81 | 124% |
| UK 100 | 10,716.0 | 0.94% | 101 | 99% |
| Germany 30 | 25,800.7 | 1.16% | 299 | 33% |
| US Nas 100 | 28,089.0 | 1.54% | 433 | 23% |
| Japan 225 | 62,411.2 | 1.92% | 1,198 | 8% |
So the same stop sits outside a median S&P 500 day, yet it covers a small slice of a median Japan 225 day. It is not the same money either, because these CFDs quote in USD, GBP and EUR. Instead, start from your own risk with position sizing rules.
The same scaling fixes the falls on our charts. Divide each marked fall by that index’s median range. Germany’s -3.4% and Japan’s -5.6% both come to about 2.9 times a median day, the S&P 500’s -2.9% to 2.7 times, and Hong Kong’s -2.6% to 1.4 times. One caveat: a fall runs close to close and a range runs high to low, so this is only a rough yardstick.
Ten index CFDs side by side
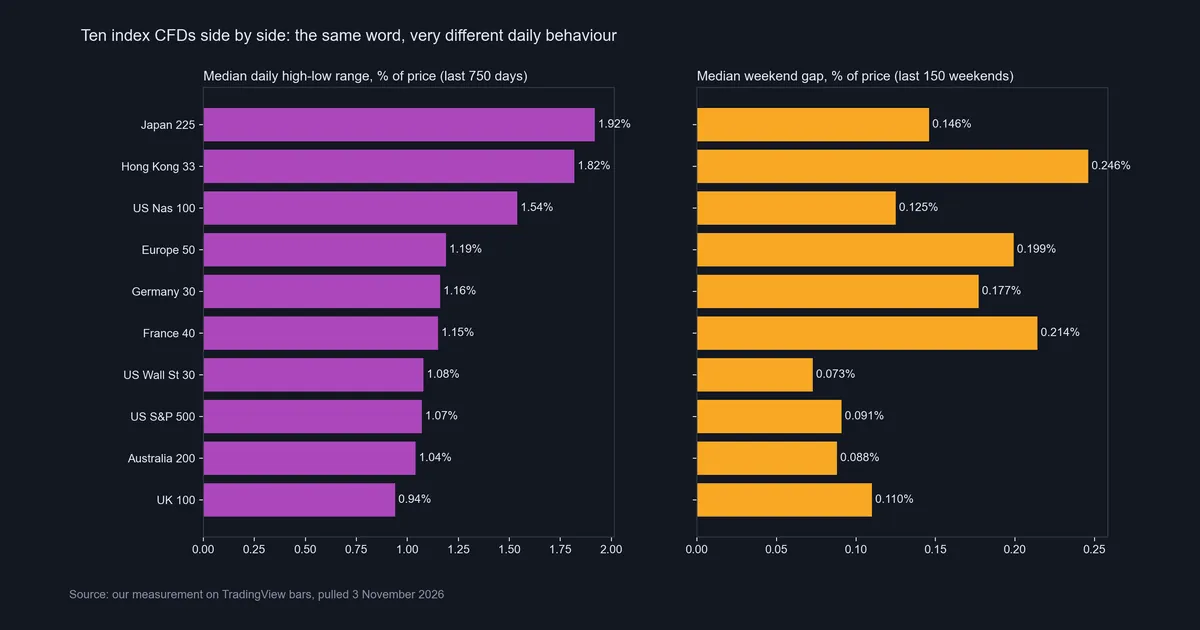
These bars are our measurement. Japan 225 is widest at 1.92% and UK 100 narrowest at 0.94%, so a typical Japan day runs about twice a typical UK day. Weekend gaps rank differently: Hong Kong 33 leads at 0.246%, while US Wall St 30 is smallest at 0.073%. We measured the size, not the cause.
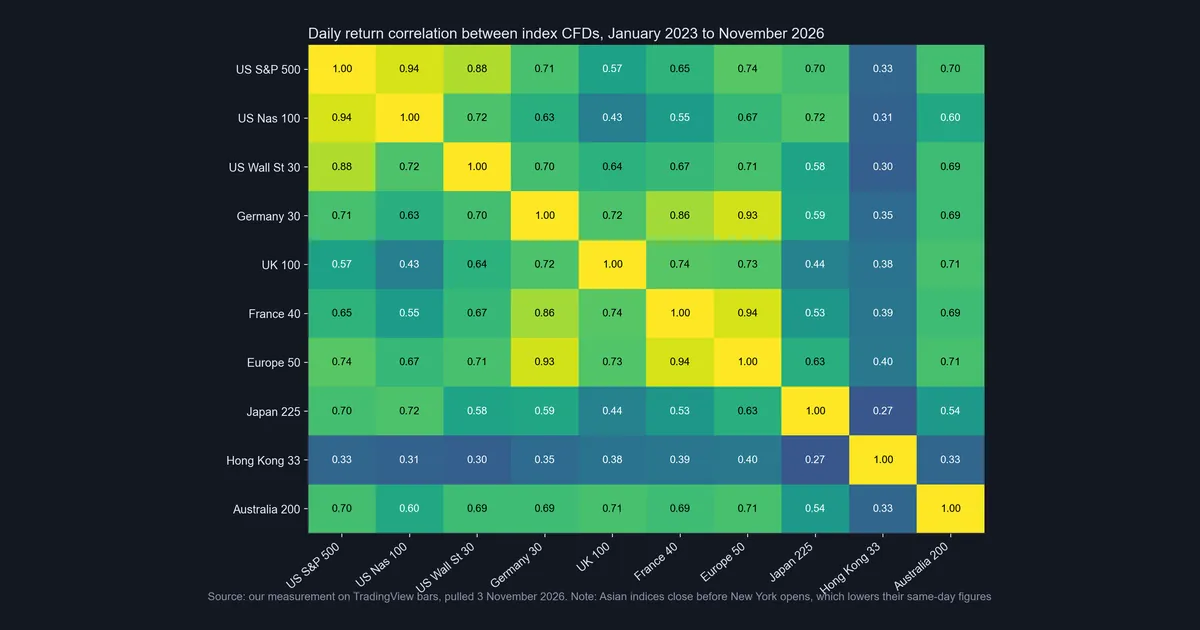
This grid shows daily return correlation. US Nas 100 reads 0.94 with the S&P 500, and Europe 50 reads 0.94 with France 40. So a long S&P 500 plus a long Nas 100 sits close to one position, not two. Our guide to portfolio heat shows how to count that.
Low numbers need care too. Hong Kong 33 reads 0.33 with the S&P 500, and the note under the grid explains part of it: Asian indices close before New York opens. For example, the cash Nikkei reads +0.11 with the same-date S&P 500 but +0.45 with the previous S&P session.
Download the complete indicator database
Put these concepts on your charts. One email unlocks the full library of 1,380+ indicators with compiled MT4 and MT5 files, plus my TradingView scripts. No paywall, no spam, unsubscribe any time.
Get free access to my indicator database
One email unlocks 1,380+ free MT4, MT5 and TradingView indicators — the complete library. No single-tool download; you get the whole database.
Where it fails
An index describes a market, but it does not protect you from one.
Spreading across indices fails when you need it most. Eight of the ten CFDs printed their worst day in our daily history on 12 or 16 March 2020. Australia 200 fell 14.2%, France 40 fell 13.0%, and the US S&P 500 fell 10.7%. So correlations from calm years do not describe those days, as our guide to market corrections also explains.
A CFD can differ from its index. The cash Nikkei’s median daily range over the last 750 days was 1.22%, against 1.92% for the Japan 225 CFD. The CFD trades nearly 24 hours, so its range is not the range of the index.
Costs change the answer. When we captured these charts, the Japan 225 boxes showed 62,602.7 and 62,614.7, a 12-point spread, against half a point on the S&P 500. That is one moment, not a typical spread. Holding overnight also adds financing, as our guide to swap explains.
The level hides the detail. A rise in a cap-weighted index can rest on a few large names, and we did not measure breadth for this guide. Also, medians hide the tails, and several of our hourly windows are short.
Sessions: the busy hour depends on the region
The busiest hour, on the New York clock, follows the home market. US indices peak at 09:00 or 10:00. Europe peaks at 03:00, in the London session morning, and Asia at 20:00, in the Asian session morning. Each hour below names the bar that opens then.
| Index CFD | Busiest New York hour | Median H1 range then | New York hours with bars |
|---|---|---|---|
| US S&P 500 | 10:00 | 0.389% | 23 |
| US Nas 100 | 10:00 | 0.584% | 23 |
| US Wall St 30 | 09:00 | 0.442% | 23 |
| Germany 30 | 03:00 | 0.469% | 22 |
| UK 100 | 03:00 | 0.364% | 21 |
| France 40 | 03:00 | 0.482% | 15 |
| Europe 50 | 03:00 | 0.423% | 22 |
| Japan 225 | 20:00 | 0.633% | 23 |
| Hong Kong 33 | 20:00 | 0.777% | 19 |
| Australia 200 | 20:00 | 0.375% | 24 |
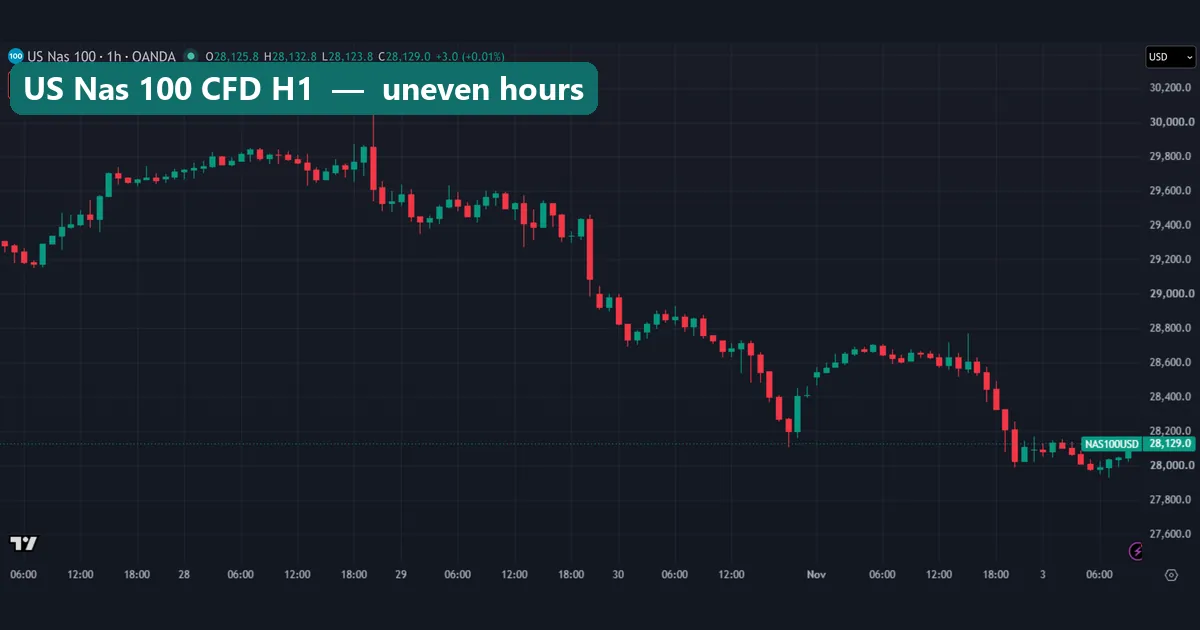
This hourly chart shows how uneven the hours are. Quiet runs of small bars sit between a few long ones, such as the bar that drops to about 29,000 late on 29 October. The time axis shows UTC: New York 09:30 was 13:30 UTC until 1 November 2026, then 14:30 UTC.
At the last close, the median Nas 100 bar at New York hour 10 is about 164 points, against about 32 at hour 0. Some CFDs also stir at the US open while their home market is shut. Hong Kong 33 reads 0.456% at New York hour 9, against 0.185% at hour 6.
Gaps: what the cash index shows and the CFD hides
Gaps follow from those clocks. The cash S&P 500 opened away from the prior close by a median 0.24% over its last 750 days, and by more than 1% on 5.9% of days. The cash Nikkei’s gap since 2023 is wider: a median 0.51%, and more than 1% on 17.5% of days.
A CFD trades through most of those hours, so it moves overnight instead of gapping at the open. We measured its weekend gaps instead, and those stay small: a median 0.091% on the S&P 500 CFD. Our guides to types of gaps and the weekend gap go further.
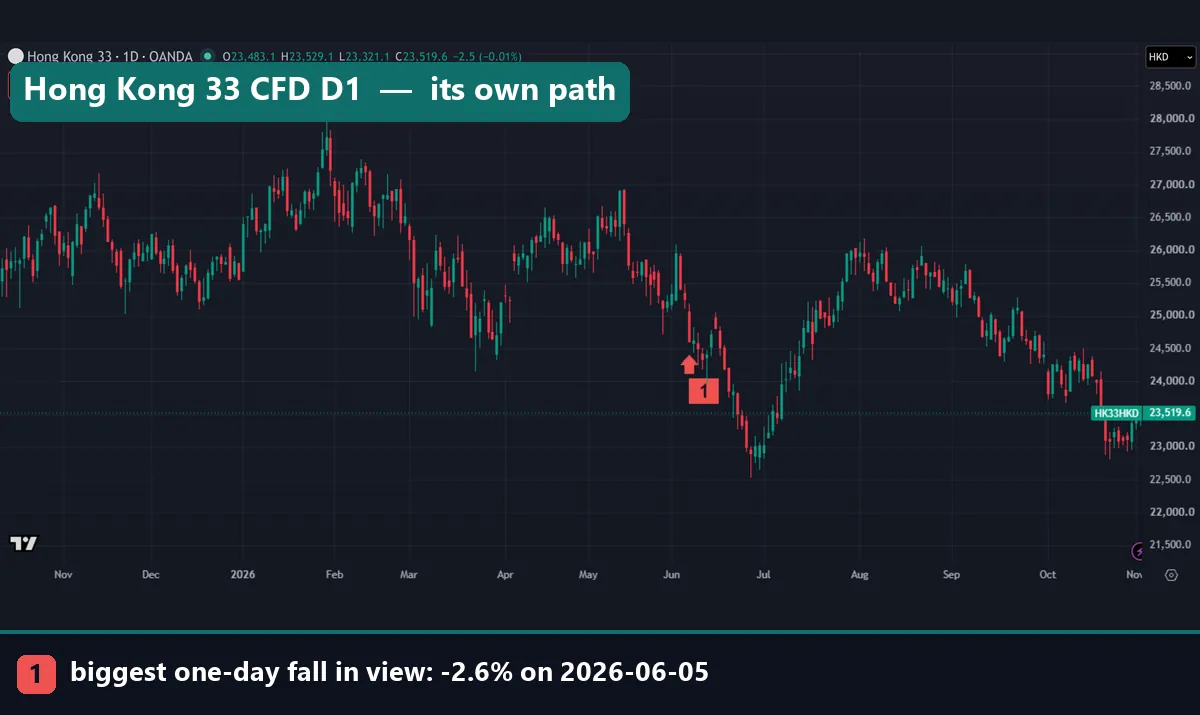
Hong Kong 33 also shows that one index can go its own way. Over the last 250 days it changed -11.4%, while the S&P 500 CFD changed +11.8% and Japan 225 +23.6%. The chart ends near 23,500, well below its high above 28,000 early in the year.
Common mistakes with indices
- Treating the CFD as the index. They have different hours and different ranges, so check which one your chart shows.
- Using one point stop everywhere. In our table, 100 points runs from 124% of a typical day down to 8%.
- Counting correlated trades as separate bets. At 0.94, the S&P 500 and Nas 100 rarely offer two independent views.
- Reading low same-day correlation as independence. Timing explains part of the low Asian figures, so compare with the previous US session too.
Where to go next
Start with how CFDs work, since most retail index charts show that product. If you prefer exchange contracts, read the Dow futures and Nasdaq 100 futures guides. For market mood across assets, see risk-on and risk-off.
Also recheck the four sources linked above before you rely on a rule, because members and caps change. We link State Street’s page for its description of the S&P 500, not as a recommendation.
FAQ about indices
What are indices in simple terms?
They are published numbers that sum up a list of share prices under a fixed rule. You can follow the number, but you cannot own it.
Can you buy an index directly?
No. You can buy a fund that holds the shares, or trade a future or a CFD that follows the number. Each has its own costs, hours and risks.
What is the difference between price-weighted and cap-weighted indices?
A price-weighted index gives high-priced shares more pull, whatever the company’s size. A cap-weighted index gives large companies more pull. The Dow is the first kind, and the S&P 500 is the second.
Why does a CFD say Germany 30 when the DAX has 40 companies?
The label is the provider’s name for its product. STOXX says the DAX moved from 30 to 40 companies in September 2021, so the number in the name is not a member count.
Which index moves the most in a day?
Over our last 750 days, Japan 225 had the widest median daily range at 1.92%, and UK 100 the narrowest at 0.94%. These are OANDA CFD figures, before costs.
When are stock indices busiest?
On the New York clock, US index CFDs peak at 09:00 or 10:00, European ones at 03:00, and Asian ones at 20:00. Those are medians, so single days can differ.
Do indices move together?
Often, but not equally. Since 2023, US Nas 100 reads 0.94 with the S&P 500 CFD, UK 100 reads 0.57, and Hong Kong 33 reads 0.33.
Do these figures tell you what an index will do next?
No. They describe size and timing in one past window, and they say nothing about direction. They also come before spread, swap and commission, so plan your risk first; results are not guaranteed; past performance is not indicative of future results.
Last updated: 3 November 2026.

About the author
Written by Dominic Walsh, a Forex trader and MT4/MT5 indicator, Expert Advisor and script developer. Every tool on forexmt4systems.com is tested on live charts before release and ships with ready-to-use compiled MT4 (.ex4) and MT5 (.ex5) files. Learn more about the trader and developer behind this site.
How we build, test and correct every tool: Editorial & Testing Policy. Trading carries risk; see the disclaimer.