
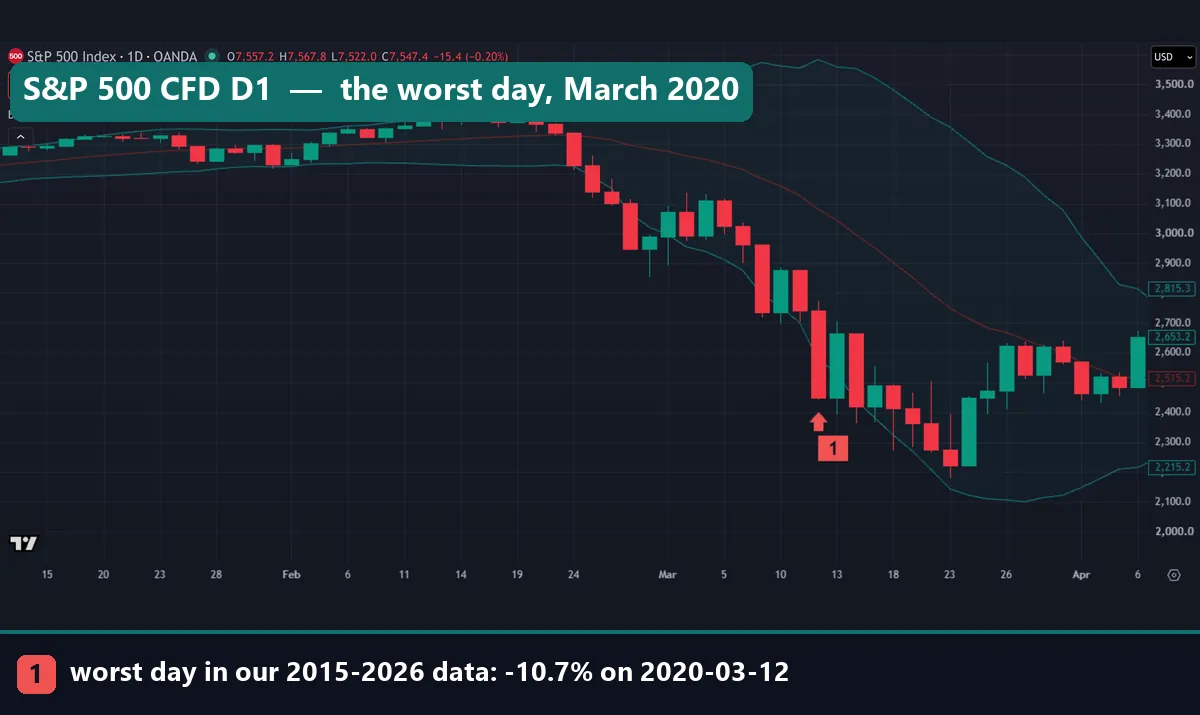
A symmetric distribution looks the same on both sides of its center, so its mean and median land on one point and its skew is zero. This guide settles one question for traders: do market returns behave that way? We measured 37,725 daily returns on 23 FX pairs, plus six TradingView symbols. The answer is nearly symmetric, but not normal, and that gap matters on days like the one below: -10.7% on the S&P 500 CFD.
What a symmetric distribution is
Picture a histogram and fold it down the middle. If the two halves match, the data is symmetric. The NIST engineering statistics handbook says nearly the same: a distribution is symmetric if it looks the same to the left and right of the center point.
Three facts follow. The mean and median both sit at the center. Every measure of skew equals zero. And if the shape has one peak, the mode sits there too, as the symmetric probability distribution entry on Wikipedia sets out.
Most explanations skip the next part: symmetric does not mean normal. The bell curve is one symmetric shape among many. A flat uniform distribution also qualifies, and so does a sharp peak with long tails. So symmetry tells you the two sides match, but not how often large values turn up. That second question belongs to kurtosis, and for a trader it is the more expensive one.
How it works: mean, median, skew and kurtosis
First we turn each daily move into a log return, then into a z-score, so a quiet pair and a wild pair become comparable.
z = (return - mean) / standard deviation
skew = sum(z^3) / N
excess kurtosis = sum(z^4) / N - 3
Skew averages z cubed. Cubing keeps the sign, so falls and rises cancel when the two sides match. A negative result means the left tail runs longer.
Excess kurtosis averages z to the fourth power, minus 3. The fourth power lets far-out days dominate. NIST notes that a normal curve has a kurtosis of three, so subtracting 3 sets normal to zero. A positive result means heavier tails than a bell curve.
There is also a quick test with no formula: compare the mean with the median. On USD/JPY in our MT4 data, the mean daily return is 0.0242% and the median 0.0542%. That fits a long left tail of sharp falls. USD/CHF goes further: mean -0.0109%, median +0.0125%. Those two do not even share a sign.
How we tested return symmetry
We kept two data sets apart. The first is MetaTrader 4, build 1471, Capital Point Trading history: daily bars on 23 FX pairs from 12 June 2018 to 24 August 2026. That terminal has been offline since late August 2026, so the window ends there. Histories run from 296 days on NZD/CAD to 2,064 on AUD/JPY and EUR/AUD, for 37,725 returns in total.
The second is the TradingView web chart, pulled on 3 November 2026: the OANDA S&P 500 CFD, Nasdaq 100 CFD, gold, EUR/USD and USD/JPY, plus TVC:USOIL, daily from 2 January 2015 to 3 November 2026. For USOIL we excluded TradingView’s 0.009 print of 20 April 2020.
Returns run close to close, and each symbol uses its own mean and standard deviation over the full sample. Results are prices only, before spread, swap, financing, commission and dividends. The charts use Bollinger Bands (20, 2), as TradingView’s Bollinger Bands help page defines them. Our editorial testing policy explains how we run and report tests.
Shape parameters: what to compare
A distribution has no settings to tune, but it has parameters to read. This table sets textbook values beside our pooled FX result.
| Parameter | Any symmetric shape | Normal curve | 23 FX pairs, pooled |
|---|---|---|---|
| Skew | 0 | 0 | -0.17 |
| Excess kurtosis | Any | 0 | 3.24 |
| Within half an SD | Any | 38.3% | 44.6% |
| Beyond 1 SD | Any | 31.7% | 25.9% |
| Beyond 2 SD | Any | 4.55% | 4.9% |
| Beyond 3 SD | Any | 0.27% | 1.1% |
| Beyond 4 SD | Any | 0.006% | 0.3% |
Read the last column downward. Skew is small, so the two sides nearly match. Kurtosis is not, and the shares below it show why: more quiet days than a bell curve expects, fewer medium days, and far more extreme ones. Also, 16 of the 23 pairs have negative skew, and the median pair sits at -0.2.
Reading a symmetric distribution on a chart
A price chart cannot show a distribution directly, because it orders days by date rather than size. So we look for the days a bell curve calls rare. Each capture marks a symbol’s worst day by close in our 2015-2026 data, with Bollinger Bands on top. Our Bollinger Bands explainer covers the basics. The price row on each capture is a live quote from capture day, so use the right-hand scale.
On the S&P 500 CFD chart above, the close of 12 March 2020 sits well below the lower band. That band stayed narrow through mid-February and widened only once the fall began.
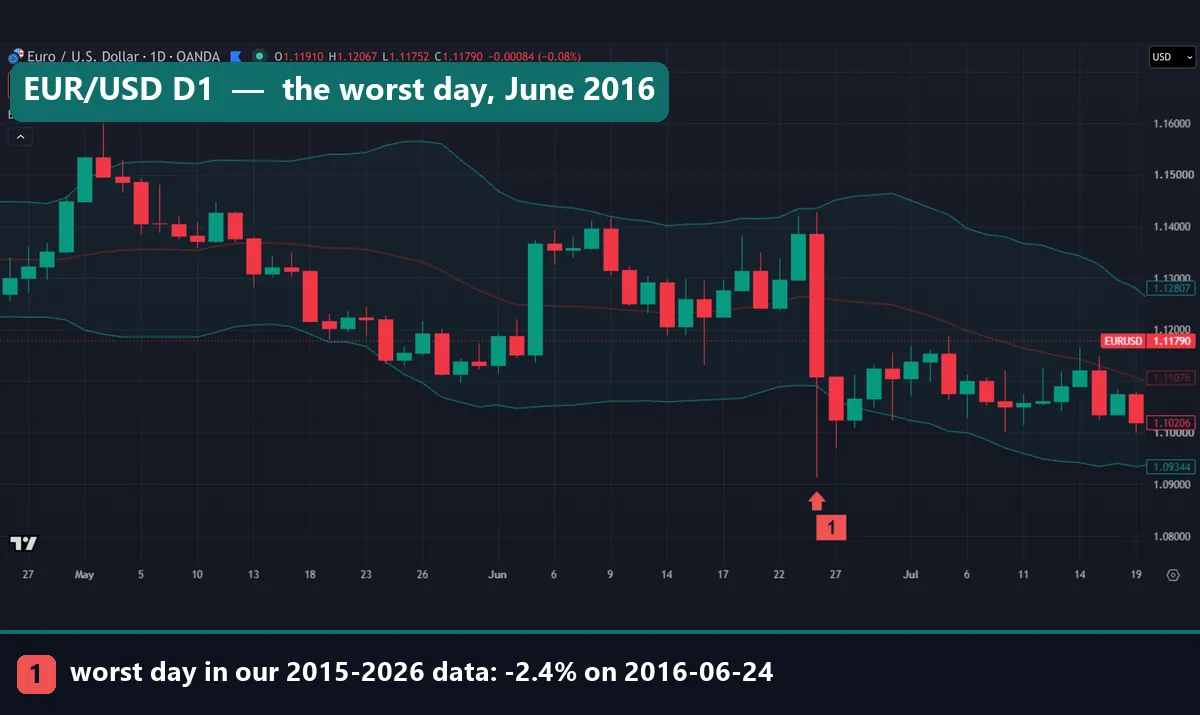
EUR/USD fell 2.4% on 24 June 2016. Look where the candle body ends: the close stays just inside the lower band, while the wick runs far below it. So the largest daily fall in nearly 12 years did not close outside the band. That is a first hint that the band and the return distribution measure different things.
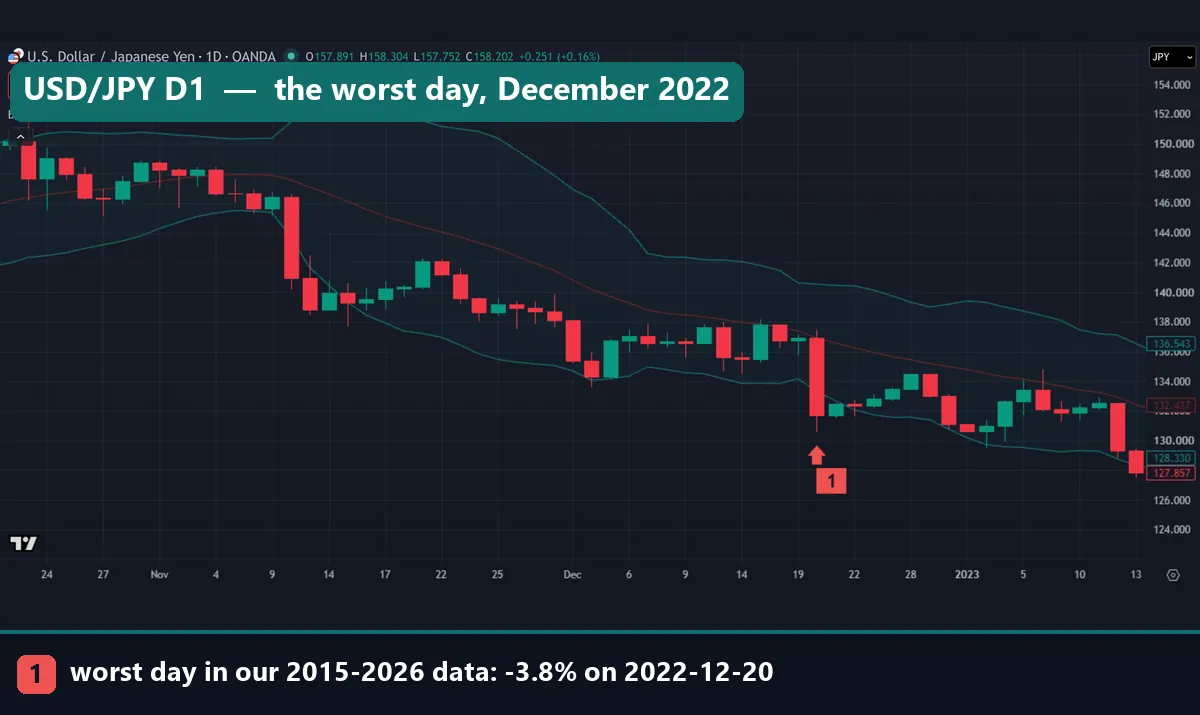
USD/JPY lost 3.8% on 20 December 2022, and this time the close lands below the band. A tall red bar from November looks almost as large, so big days can arrive in groups. USD/JPY is also the most lopsided of our six TradingView symbols, with skew of -0.54. It rose on 52.9% of days, yet in our MT4 data its worst day reached -6.7 SD and its best only +3.6 SD.
Worked example: the worst days in standard deviations
Take the S&P 500 CFD. Its daily standard deviation is 1.09%, and its worst day was -10.7%. Our SD uses log returns, so convert first: ln(1 – 0.107) is about -11.3%. Then divide: -11.3 / 1.09 is about -10.4 SD. We skip the mean because it is tiny.
The table repeats that sum for six symbols. The last column turns the share of days beyond 4 SD into a count. A normal curve expects about 0.2 of a day there across 3,000 days.
| Symbol | Daily SD | Worst day | Date | In SD, about | Beyond 4 SD |
|---|---|---|---|---|---|
| S&P 500 CFD | 1.09% | -10.7% | 12 Mar 2020 | -10.4 | 0.65%, 20 days |
| Nasdaq 100 CFD | 1.36% | -10.6% | 12 Mar 2020 | -8.2 | 0.49%, 15 days |
| Gold | 1.00% | -8.8% | 30 Jan 2026 | -9.2 | 0.52%, 16 days |
| EUR/USD | 0.49% | -2.4% | 24 Jun 2016 | -5.0 | 0.33%, 10 days |
| USD/JPY | 0.57% | -3.8% | 20 Dec 2022 | -6.8 | 0.46%, 14 days |
| USOIL | 2.83% | -27.3% | 9 Mar 2020 | -11.3 | 0.74%, 22 days |
So every symbol printed a day a bell curve treats as close to impossible. Even EUR/USD, the calmest of the six, logged about 10 days beyond 4 SD. The raw percentage also misleads: gold’s -8.8% looks smaller than the Nasdaq CFD’s -10.6%, yet gold’s day was the rarer in its own terms.
What the FX histogram shows: a taller middle, fatter tails
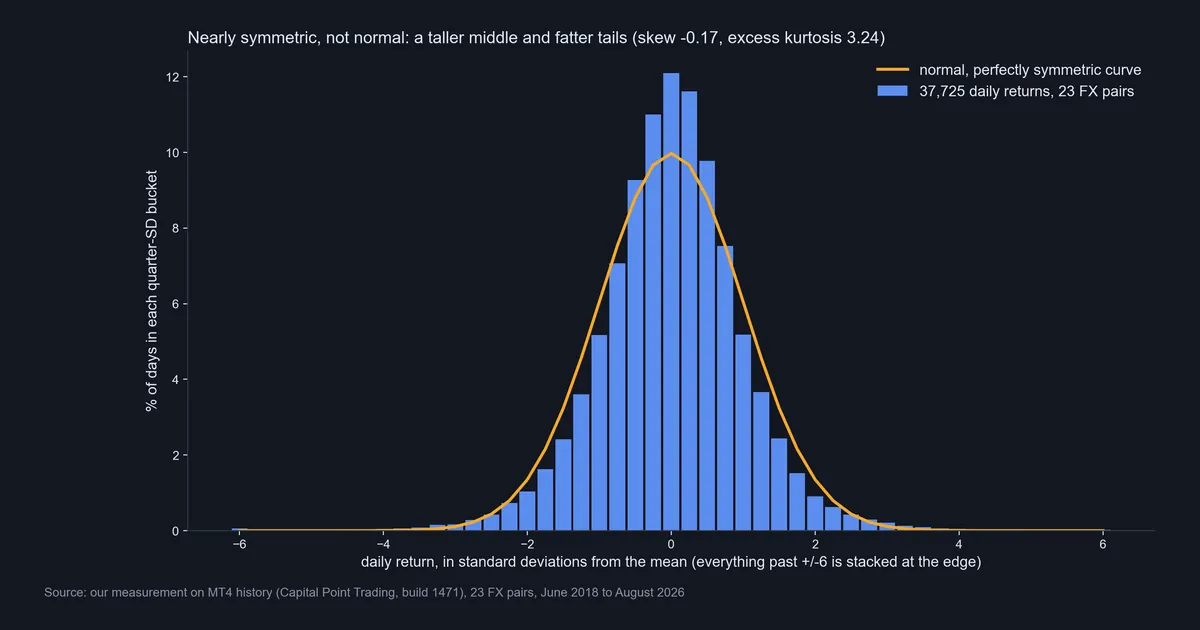
This is our own measurement: all 37,725 FX returns in quarter-SD buckets, with a normal curve in orange. The center bucket holds about 12% of days against about 10% for the curve. Then the bars drop under the curve from roughly 1 to 2 SD, and climb back above it past about 2.5 SD.
Both sides look like mirror images until the edges. In the buckets at about 4 SD or further, we count 80 days on the left and 55 on the right. So the middle is nearly symmetric, while the far tails are not.
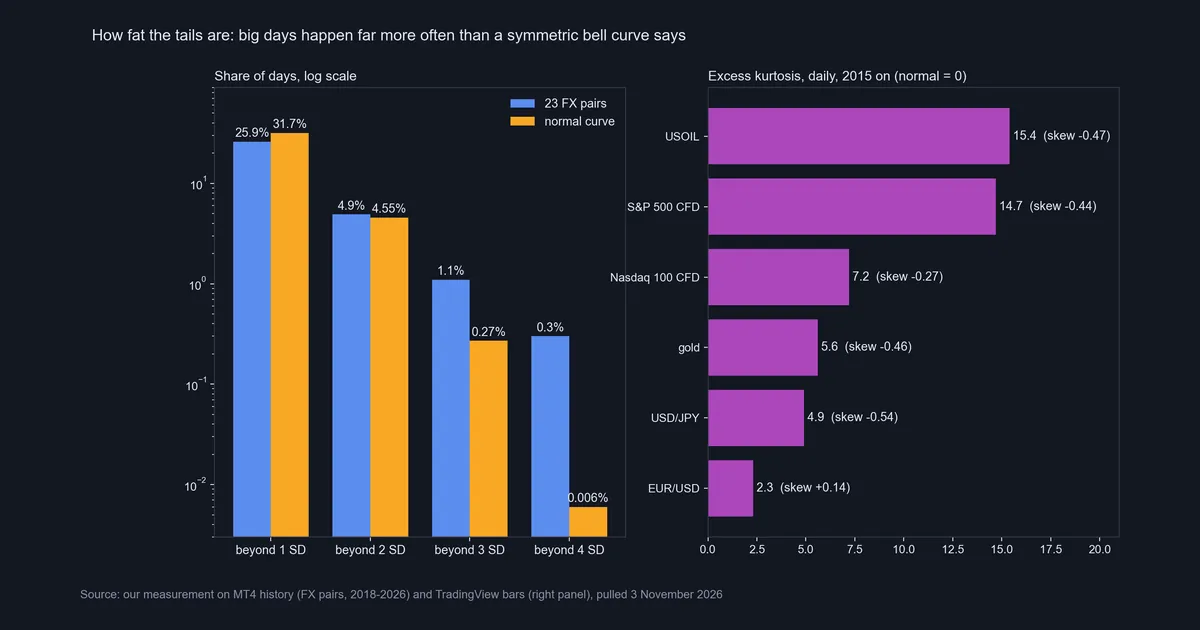
In the left panel, on a log scale, the normal curve is nearly right at 2 SD: 4.9% against 4.55%. Beyond 3 SD it misses by about 4x, and beyond 4 SD by about 50x. That means about 113 days beyond 4 SD, where the curve expects about 2.
The right panel uses our TradingView window. Excess kurtosis runs from 15.4 on USOIL and 14.7 on the S&P 500 CFD down to 2.3 on EUR/USD. Skew is negative on all six except EUR/USD, at +0.14. In the MT4 window EUR/USD reads 1.62 and +0.21, so the figure depends on the dates and feed.
Download the complete indicator database
Put these concepts on your charts. One email unlocks the full library of 1,380+ indicators with compiled MT4 and MT5 files, plus my TradingView scripts. No paywall, no spam, unsubscribe any time.
Get free access to my indicator database
One email unlocks 1,380+ free MT4, MT5 and TradingView indicators — the complete library. No single-tool download; you get the whole database.
Where it fails: the limits of this test
These numbers describe a shape in past data, and they have real limits.
- Hindsight. We scale each day by an SD from the whole sample, which includes the future and the bad day itself. Nobody had that number in March 2020.
- Overlap. The pairs share currencies and calendar days, so 37,725 returns are not 37,725 separate tests. All six yen pairs have negative skew, and those are not six findings.
- Quote direction. Flip a pair and its skew flips sign. So “16 of 23 negative” partly reflects which currency comes first. A sharp USD/JPY fall is a sharp yen gain.
- Short histories. NZD/CAD has 296 days and AUD/CAD 318, and neither shows a day beyond 4 SD. We would not read that as safety. Our guide to backtest sample size covers the same problem.
- Closes only. Daily closes hide intraday extremes, such as EUR/USD’s wick in June 2016.
- No causes. We measured shape, not reasons.
- The next day. The worst day in a sample is only the worst so far. A test window that misses a tail day understates risk, one of the common backtesting mistakes.
Why a 2 SD band is not a 95% rule
A normal curve leaves 4.55% of values outside 2 SD, so about 95% sit inside. Traders often carry that number over to Bollinger Bands. John Bollinger’s own Bollinger Band rules on his site warn against it. Rule 14 says to make no statistical assumptions from the band’s standard deviation, because prices are non-normal and the usual sample is too small. It adds: “In practice we typically find 90%, not 95%, of the data inside Bollinger Bands with the default parameters.” We did not re-measure that figure.
Our charts add a third reason: the band and the return distribution use different standard deviations. A band measures how far the last 20 closes spread around their average. A return SD measures the size of daily changes. So a trend can widen a band with no rise in daily moves.
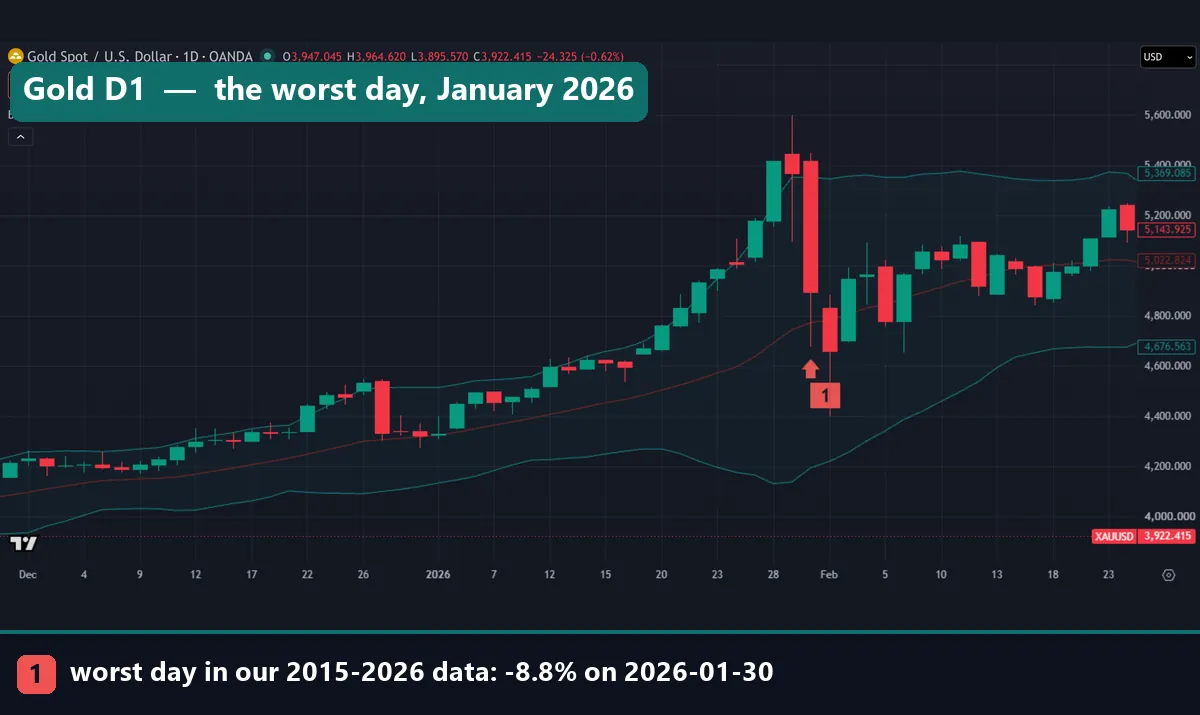
Gold shows this best. It fell 8.8% on 30 January 2026, about 9 SD by daily returns. Yet that close stayed above the middle band, because a sharp January rally had already stretched the band. So “inside the bands” did not mean ordinary.
USOIL: the opposite case
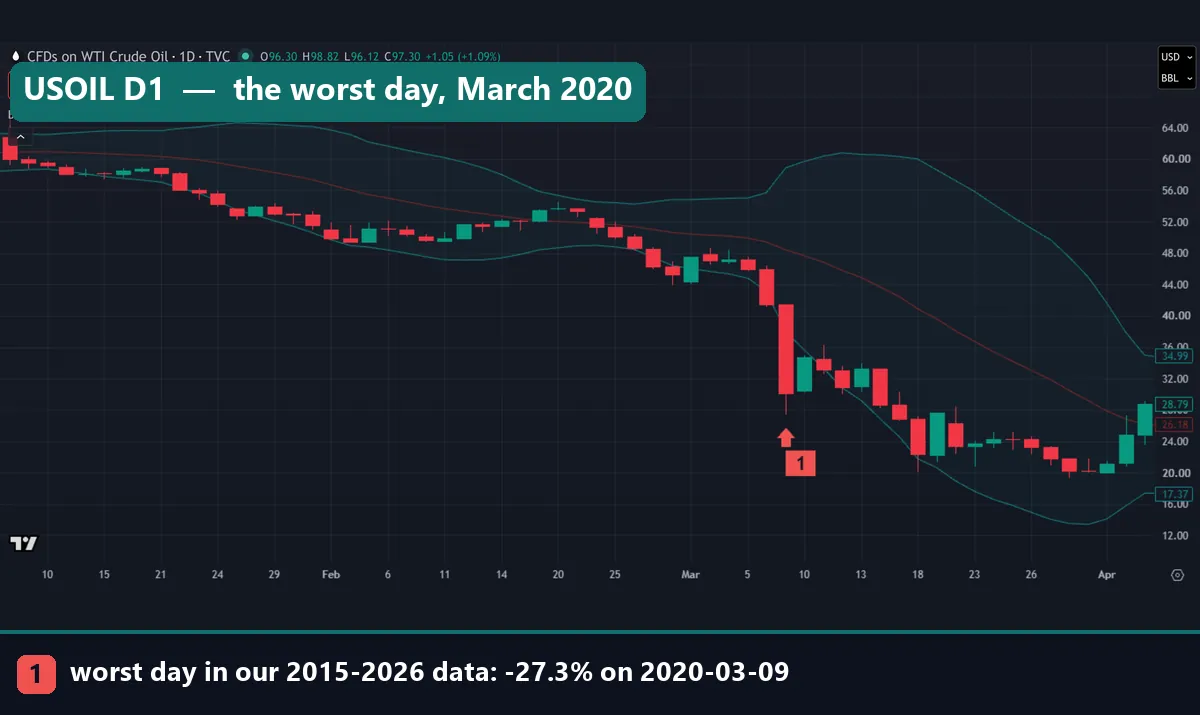
USOIL fell 27.3% on 9 March 2020, about 11 SD, and closed far below the lower band. The upper band jumped only at that bar, because the band looks backward. Bollinger’s rule 8 adds that closes outside the bands are initially continuation signals, not reversal signals. Oil did keep falling through March here, though one chart proves nothing. See our USOIL guide for that market and our Bollinger Band Width guide for the width itself.
Size stops and risk for fat tails
The practical point: size for the tail, not the average day. Suppose you size a position so that a 2 SD day against you costs 1R, one unit of risk. These are sums on our figures, not trades.
- EUR/USD: 2 SD is 0.98%, so the -2.4% day costs about 2.4R.
- USD/JPY: 2 SD is 1.14%, so the -3.8% day costs about 3.3R.
- Gold: 2 SD is 2.00%, so the -8.8% day costs about 4.4R.
- USOIL: 2 SD is 5.66%, so the -27.3% day costs about 4.8R.
- S&P 500 CFD: 2 SD is 2.18%, so the -10.7% day costs about 4.9R.
That assumes no stop. A stop helps only if price trades through it cleanly, and a gap can skip it. So set your position sizing for a day of several R, scale distance to current volatility with an ATR stop loss, and count linked positions together through portfolio heat.
The tall middle has a cost too. With 44.6% of FX days closing inside half an SD, a stop set too tight sits in ordinary noise and invites a whipsaw. Our forex risk management strategies guide puts these habits together.
Common mistakes with symmetric returns
- Treating symmetric as normal. Near-zero skew says the sides match and nothing about the tails. Pooled FX shows skew of -0.17 and excess kurtosis of 3.24 at once.
- Reading a 2 SD band as 95% confidence. Bollinger’s rule 6 says tags are tags, not signals, so a band touch alone is no reason to fade price. Mean reversion trading needs its own evidence.
- Using one window’s worst day as the limit. EUR/USD’s worst day in our MT4 data reads -4.1 SD. The longer TradingView window reads about -5.0 SD, because it includes June 2016.
- Comparing raw percentages across markets. A -2.4% day on EUR/USD comes to about 5 SD, while -10.6% on the Nasdaq CFD comes to about 8.2 SD. So scale each symbol by its own SD first.
Where to go next
- Risk of ruin: how a run of losses plays out against your account.
- Forex pair volatility: which pairs move most, and how to measure it with ATR.
For primary sources, use the NIST handbook and Bollinger’s rules linked above.
FAQ: symmetric distribution
What is a symmetric distribution in simple terms?
It is a set of values whose left and right sides mirror each other around the center. Fold its histogram in half and the two sides match.
Are the mean and median equal in a symmetric distribution?
Yes, both sit at the center of symmetry. So a gap between mean and median is a quick sign of skew.
Is a normal distribution the same as a symmetric distribution?
No. Every normal curve is symmetric, but many symmetric shapes are not normal. A normal curve also fixes how often large values appear, and symmetry alone does not.
Are forex returns symmetric?
Nearly, across the whole set. Our pooled skew on 23 pairs is -0.17. But the tails are far from normal, with excess kurtosis of 3.24.
What does negative skew mean for a trader?
The left tail runs longer than the right, so the sharpest moves tend to be falls. On a currency pair, flip the quote and the skew flips too.
Do Bollinger Bands contain 95% of price?
Do not assume so. John Bollinger’s published rules report about 90%, not 95%, in practice, and they warn against statistical assumptions.
How rare is a 4 SD day in real markets?
A normal curve expects 0.006% of days beyond 4 SD. Our FX pairs show 0.3%, about 50x more, and the S&P 500 CFD shows 0.65%.
Can I size stops from standard deviation alone?
It gives a fair starting scale, but it does not set a limit. Worst days in our list ran from about 2.4 to 4.9 times a 2 SD move. So plan for a day like that, and remember that results are not guaranteed; past performance is not indicative of future results.
Last updated: 3 November 2026.

About the author
Written by Dominic Walsh, a Forex trader and MT4/MT5 indicator, Expert Advisor and script developer. Every tool on forexmt4systems.com is tested on live charts before release and ships with ready-to-use compiled MT4 (.ex4) and MT5 (.ex5) files. Learn more about the trader and developer behind this site.
How we build, test and correct every tool: Editorial & Testing Policy. Trading carries risk; see the disclaimer.