
This guide covers how to use long position tool TradingView drawings to plan a trade before you take it. You get the toolbar location, every field in the settings dialog, the maths behind the box, and seven real setups we drew on 5 October 2026. It also settles one question most guides skip: what a 2:1 box actually asks of your trades. Our own pullback rule hit its 2R target on only 22.9% of 1,737 trades, so the ratio alone did not save it.
What the long position tool actually is
The Long Position tool is a drawing, not an order. You click an entry price, and TradingView draws two boxes next to it. The green box above the entry is the profit zone. The red box below is the loss zone. The top edge of the green box is your target. The bottom edge of the red box is your stop.
The tool then prints stats for that plan. These include the target and stop distance in price, percent and ticks, the risk to reward ratio, the quantity, and the account balance at each level. TradingView describes it as a way to estimate how a trade would go without placing it, in its help page on how to use the long and short position tools at TradingView.
The Short Position tool is the mirror image. Its red box sits above the entry and its green box sits below. All seven of our chart images show long boxes, but our test rule took trades both ways, and everything here applies to both. If the words trade, position and exposure still blur together, our page on what a position in trading means clears that up first.
How it works: the maths behind the box
The box runs on a few short formulas. TradingView publishes them on its help page, so you can check every number it prints.
For a long trade, the risk to reward ratio is (Target - Entry) / (Entry - Stop). For a short trade, it is (Entry - Target) / (Stop - Entry). So a box with a 30-pip stop and a 60-pip target reads 2.
Next, the quantity. The tool first turns your risk into money. If you enter risk as a percent, it uses Risk / 100 x Account size. Then it divides that money by the stop distance times the point value, and by the lot size. It also caps that figure by your leverage.
Finally, the account balance at the target is Account size + (Target - Entry) x Qty x Point value x Lot size. The balance at the stop uses the stop distance instead. In short, the box is a calculator with a picture on top. For the idea behind the ratio, see our page on the risk reward ratio explained.
How we tested the position tool
We did not test the tool for profit, because a drawing cannot make or lose money. Instead, we used it to draw real setups from a fixed rule.
The rule is our trend pullback rule. First, the trend is up when the close and the 50 EMA both sit above the 200 SMA (the mirror for shorts). Next, a pullback is a close on the wrong side of the 20 EMA. Then entry comes at the next open after the first close back with the trend. The stop sits beyond the pullback’s extreme, the target is 2R, and a time exit closes the trade after 20 bars.
We ran that rule on MetaTrader 4, build 1471, with Capital Point Trading history. It covered 23 FX pairs on the daily chart from 12 June 2018 to 24 August 2026. Every result is in R and before spread, swap and commission.
The chart images come from a TradingView web chart with OANDA data, captured on 5 October 2026. They show USDJPY, GBPJPY and AUDUSD on the daily chart, and USDJPY and USDCHF on the hourly chart. On the hourly charts we applied the same rule to the OANDA bars. Times are UTC. Our full method is on the editorial testing policy page.
Settings: every field in the dialog
Double-click the box to open its settings. The Inputs tab holds the trade plan. The Style tab holds colours, text and the stats display. The Visibility tab picks the timeframes where the box shows.
| Input | What it does | Our captures |
|---|---|---|
| Account size | Balance used for risk and quantity | Not used; we judge in R |
| Lot size | Smallest tradable amount | Not used |
| Risk | Risk per trade, in percent or currency | Not used |
| Leverage | Caps quantity through margin | Not used |
| Entry price | Exact entry level | The rule’s next-bar open |
| Profit level | Target, in ticks or as a price | 2 x the stop distance |
| Stop level | Stop, in ticks or as a price | Beyond the pullback extreme |
| Qty precision | Rounding of the quantity shown | Default |
The tick fields trip up a lot of people. On a five-digit USDCHF chart, one tick is 0.00001, so 135 ticks is 13.5 pips. On a three-digit USDJPY chart, one tick is 0.001 yen, so we typed 2,455 ticks for a 245.5-pip stop. On GBPJPY, 5,592 ticks is 5.592 yen, or 559.2 pips. Our page on pips vs points explains the gap, and the guide on how to calculate pip value turns pips into money.
How to use long position tool TradingView: step by step
- Open a chart. Our TradingView chart guide covers the basics.
- Find the drawing toolbar on the left. TradingView groups the Long Position and Short Position tools with its forecasting and measurement tools.
- Pick Long Position, then click the bar and price where you plan to enter.
- Drag the top edge to your target and the bottom edge to your stop. Or double-click and type exact prices or ticks.
- Drag the right edge out to the time window you want to judge.
- Check the ratio and both distances. If the stop looks too tight for the bar sizes, move it before you trust any number.
Two more actions help. First, right-click the box to add an alert on the position. One alert covers the entry, stop and target. Second, the context menu and the floating panel both have a Reverse button. It flips a long box into a short one around the same entry. We could not confirm a keyboard shortcut on TradingView’s help pages, so we do not quote one here.
Reading the box on a chart
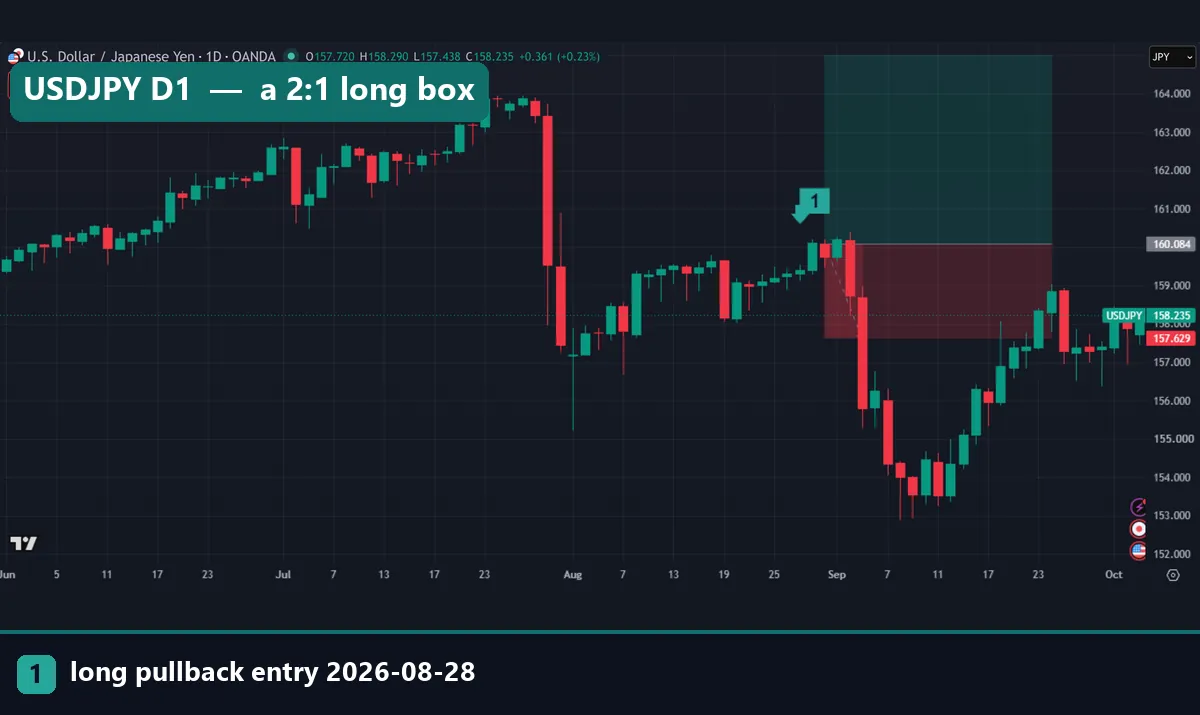
Start with the first image above. It shows USDJPY on the daily chart. Our rule gave a long signal on 28 August 2026, with entry at the next daily open of 160.084. The stop sat at 157.629, 2.455 yen below. The target at 164.994 sat 4.910 yen above, so the box reads 2:1. Price never reached the green box. It fell through the stop in early September, on the fourth bar of the trade. A later climb back into the red zone did not undo that loss.
Now look at the next image, USDJPY on the hourly chart. The signal bar was the 15:00 UTC bar on 2 October. Entry was 157.805, with the stop at 156.951 and the target at 159.513. That is an 85.4-pip stop and a 170.8-pip target.
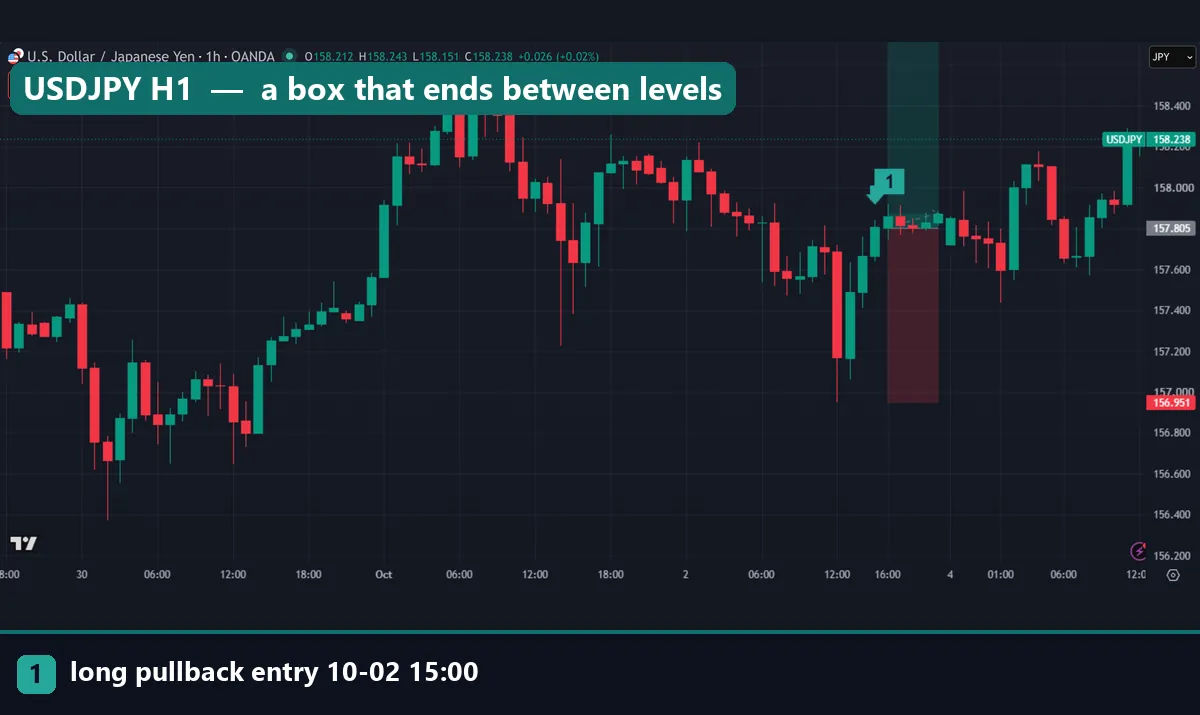
The box is short because 2 October was a Friday. Inside it, price stayed within a few pips of the entry. Neither line was reached. Our rule closes such trades on its 20-bar time exit.
When both levels are hit inside the box
The third image is USDCHF on the hourly chart. The signal bar was the 10:00 UTC bar on 30 September. Entry was 0.83378, with the stop at 0.83243 and the target at 0.83648. That is a 13.5-pip stop and a 27-pip target.
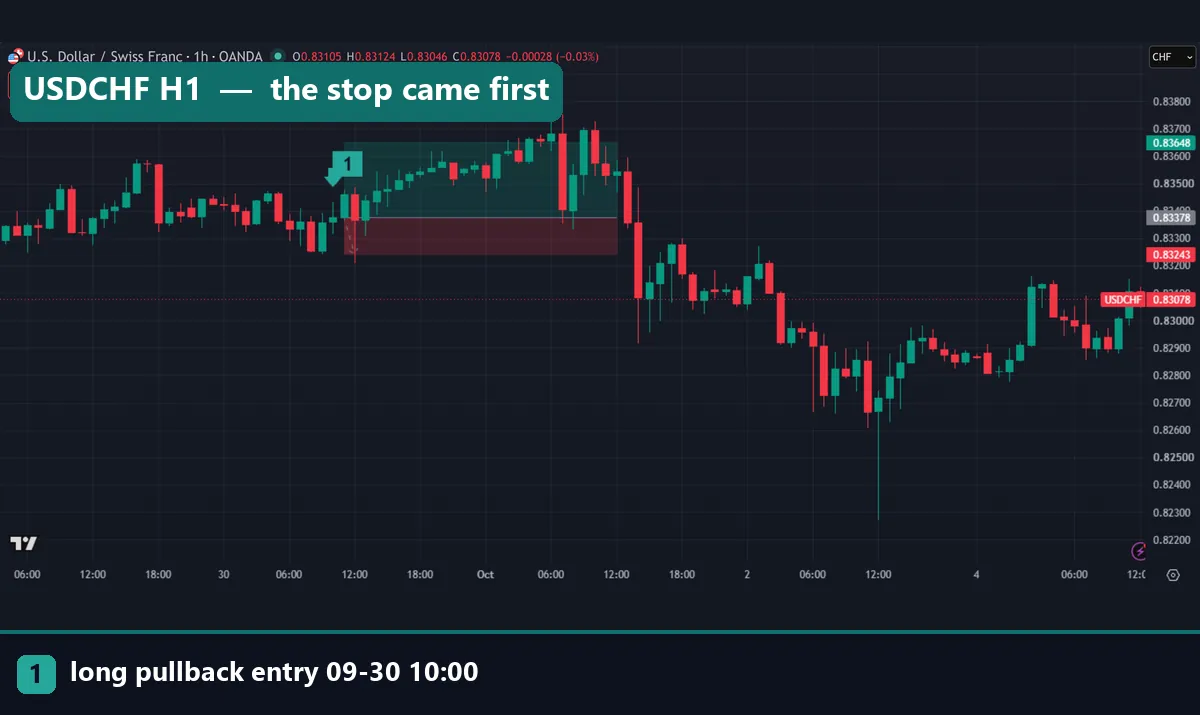
Look closely at the first bar of the trade. Its low wick dips below the stop line, and a dashed line inside the red zone points down to it. The next morning, price ran up through the target. So both levels were reached inside the box, and the stop came first.
Worked example: a USDCHF long on 1 October
Here is one long box from start to finish, using the numbers behind our fifth image.
- The USDCHF hourly trend was up by our rule. A pullback closed below the 20 EMA, and the 09:00 UTC bar on 1 October closed back above it.
- Entry was the next open, at 0.83694.
- The stop went below the pullback low, at 0.83333. That is 36.1 pips, or 361 ticks on a five-digit chart.
- The target was 2R: 0.83694 + (2 x 0.00361) = 0.84416, or 722 ticks.
- The tool’s ratio then reads (0.84416 – 0.83694) / (0.83694 – 0.83333) = 2.
However, price never got near the green box. It fell for four bars and crossed the stop on the fifth hourly bar of the trade. The trade lost 1R. To track results in R, read our guide to the R-multiple in trading.
What a 2:1 box asks of your trades
A ratio says nothing about odds. It only sets how many trades must reach the target before costs to break even. The formula is 1 / (1 + R). At 1:1 you need 50.0%. At 2:1 you need 33.3%, and at 3:1 you need 25.0%.
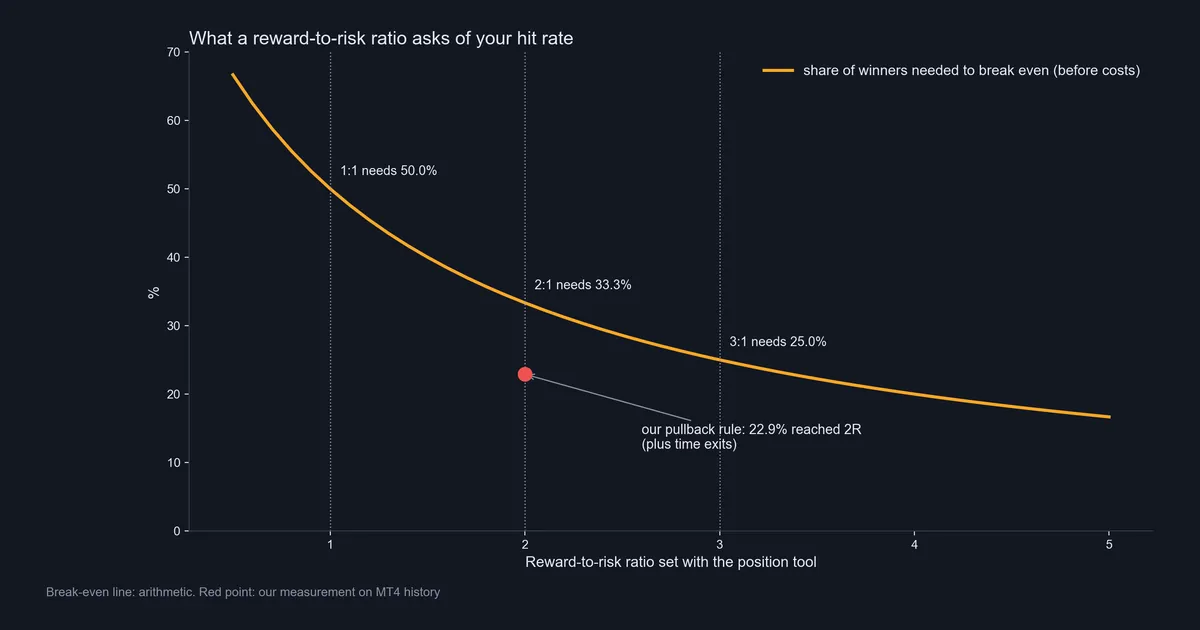
Our pullback rule used a 2R target on every trade. Across 1,737 daily trades, only 22.9% reached the target. Another 55.4% hit the stop, and the rest closed on the time exit. Overall, 38.5% of trades made money, and the total was -20.1R before costs. That is about -0.01R per trade. Still, 12 of 23 pairs ended positive. USDJPY made +19.1R over 66 trades, while AUDUSD lost 16.0R over 67 trades. Those splits are modest and untested out of sample.
In short, the 2:1 box looked good on every one of these setups. The results came from the stops and the market, not the box. Our page on trading expectancy shows how hit rate and ratio combine.
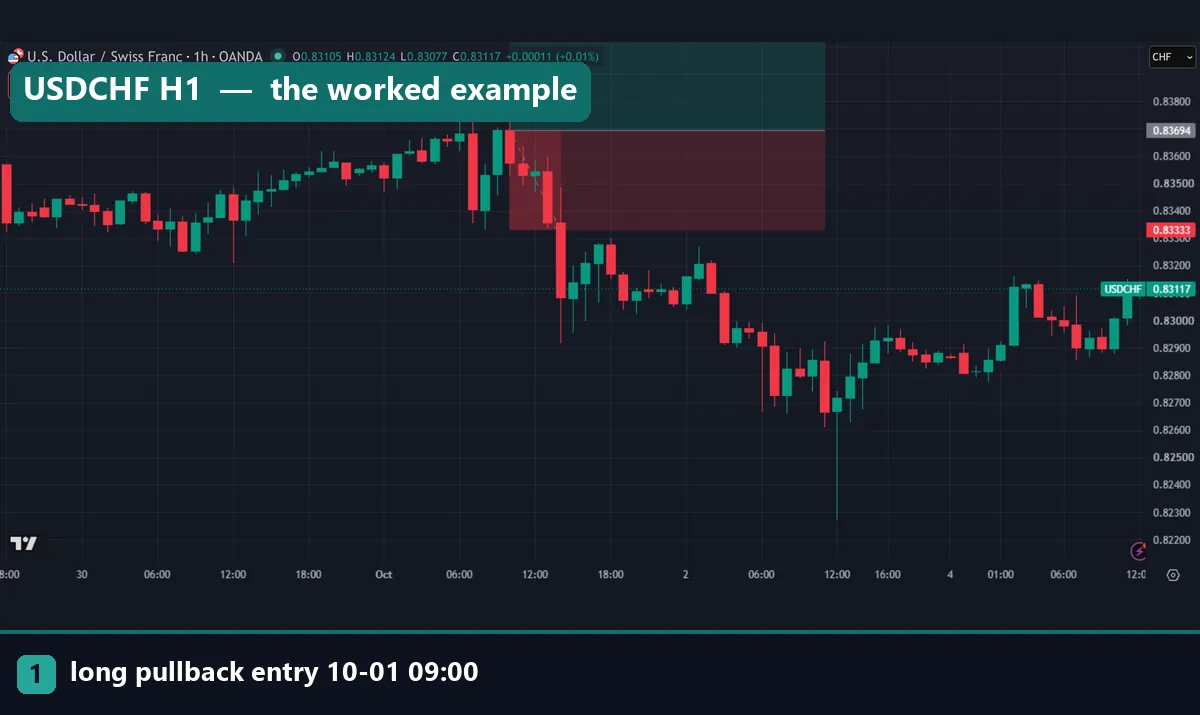
The USDCHF box above is the plan from the worked example. The red zone is darker up to the bar that crossed the stop, then lighter to the right edge.
Download the complete indicator database
Put these concepts on your charts. One email unlocks the full library of 1,380+ indicators with compiled MT4 and MT5 files, plus my TradingView scripts. No paywall, no spam, unsubscribe any time.
Get free access to my indicator database
One email unlocks 1,380+ free MT4, MT5 and TradingView indicators — the complete library. No single-tool download; you get the whole database.
Where it fails
The tool is a useful sketch, but it has real limits. Here are the ones we hit while drawing these boxes.
- No costs. The box ignores spread, swap and commission. On a 13.3-pip stop, even a small spread is a large share of the risk. Our page on backtesting transaction costs shows why this matters.
- No broker rules. Brokers set a minimum stop distance and can fill you at a worse price. The MQL4 book’s page on trade requirements and limits lists the rules MetaTrader enforces. The box knows none of them.
- Which level came first. On the USDCHF box from 30 September, the entry bar dipped below the stop before price later ran through the target. A glance at the green zone suggests a winner. In fact, the stop came first. On a daily bar, one candle can cross both levels, and the chart cannot show the order.
- Hindsight. A box drawn after the move proves nothing.
- Feed differences. Our captures use OANDA data. Your broker’s prices can differ by a few pips, so the same box can hit on one feed and miss on another.
Two daily longs that show the stop’s job
The last two images show long boxes on the daily chart, with very different stops. First, GBPJPY gave a long signal on 10 August 2026. Entry was 215.167, with the stop at 209.575 below the pullback low. That is 5.592 yen of risk, and the target sat at 226.351.
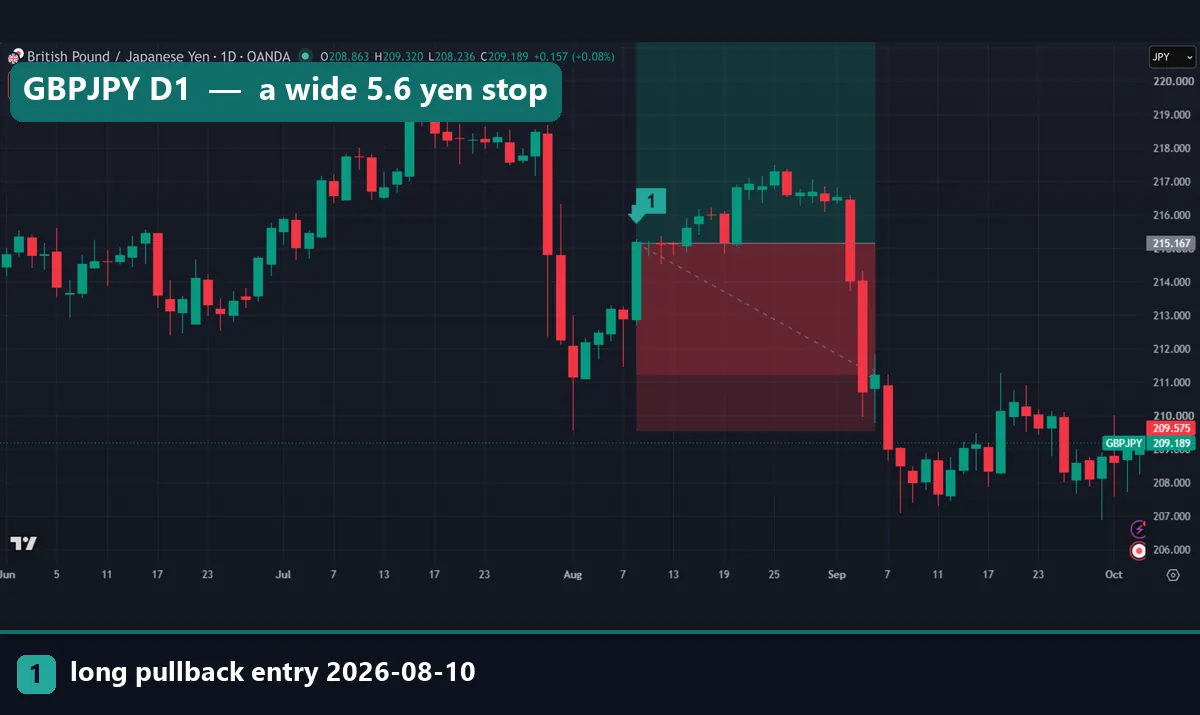
Price rose toward 217 in late August, well short of the target. Then it fell hard in early September and crossed the stop. The wide stop gave room, but made the loss large in pips.
Next, AUDUSD gave a long signal on 11 September. Entry at the next open was 0.71633. The stop at 0.71500 was the signal bar’s low, only 13.3 pips away. The target at 0.71899 was just 26.6 pips up.
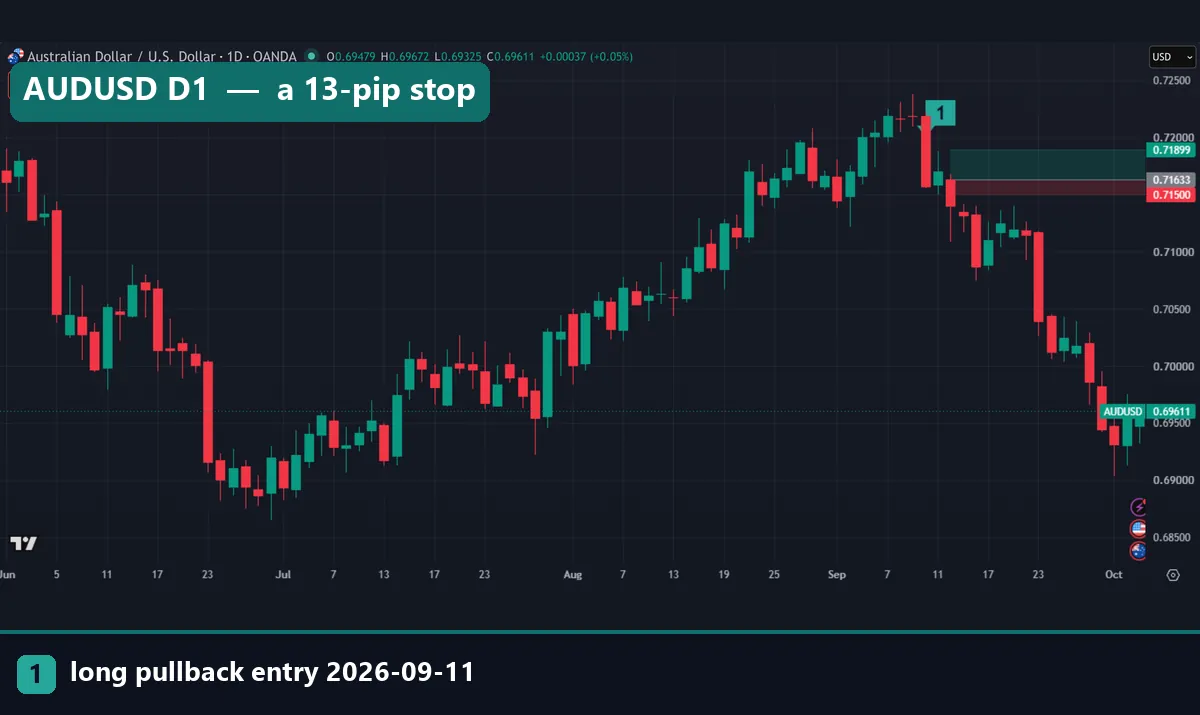
Price fell through that stop within days. A stop that sits inside a normal day’s range tends to get hit by noise. For a stop based on volatility instead, see our guide on using ATR as a stop loss.
Common mistakes with the position tool
- Moving the target to fix the ratio. Dragging the green edge up until the box reads 3:1 changes the number, not the market. Set the stop where your idea is wrong, then see what target fits.
- Mixing ticks and pips. Typing 50 ticks on EURUSD gives a 5-pip stop, not a 50-pip one. Check the axis label after you type.
- Trusting the quantity blindly. The quantity only means something if the account size, risk, lot size and leverage fields match your real account.
- Judging plans by one box. One box is one trade. You need many trades before a ratio and a hit rate mean much. Our page on backtest sample size covers how many.
Where to go next
If you want the ratio side in more depth, our page on risk reward in TradingView and the guide to what makes a good risk reward ratio are the next steps. For stops, read how to use a stop loss. For the money side, our position sizing guide and the free risk reward calculator do the same sums outside the chart.
Outside our site, the reward-to-risk ratio entry at Babypips gives a short definition. The risk/reward ratio explainer at Investopedia adds examples.
FAQ
Where is the long position tool in TradingView?
It sits in the left drawing toolbar, with the forecasting and measurement tools.
Does the long position tool place a real order?
No, it is only a drawing, so nothing reaches your broker.
What is the difference between ticks and price in the settings?
Ticks set a distance from the entry, while price sets an exact level; on five-digit EURUSD, 10 ticks make one pip.
How does the tool calculate the risk to reward ratio?
For a long box it divides the target distance by the stop distance, so a 72.2-pip target over a 36.1-pip stop reads 2.
Can I set an alert on a position box?
Yes, right-click it and pick “Add alert on long/short position” to cover all three levels.
How do I turn a long box into a short one?
Use Reverse from the context menu or the floating panel, and the levels flip around the same entry price.
Is there a keyboard shortcut for the long position tool?
We could not confirm one on TradingView’s help pages, so check your own app first.
Does a 2:1 box make a trade plan profitable?
No, our 2R pullback rule reached its target on 22.9% of 1,737 trades and ended at -20.1R before costs; results are not guaranteed; past performance is not indicative of future results.
Last updated: 5 October 2026.

About the author
Written by Dominic Walsh, a Forex trader and MT4/MT5 indicator, Expert Advisor and script developer. Every tool on forexmt4systems.com is tested on live charts before release and ships with ready-to-use compiled MT4 (.ex4) and MT5 (.ex5) files. Learn more about the trader and developer behind this site.
How we build, test and correct every tool: Editorial & Testing Policy. Trading carries risk; see the disclaimer.