
Bullish or bearish comes down to one question: do you expect prices to rise or fall? The words sound simple, but the market versions hide a trap. The popular 20% rule can only name a bull or bear market after the turn has happened. This guide settles what each word means, how the rule works and what the label is worth. We ran it on S&P 500 closes from June 1939 to 2 November 2026, then tested a live label on eight markets.
What bullish or bearish actually means
Bullish means you expect prices to rise. Bearish means you expect them to fall. The CFTC glossary of futures terms says it plainly: a bull expects a rise in prices, and a bear expects a decline.
So the words have two uses, and mixing them causes most of the confusion. The first is an opinion. You can be bearish on EUR/USD for an hour and bullish for the year. The second is a market state: a bull market or a bear market. That use describes a long stretch of prices. The CFTC glossary says only “a period of months or years” and gives no number.
Any number comes from convention. The common definition says a 20% fall from a high is a bear market, and a 20% rise from a low is a bull market. The bear market entry in the SEC’s Investor.gov glossary uses that line for a broad index. It also says “generally” and adds “over at least a two-month period”. So this is a habit of speech, not a law. For smaller falls, our market correction guide covers the zone under 20%.
How the 20% rule labels a market
The rule needs only closes and two small sums.
fall from high = (close / highest close so far - 1) x 100
rise from low  = (close / lowest close so far - 1) x 100
During a bull phase, we track the highest close. When a close sits 20% under it, the phase flips to bear. Then the rule dates the start of that bear back to the old high. Next we track the lowest close. When a close sits 20% over it, the phase flips to bull, and the start goes back to that low.
That back-dating is the whole problem. You only know a high was the high after a 20% fall. You only know a low was the low after a 20% rise. So every start date in our table came later, and nobody could read it on the day. That is the main point of this guide, and the rest measures its cost.
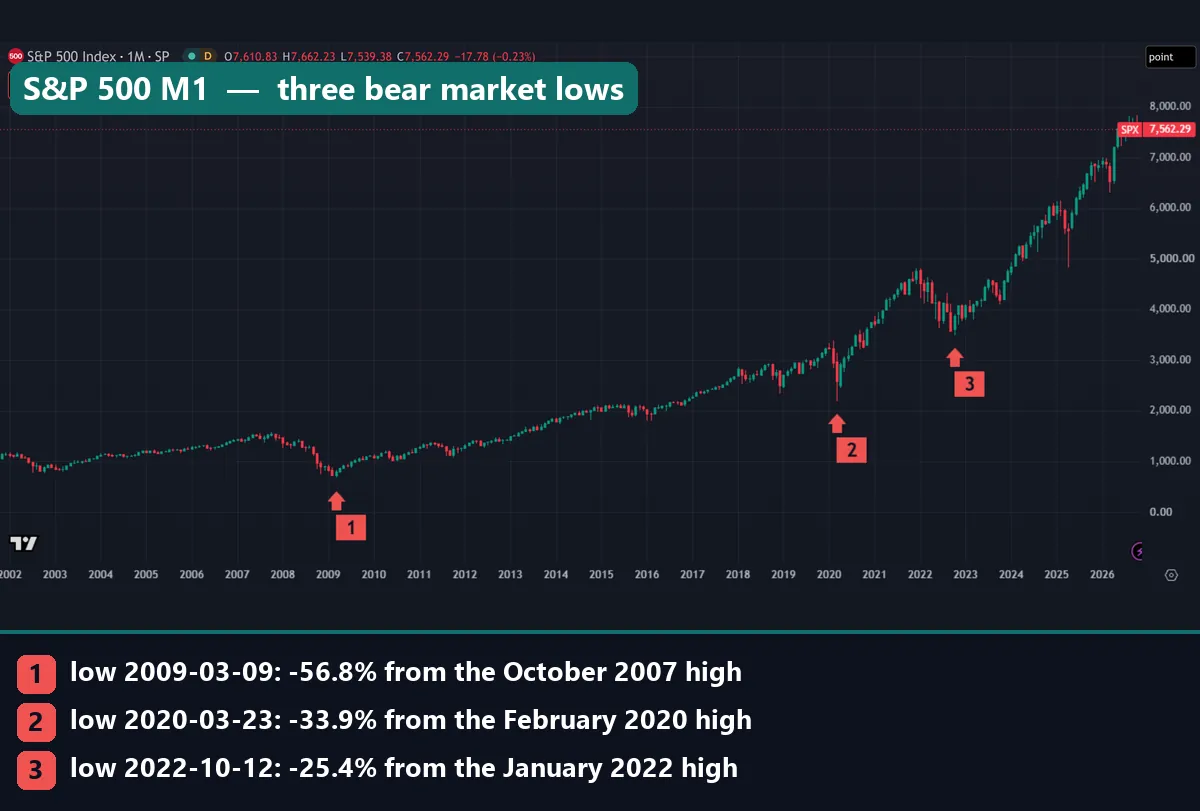
The rule also works in percent for a good reason. On the first chart, the fall to marker 1 cost 888.62 points and the fall to marker 3 cost 1,219.53 points. In percent, those falls were -56.8% and -25.4%. On a linear chart, old falls look small and new ones look huge. Our guide to what indices are and how they are built explains the number itself.
How we tested
We pulled daily SP:SPX bars from the TradingView web chart on 3 November 2026. The window runs from 15 June 1939 to 2 November 2026, which is 22,000 closes. Before March 1957 the series is the index’s smaller predecessor. Wikipedia’s S&P 500 history dates the move to 500 companies, and the name, to 4 March 1957.
The second test covers eight markets: S&P 500, Nasdaq 100, gold, EUR/USD, GBP/USD, USD/JPY, Bitcoin and USOIL. Each runs from its first bar in our pull, from 1939 for the S&P to August 2011 for Bitcoin, to 2 or 3 November 2026. For each day, we asked two things. Was the close above its 200-day average? And was the close higher 20 trading days later?
Three limits apply. First, those 20-day windows overlap heavily, so the true sample sits far below the day count. Second, every result comes before spread, swap, financing, commission and dividends, and the S&P figures are price only. Third, readings dated 3 November are mid-session quotes. Our editorial testing policy sets out the standard we work to.
Settings behind our bull and bear labels
These choices drive the result. Change one, and the history changes with it.
| Setting | Our value | If you move it |
|---|---|---|
| Price used | Daily close | Intraday highs and lows add falls such as 2011 and 2018 |
| Bear line | 20% under the highest close | A lower line adds the near misses |
| Bull line | 20% over the lowest close | A lower line ends bears sooner |
| Minimum length | None | The SEC’s two-month clause would drop 2020 |
| Live label | 200-day simple average | A shorter average reacts sooner |
| Forward check | 20 trading days | Other horizons give other figures |
| Costs | None deducted | Real trading pays them |
The average is a plain one. TradingView’s Simple Moving Average help page defines it as the sum of the last X values divided by X. Our page on moving averages explained covers the wider family.
Reading bull and bear phases on a chart
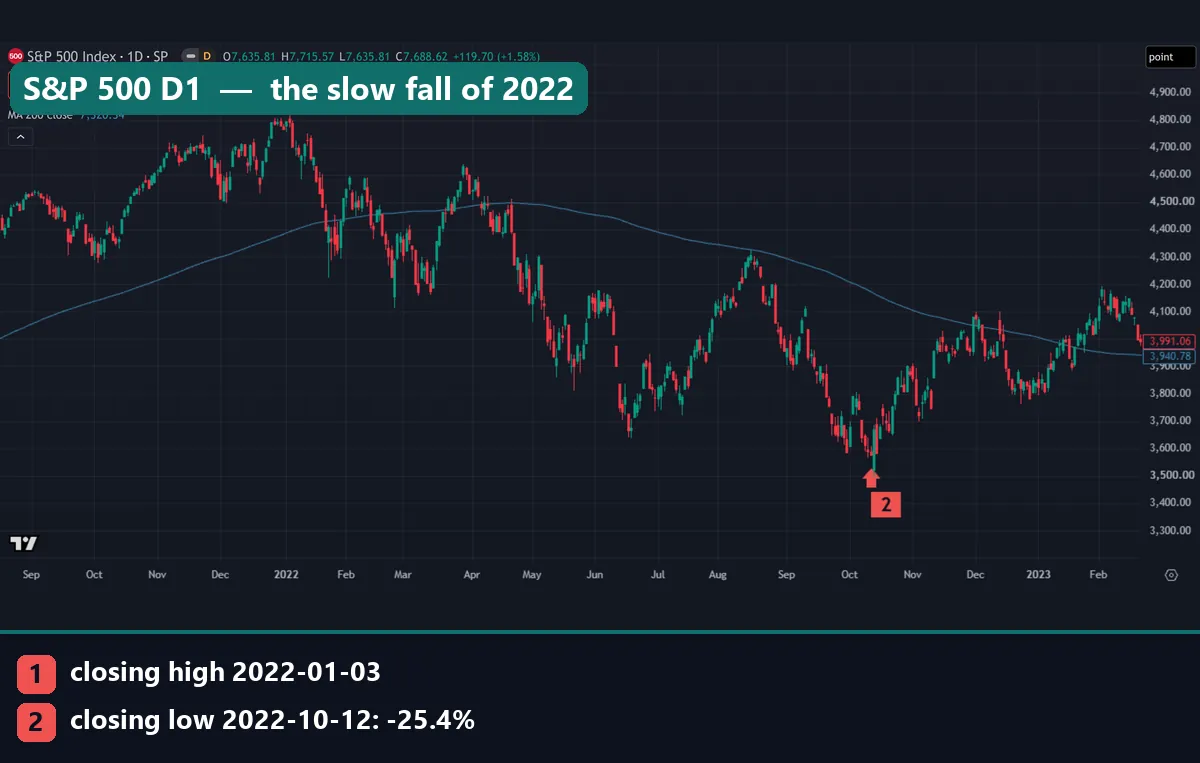
Start with 2022, a slow fall. The closing high came on 3 January at 4,796.57, marker 1. The low came on 12 October at 3,577.04, marker 2, a drop of 25.4%. Blue marks the 200-day average. Price first closed under it on 21 January, only 8.3% off the high.
Now look at the rally from June into August. The index rose 17.4%, from 3,666.76 on 16 June to 4,305.19 on 16 August. That fell short of 20%, and it stopped just under the blue line. So the rule stayed bear, and a lower low followed.
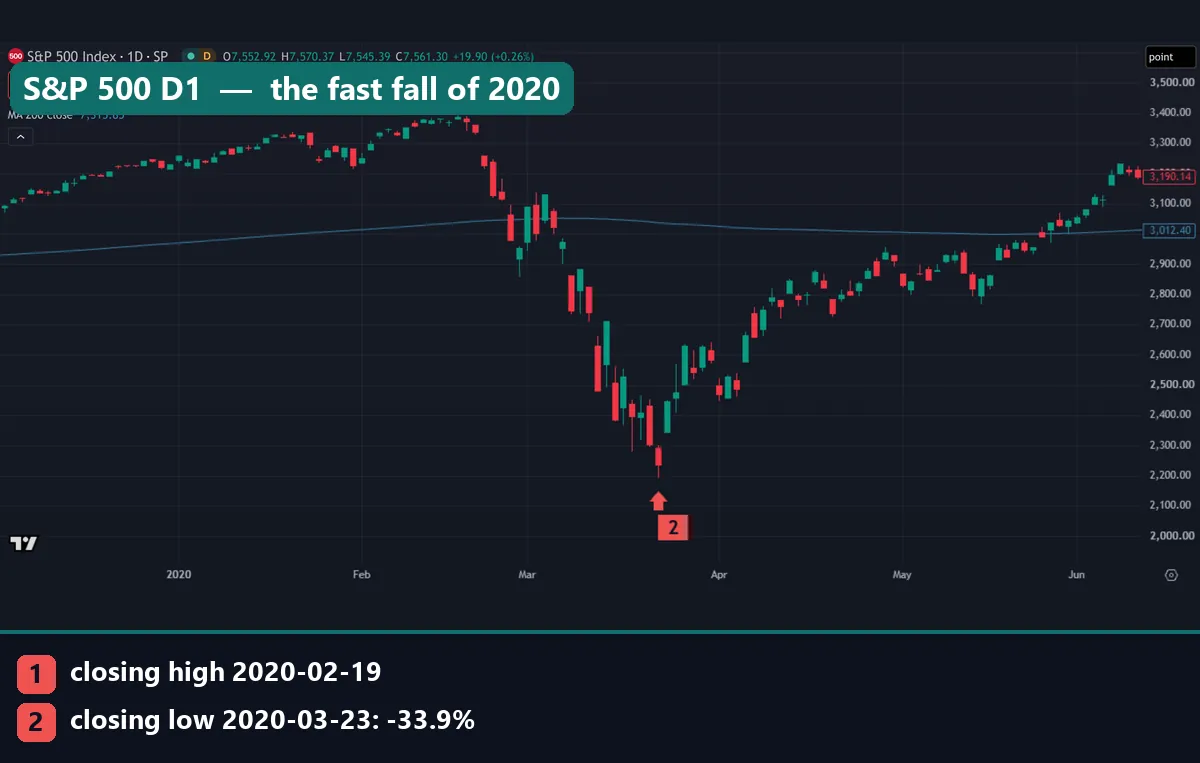
Then compare 2020, a fast fall. The high of 3,386.15 came on 19 February, and the low of 2,237.40 came on 23 March. That is -33.9% in 23 trading days. At the low, price sat 26.3% under the average, and the blue line barely moved. Here the average was the slow test: price closed back above it on 27 May, 35.7% over the low.
Worked example: how late the label arrived
Take 2022 step by step. The bear line sat at 4,796.57 x 0.80 = 3,837.26. The first close under it came on 13 June 2022 at 3,749.64, 111 trading days after the high. By then the index was already down 21.8%, against a final -25.4%.
The bull line sat at 3,577.04 x 1.20 = 4,292.45. The first close over it came on 8 June 2023 at 4,293.92, 164 trading days after the low. So the bull label arrived 14.5% above the level where the bear label appeared.
| Fall | Closing high | First close 20% under | Closing low | First close 20% over |
|---|---|---|---|---|
| 2007 to 2009 | 1,565.15, 9 Oct 2007 | 1,244.68, 9 Jul 2008 (188 days) | 676.53, 9 Mar 2009 (-56.8%) | 822.92, 23 Mar 2009 (10 days) |
| 2020 | 3,386.15, 19 Feb 2020 | 2,480.64, 12 Mar 2020 (16 days) | 2,237.40, 23 Mar 2020 (-33.9%) | 2,749.98, 8 Apr 2020 (12 days) |
| 2022 | 4,796.57, 3 Jan 2022 | 3,749.64, 13 Jun 2022 (111 days) | 3,577.04, 12 Oct 2022 (-25.4%) | 4,293.92, 8 Jun 2023 (164 days) |
The lag has no fixed size: 10 days in 2009, but 164 after 2022. Also, this table is not a trading test, because three falls prove nothing. It shows only when each word became true by the rule, and that always came after the turn.
What 87 years of S&P 500 phases show
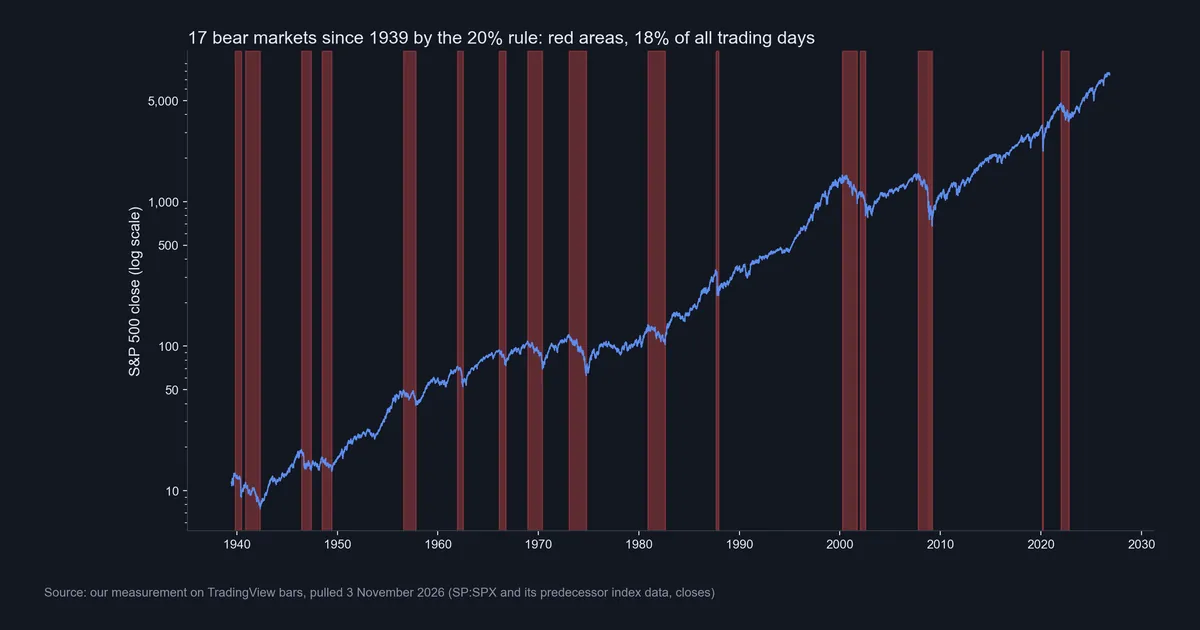
By the rule on closes, our window holds 17 bear markets, the red areas above. They cover 18.1% of trading days. The median bear lasted 243 trading days and fell 31.9%. By contrast, the median finished bull lasted 913 trading days and rose 86.4%.
The extremes are wide. At one end sits 2020, the shortest bear at 23 days. The longest ran from January 1973 to October 1974, at 436 days and -48.2%. On the bull side, December 1987 to March 2000 ran 3,107 days and rose 582.3%.
The current bull began on 12 October 2022. It stood 110.8% higher after 1,017 trading days on 2 November 2026. It has not finished, so it sits outside the medians. Our pull also starts mid-run, so the first bull in the list is a stub of +17.4%. Without it, the median bull becomes 967 days and +91.2%.
Keep in mind what this record is: one rising index that replaces its members over time. That does not carry over to a single stock or a currency. Our page on drawdown in trading shows what falls of this size do to an account.
Does the label help? The 200-day test
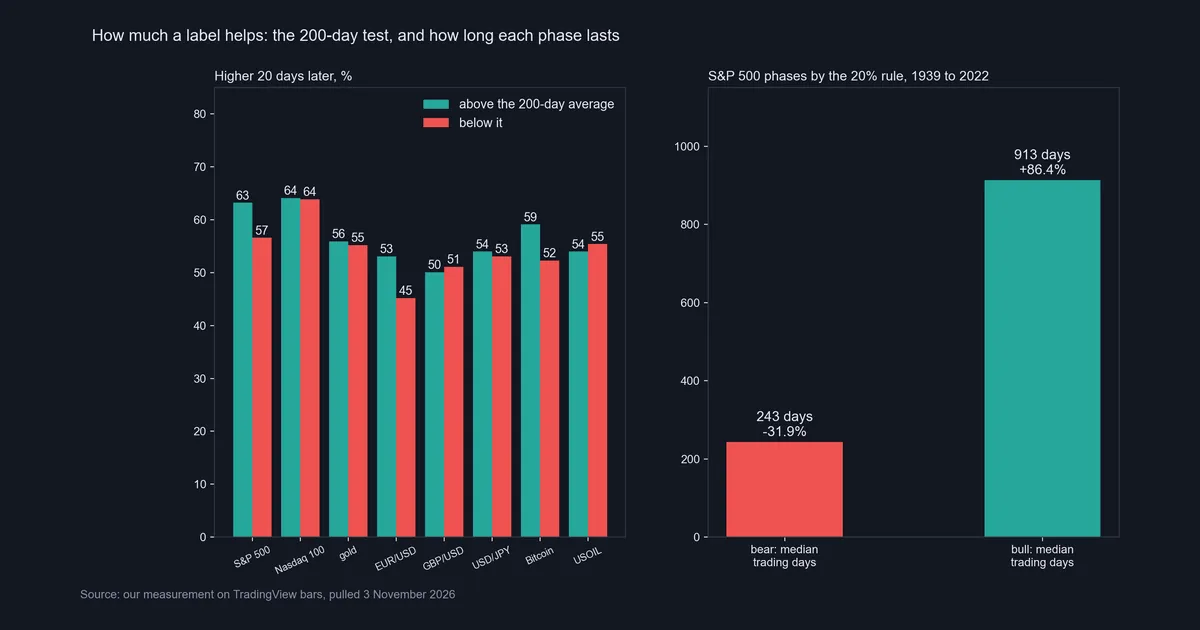
The 20% rule comes late, so the 200-day average is a common live stand-in. We asked whether it changes the next 20 days.
| Market | Higher after 20 days: above average | Below average | Median move: above | Median move: below |
|---|---|---|---|---|
| S&P 500 | 63.2% | 56.6% | +1.09% | +0.82% |
| Nasdaq 100 | 64.1% | 63.9% | +1.54% | +2.79% |
| Gold | 55.9% | 55.2% | +0.64% | +0.57% |
| EUR/USD | 53.1% | 45.2% | +0.18% | -0.25% |
| GBP/USD | 50.1% | 51.1% | +0.01% | +0.06% |
| USD/JPY | 54.0% | 53.1% | +0.22% | +0.19% |
| Bitcoin | 59.1% | 52.3% | +3.01% | +0.54% |
| USOIL | 54.0% | 55.4% | +0.96% | +1.42% |
So the label helps on some markets and does nothing on others. The S&P 500, EUR/USD and Bitcoin show gaps of 6.6 to 7.9 points. Nasdaq 100, gold and USD/JPY show under one point. GBP/USD and USOIL lean the wrong way. Note too that the S&P still rose 56.6% of the time below its average, so bearish never meant falling next.
Is the market bullish or bearish right now?
Here is our reading from 3 November 2026, and it is a snapshot, not a call. The S&P 500 closed at 7,541.40 on 2 November. That sits above its 200-day average of 7,312.74 and 3.5% off its high, so both tests read bull for now. The Nasdaq 100 is 10.4% off its high and only just above its average. Gold and EUR/USD are both below theirs.
These readings go stale fast, and they say nothing about next month. For the mood behind them, see how to read market sentiment and the fear and greed index.
Download the complete indicator database
Put these concepts on your charts. One email unlocks the full library of 1,380+ indicators with compiled MT4 and MT5 files, plus my TradingView scripts. No paywall, no spam, unsubscribe any time.
Get free access to my indicator database
One email unlocks 1,380+ free MT4, MT5 and TradingView indicators — the complete library. No single-tool download; you get the whole database.
Where it fails: the oddities of the 20% rule
The strangest case is the financial crisis. The whole fall from the October 2007 closing high to the 9 March 2009 low was -56.8%, from 1,565.15 to 676.53. But the strict rule splits it in two. One bear runs to 20 November 2008 at -51.9%. Then a “bull” runs to 6 January 2009, up 24.2% in 30 trading days. A second bear then runs to March 2009 at -27.6%.
That bull sat inside the crisis, and our The Big Short guide tells the wider story. Its label appeared on 8 December 2008 at 909.70, and the bear label came back on 23 February 2009 at 743.33. The rule splits 2000 to 2002 the same way: -36.8%, a 72-day bull of +21.4%, then -31.9%. Merge those two pairs, and our count falls from 17 to 15.
Near misses do not count at all. On closes, 2011 fell 19.4% and 2018 fell 19.8%, so neither is a bear market. Yet on intraday highs and lows they fell 21.6% and 20.2%. A few tenths decide the history. The rule can also start a bull on a low that later breaks: 798.61 in July 2002 gave way to 776.77 in October, because that fall stopped at 19.3%.
The SEC’s two-month clause fixes some of this and breaks the rest. Read literally, it drops the 2008 bounce, but it also drops the 2020 fall, which took under five weeks. No version is correct, because each one is a convention.
Where it fails on forex and gold
Forex has no agreed bull or bear. A pair falling is the other currency rising. So a EUR/USD bear market is also a dollar bull market against the euro. All major currency pairs work this way. The dollar index tries to measure one side alone.
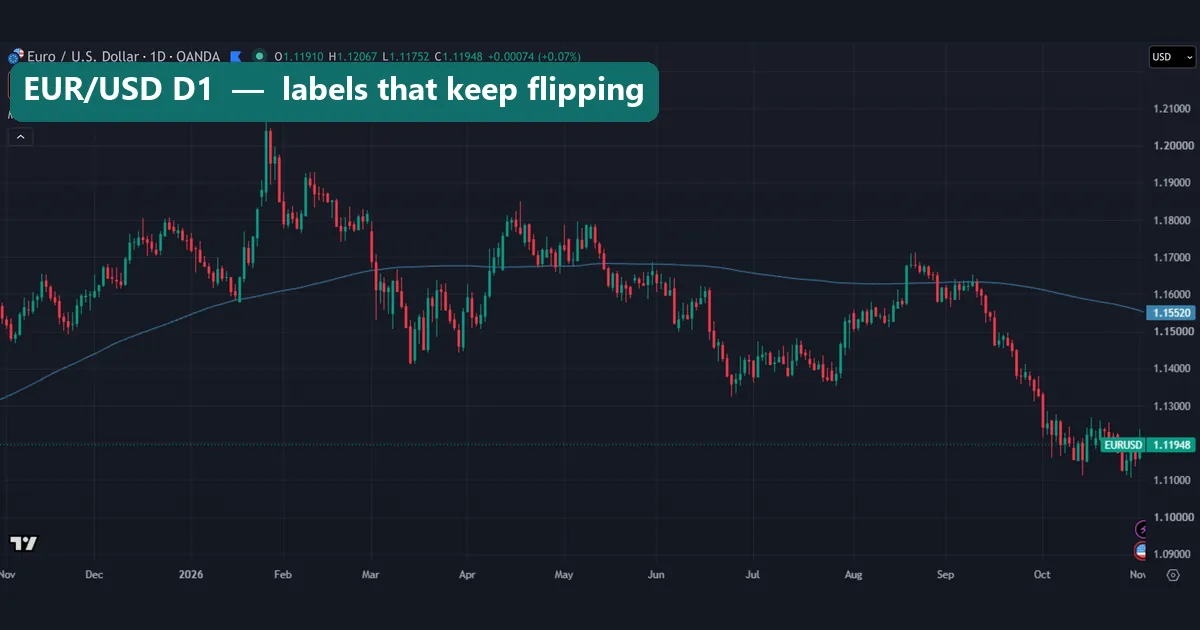
EUR/USD shows the problem. Its close sits 30.0% under a high from April 2008, yet that high is 18 years old. Over the 260 bars in this shot, the pair closed across its 200-day average 9 times. Each cross flips the label, which is whipsaw in trading in its plainest form.
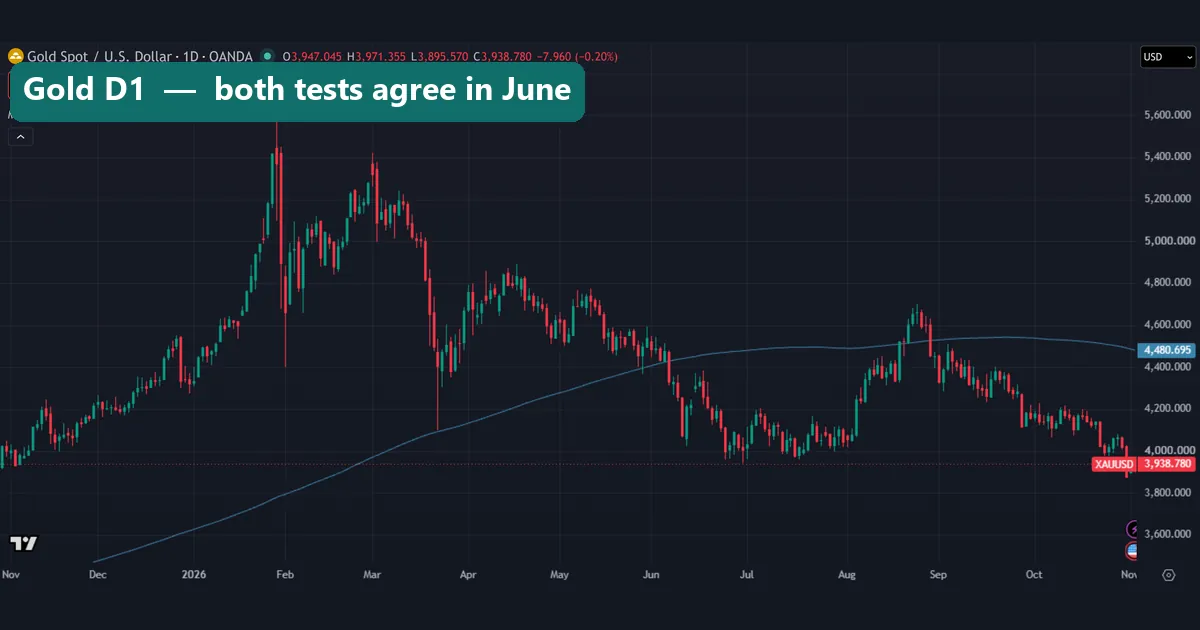
Gold fits the stock rule better. It set a closing high of 5,418.55 in late January 2026. Then it first closed 20% under that in early June, at 4,327.89, the same session it first closed under its average. Both tests agreed, but only after a -20.1% fall. Gold stood 27.9% off its high in our pull.
Bitcoin gives the odd result. It sits 38.0% under its high, yet 32.1% over its June 2026 low, so the strict rule reads a new bull there.
Common mistakes with bull and bear labels
Four errors account for most of the trouble.
- Treating the label as a forecast. A bear label says a 20% fall already happened. It does not say the next 20 days will fall.
- Mixing your view with the market state. You can hold a bearish view on a pair for an afternoon while an index sits in a bull market. So name the timeframe each time.
- Copying stock lines to forex. A 20% line suits a broad stock index. Our market correction guide shows why even 10% is a high bar for forex.
- Reading one candle as a market call. A bullish candlestick or a bearish candlestick pattern describes a few bars. A bull market describes months or years.
Where to go next
Treat the label as a description of what already happened, and build any decision on a plan with defined risk. Our guide on how to use a stop loss is a sensible next step. If the 200-day test interests you, read how moving averages work before you trust any cross.
We cite the CFTC and SEC glossaries for wording, Wikipedia for the 1957 date and TradingView for the average. The measurements are ours alone.
FAQ: bullish or bearish questions answered
Does bullish mean up or down?
Bullish means up, and bearish means down. Each word describes what someone expects prices to do next, over whatever timeframe they have in mind.
What percentage makes a bear market?
The common line is a 20% fall from a high on a broad index. It is a convention, and the SEC’s glossary says “generally” and adds a two-month period. Our test uses closes and no minimum length.
How long does a bear market last?
The median in our S&P 500 window is 243 trading days, with a fall of 31.9%. The range runs from 23 days in 2020 to 436 days in 1973 and 1974.
How long does a bull market last?
The median finished bull ran 913 trading days and rose 86.4%. The longest ran 3,107 days, from December 1987 to March 2000.
Can you tell a bull or bear market in real time?
Not by the 20% rule, because a low only proves itself after a 20% rise. The October 2022 low took 164 trading days to confirm. The 200-day average gives a live reading, but it flips often.
Is forex bullish or bearish?
Forex has no agreed answer, because a pair falling is the other currency rising. You can hold a bullish view on one pair, but no accepted 20% style line exists for currencies.
Is the S&P 500 bullish or bearish today?
On 2 November 2026 it closed above its 200-day average and 3.5% off its high. Both tests read bull that day. That is a snapshot, not a call.
Does a bullish label mean prices will keep rising?
No. The S&P 500 finished higher 20 days later 63.2% of the time above its average, and 56.6% below it. On GBP/USD and USOIL the label leaned the other way. A label describes the past, so results are not guaranteed; past performance is not indicative of future results.
Last updated: 3 November 2026.

About the author
Written by Dominic Walsh, a Forex trader and MT4/MT5 indicator, Expert Advisor and script developer. Every tool on forexmt4systems.com is tested on live charts before release and ships with ready-to-use compiled MT4 (.ex4) and MT5 (.ex5) files. Learn more about the trader and developer behind this site.
How we build, test and correct every tool: Editorial & Testing Policy. Trading carries risk; see the disclaimer.