
What are imports? They are the goods and services a country buys from sellers abroad. For the US, our TradingView series starts at $0.59bn a month in January 1950. The official release of 4 November 2026 puts September 2026 at $426.6bn, the highest month on its monthly record. This guide settles what that number counts, how it fits with exports and the trade balance, and how much a forex trader can read from it. The answer is less than many expect.
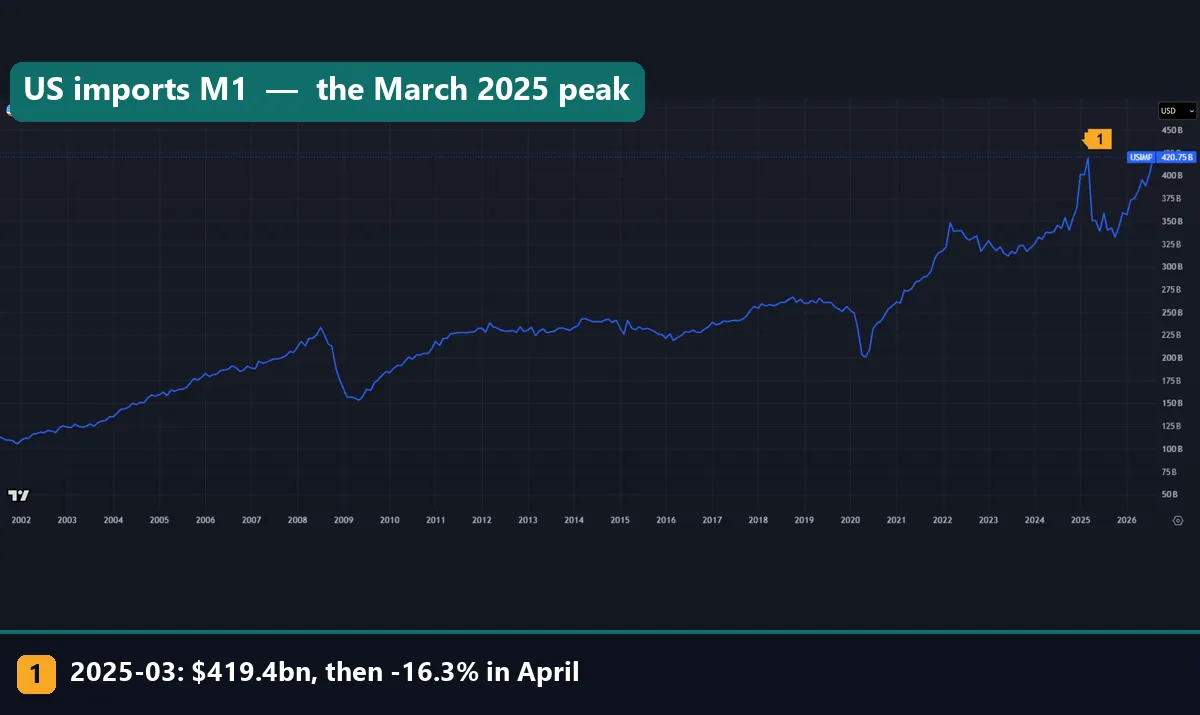
The monthly line climbs from just over $100bn at the start of 2002 to $420.75bn in August 2026, the last bar on TradingView when we pulled it. Marker 1 is March 2025, at $419.4bn on this series, and a sharp drop follows in April. One caution covers every capture here: the top row shows the latest value on capture day, which is not always a bar in view.
What are imports, in the official sense
The US figures come from a joint monthly release by the Census Bureau and the Bureau of Economic Analysis (BEA). Its explanatory notes, in BEA’s September 2026 trade release, spell out what counts. Goods imports come from documents that US Customs and Border Protection collects. They cover goods arriving from foreign countries into the 50 states, Washington DC, Puerto Rico, the US Virgin Islands and foreign trade zones.
Customs records each shipment at its appraised value, which in most cases means the price the buyer paid. Import duties, freight and insurance stay out of that value. So when a tariff applies, the duty itself does not appear in the import figure. Services then sit on top of goods: travel, transport, fees for intellectual property and more. In September 2026, goods made up $346.9bn of imports and services $79.7bn, or 18.7% of the total.
Exports are the mirror image: goods and services that US sellers supply to buyers abroad. In short, imports measure money that flows out for things made or supplied elsewhere, in current dollars. They are not a count of what Americans consume.
How imports, exports and the balance fit together
Three lines of arithmetic cover most of what the release reports.
trade balance  = exports - imports
exports cover  = exports / imports x 100
monthly change = (this month / last month - 1) x 100
A negative balance is a deficit. Take September 2026: exports of $321.5bn minus imports of $426.6bn gives -$105.1bn from the rounded figures. The release says -$105.0bn because it works from unrounded data. Exports covered 75.4% of imports that month. In January 2002 they covered 73.3%, so the share has barely moved in 24 years.
The dollar gap is another matter. It grew from $28.8bn in January 2002 to $105.0bn, because a similar shortfall now applies to a much larger flow. Over that span exports grew 4.06 times and imports 3.95 times. The total also hides two parts with opposite signs. In September, goods ran a $135.9bn deficit while services ran a $30.9bn surplus. So when a headline quotes “the deficit”, check which one it means.
How we tested
We read three monthly series on the TradingView web chart: ECONOMICS:USIMP for imports, ECONOMICS:USEXP for exports and ECONOMICS:USBOT for the balance. All three cover US goods and services in current dollars, with seasonal swings taken out. We pulled the bars on 6 November 2026. Imports run from January 1950 to August 2026, while exports and the balance run to September 2026. We also pulled TVC:DXY, the US dollar index, on a monthly chart. If the platform is new to you, our TradingView chart guide covers the basics.
Next we checked the data. We compared every month since January 1992 with the monthly table that comes with the 4 November 2026 release. For earlier years we used the Census Bureau’s annual goods and services table since 1960. Our MetaTrader 4 history (Capital Point Trading, build 1471) holds no trade data, so MT4 played no part. We placed no trades, so no figure here includes spread, swap or commission. Our editorial testing policy explains how we report numbers like these.
Measurement settings
| Setting | What we used |
|---|---|
| Platform | TradingView web chart, bars pulled 6 November 2026 |
| Imports | ECONOMICS:USIMP, January 1950 to August 2026 |
| Exports | ECONOMICS:USEXP, January 1950 to September 2026 |
| Balance | ECONOMICS:USBOT, January 1950 to September 2026 |
| Basis | Goods and services, monthly, seasonally adjusted, current dollars |
| Dollar index | TVC:DXY, monthly bars |
| Link test | 12-month change in imports vs 12-month change in DXY, 656 months |
| Official check | Release of 4 November 2026 (monthly from 1992); Census annual table from 1960 |
| Costs | None modelled; no trades placed |
Reading the trade balance chart
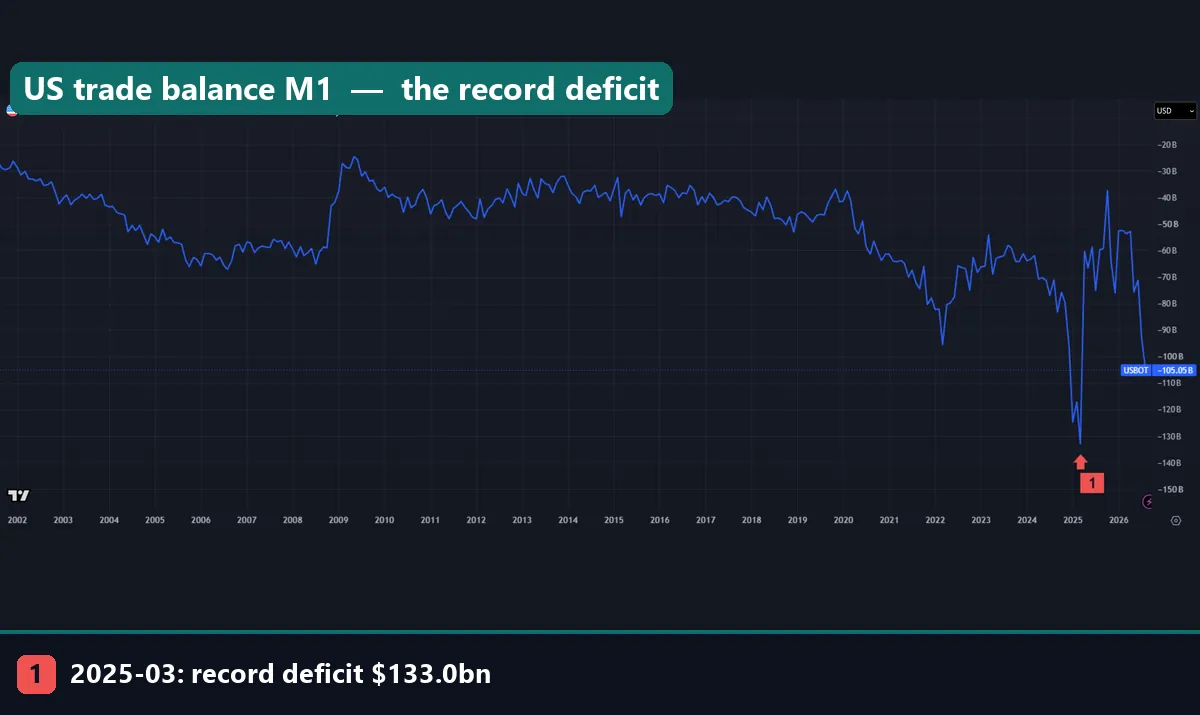
Every month on this chart sits below zero, so every month from 2002 to September 2026 was a deficit. The shallowest point in view is May 2009, at -$24.65bn. From July 2008 to May 2009 imports fell by about a third, while exports fell 23.4%, so the gap closed. In spring 2020 the reverse happened: exports fell harder, and the deficit widened.
Marker 1 is the deepest point: a record deficit of $133.0bn in March 2025. One month later the gap was $60.3bn, less than half. Before 2025, the worst month in view was December 2024, at $96.85bn, just ahead of March 2022 at $95.5bn. Exports barely moved in that swing, from $274.8bn in January to $290.6bn in April, so imports drove it. The line ends at -$105.05bn for September 2026.
Reading the export chart
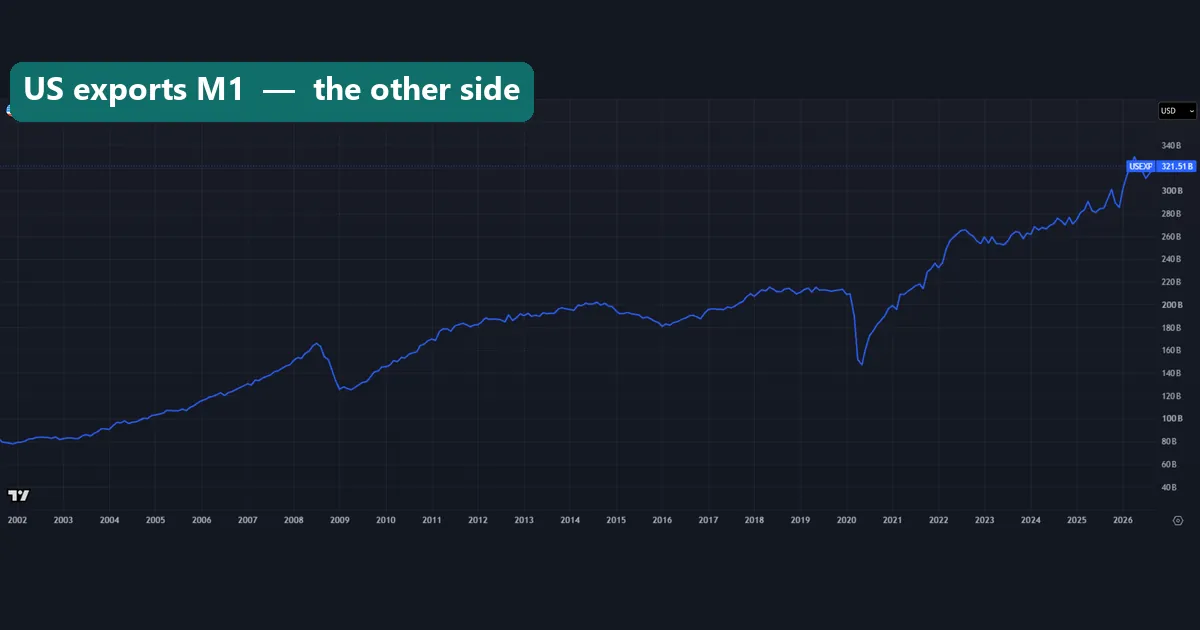
The export line starts near $79bn in January 2002 and ends at $321.51bn in September 2026. Its high in view is April 2026, at $329.9bn. The same two dips show here as on the import chart. From July 2008 to April 2009 exports fell from $166.1bn to $125.2bn. Then from February to May 2020 they fell 29.8%, from $209.5bn to $147.1bn, the sharpest drop on this chart.
Exports rise in a smoother line, while imports carry the sharp spikes. In the official monthly table since 2002, swings in the balance followed imports far more closely than exports. So imports are the line to watch when a release surprises.
Worked example: early 2025, two versions of the same months
Early 2025 is the clearest case on these charts, and it shows why you should check the source. The table sets the TradingView series beside the official monthly table, as revised in the 4 November 2026 release.
| Month | TradingView series ($bn) | Official table ($bn) |
|---|---|---|
| December 2024 | 364.6 | 367.5 |
| January 2025 | 401.2 | 399.5 |
| February 2025 | 401.1 | 397.6 |
| March 2025 | 419.4 | 416.4 |
| April 2025 | 350.8 | 350.9 |
| Change into January | +10.0% | +8.7% |
| Change into April | -16.3% | -15.7% |
Work the April change from the official column: (350.9 / 416.4 – 1) x 100 = -15.7%. That is the largest one-month fall in the official table since it starts in January 1992. Next come April 2020 at -12.0% and November 2008 at -11.7%. On the TradingView series the same month reads -16.3%, because its March figure sits $3.0bn higher. The record deficit of $133.0bn in March 2025 matches on both.
Why did imports jump and then fall? Our data cannot say, but the record does show the timing. Executive Order 14257 on the White House site, dated 2 April 2025, set a 10% duty from 5 April and higher country rates from 9 April. Later orders changed those rates, and we do not track them here. Buying ahead of a known tariff would produce this shape. However, the release measures flows, not motives, so we stop at the timing.
Seventy-six years of imports and exports
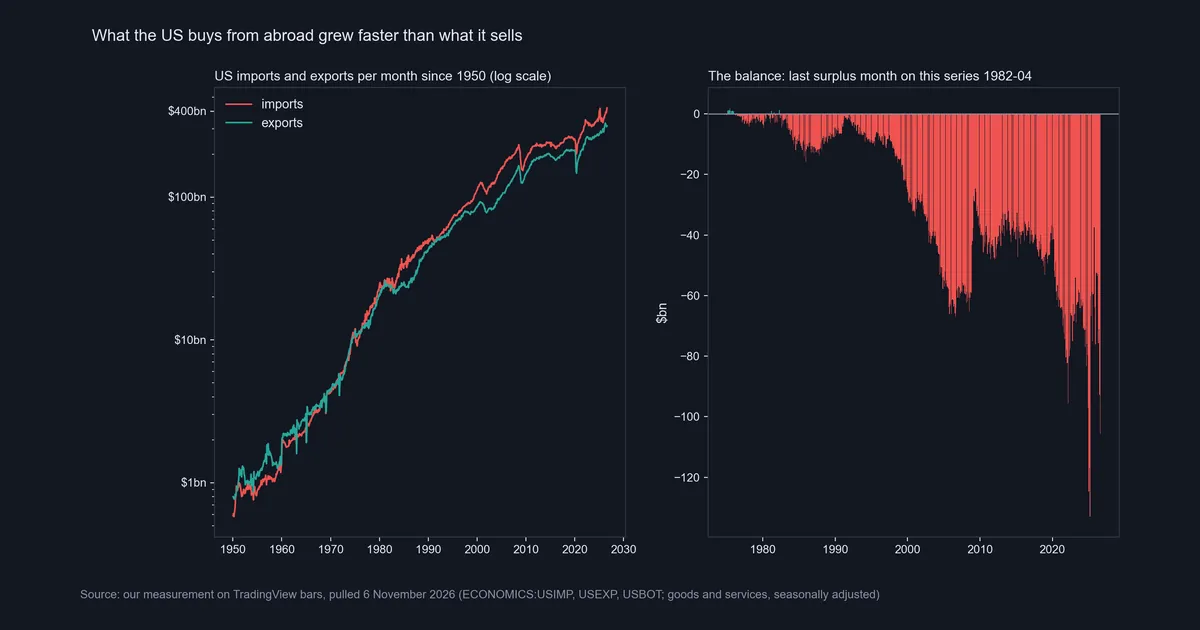
On a log scale, equal distances mean equal percentage changes. Imports rise from $0.59bn a month in January 1950 to $420.75bn in August 2026, about 711 times. Exports sit above imports through most of the 1950s and 1960s, then the lines trade places in the 1970s. In the right panel, the last surplus month on this series is April 1982, at $1.32bn, and 533 straight deficits follow.
Two warnings apply to the early years. First, look at the step in January 1960: imports jump 39% in one month, from $1.35bn to $1.88bn. That looks like a change in how the series is built, not a real jump. The Census table starts in 1960 and puts 1960 imports at $22.4bn, of which goods made up $14.8bn. This series adds up to $15.2bn for 1959, close to that goods-only level. So the 1950s part probably leaves out services.
Second, the monthly figures before 1992 do not match the official record. BEA’s monthly goods and services table starts in January 1992. Before that, the Census table gives yearly totals only, and this series misses them. For 1982 it sums to -$19.3bn against an official -$24.2bn, and for 1991 to -$20.4bn against -$31.1bn. So treat the April 1982 surplus as a feature of this series. Officially, the last surplus year was 1975, at $12.4bn, and every month since January 1992 shows a deficit.
Month by month since January 2024
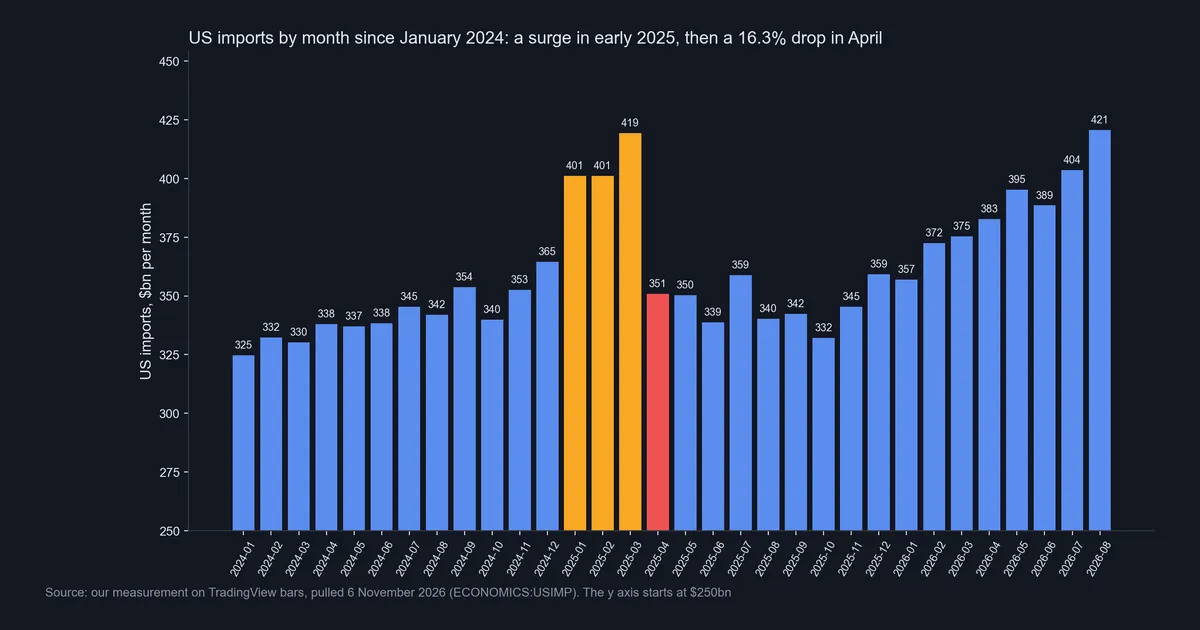
This chart shows the last 32 months of the TradingView series. The orange bars are January to March 2025, at 401, 401 and 419 ($bn). The red bar is April, at 351. After that, imports drift lower, unevenly, to 332 in October 2025, then climb to 421 in August 2026. Note that the y axis starts at $250bn, which makes every change look bigger than it is.
Year on year, August 2026 is up 23.7% on this series and 22.4% on the official table. The official September figure, $426.6bn, is up 21.3% on a year earlier. None of these bars adjusts for prices.
Download the complete indicator database
Put these concepts on your charts. One email unlocks the full library of 1,380+ indicators with compiled MT4 and MT5 files, plus my TradingView scripts. No paywall, no spam, unsubscribe any time.
Get free access to my indicator database
One email unlocks 1,380+ free MT4, MT5 and TradingView indicators — the complete library. No single-tool download; you get the whole database.
Where it fails: imports as a trading signal
The number is late. September’s data came out on 4 November, about five weeks after the month closed. Our pages on forex news release times and high-impact news explain where this release sits.
The number changes later. According to the release notes, each June brings annual revisions, and each month revises the month before. TradingView’s import line differs from the official table by more than $0.1bn in 329 of the 416 months since 1992, and by up to $9.4bn. For example, September 2025 reads $342.4bn on the chart and $351.7bn officially. Its export and balance lines match in all 416 months, so on TradingView exports minus imports does not equal the balance.
Prices sit inside the number. The release adjusts for seasons but not for price changes. In September, real goods imports rose 1.4% while the nominal figure rose 2.4%. So part of any rise can be higher prices rather than more goods. Our guide to how inflation affects forex covers that side.
The dollar link is weak. Over 656 months, the 12-month change in imports and the 12-month change in the dollar index correlate at -0.14. Part of the reason may be the index itself. ICE’s US Dollar Index page describes six currencies, with the euro’s share fixed at 57.6%. Yet September’s largest goods deficits were with Mexico ($28.7bn), Vietnam ($25.3bn), Taiwan ($21.9bn) and China ($17.9bn).
The 2020 drop and the dollar index
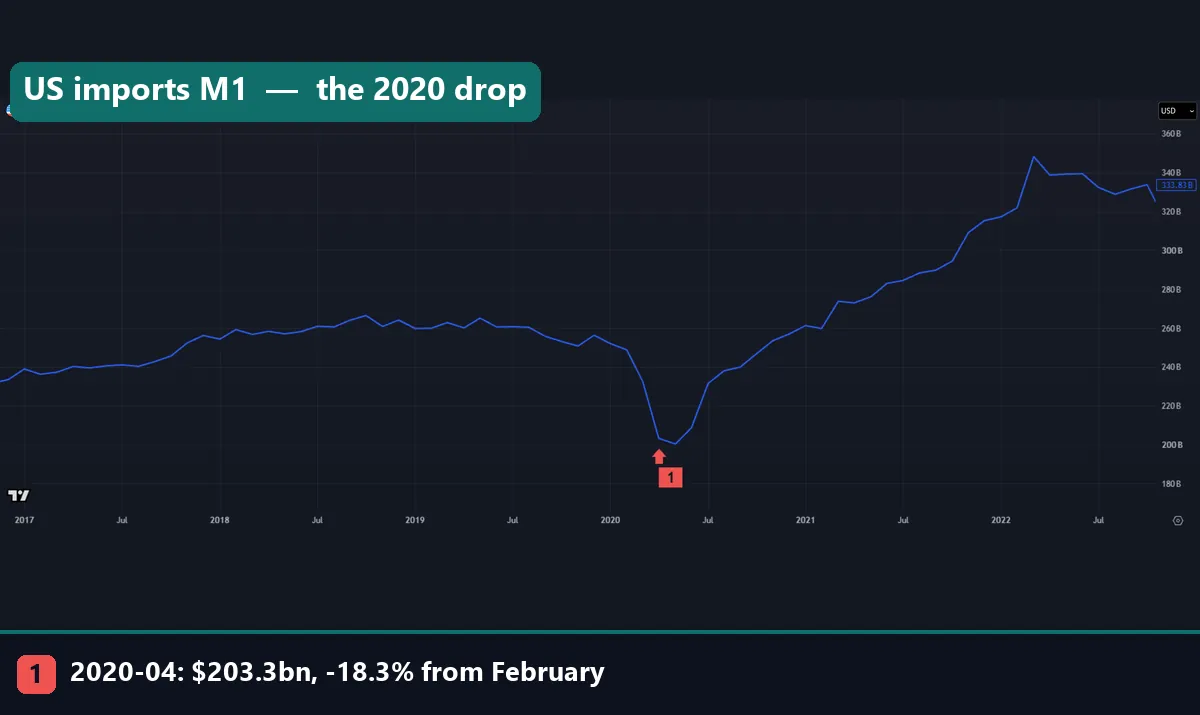
This capture runs from 2017 to October 2022. Marker 1 is April 2020, at $203.3bn on this series, 18.3% under February’s $248.8bn. The line bottoms one bar later, at $200.4bn in May, so April was not the low. As revised, the official table gives $246.9bn, $203.5bn and $200.9bn for the same three months, a 17.6% fall to April. Imports then climbed to $348.2bn on this series by March 2022.
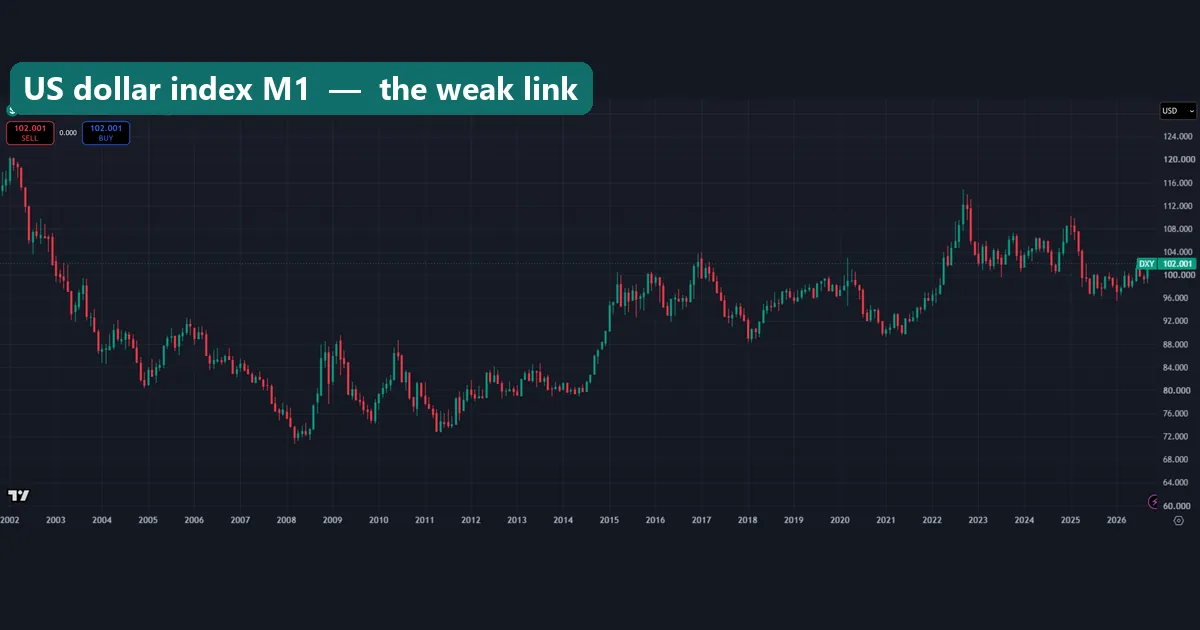
The dollar index tells a different story over the same years. It shows a high near 120.5 in January 2002, a low near 70.7 in March 2008 and a high near 114.8 in September 2022. Imports rose while the dollar fell into 2008, and they kept rising through most of its climb to 2022. That fits the weak -0.14 reading. The top row shows the live quote from capture day. For how traders use the index, see our guide to the dollar index in forex.
Four common mistakes with import data
Mistake 1: reading a deficit as a loss. A deficit means the US bought more from abroad than it sold abroad that month. It is a gap between two flows, not a profit-and-loss line.
Mistake 2: quoting the chart as the official figure. TradingView’s import line shows $419.4bn for March 2025, while the official table says $416.4bn. Check the release before you quote a level.
Mistake 3: mixing goods with the total. In September 2026 the goods deficit was $135.9bn and the total was $105.0bn. Both are correct, and each answers a different question.
Mistake 4: treating a big month as a currency signal. One month can swing 15.7%, as April 2025 did, yet the 12-month link to the dollar index is only -0.14. Our page on buy the rumor, sell the news shows why a release and the price move often part ways.
Where to go next
To see when the next trade release lands, use our economic calendar with the guide on how to read an economic calendar. For the wider picture, the business cycle and economic indicators guide places trade among the other monthly releases. Then the guide on how GDP affects forex covers the national accounts.
If you trade EUR/USD, read is the euro stronger than the dollar. Our guide to news spikes covers what price can do in the minutes after a release. Finally, fundamental vs technical analysis helps you decide how much weight data like this deserves.
FAQ about US imports
What are imports in simple terms?
Goods and services bought from sellers in other countries. In US data, that means goods arriving through customs plus services such as travel.
What is the difference between imports and exports?
Exports run the other way, from US sellers to buyers abroad. In September 2026 exports came to $321.5bn and imports to $426.6bn.
What is a trade deficit?
A trade deficit means imports are larger than exports. The US deficit was $105.0bn in September 2026, and the record is $133.0bn, in March 2025.
When did the US last have a trade surplus?
In 1975, at $12.4bn, on the official annual table. The official monthly table, which starts in 1992, has no surplus month. The TradingView series shows one in April 1982, but the official totals do not support it.
Do tariffs show up in the import figures?
Not directly. The release values imports before duty, freight and insurance, so the duty paid stays out. Timing can still show, as the swings of early 2025 did.
When does the import data come out?
Once a month, in a joint Census Bureau and BEA release. September’s data came out on 4 November 2026, and the next release is due on 8 December 2026.
Do rising imports weaken the dollar?
Not reliably, on our data. The 12-month changes in imports and the dollar index correlate at -0.14 over 656 months, which is a weak link.
Can you trade the import number?
Our data shows a late, revised and loosely linked figure, not a reliable signal. Treat it as context, and size any trade around the release with care. Nothing here is advice, and results are not guaranteed; past performance is not indicative of future results.
Last updated: 6 November 2026.

About the author
Written by Dominic Walsh, a Forex trader and MT4/MT5 indicator, Expert Advisor and script developer. Every tool on forexmt4systems.com is tested on live charts before release and ships with ready-to-use compiled MT4 (.ex4) and MT5 (.ex5) files. Learn more about the trader and developer behind this site.
How we build, test and correct every tool: Editorial & Testing Policy. Trading carries risk; see the disclaimer.