
Buy on the rumor sell on the news is a market saying with a simple claim: prices rise while people expect good news, then fall once it arrives. This article settles how far that claim holds. We tested 49 Fed decisions on six dollar pairs and found no reliable effect. We also checked five famous crypto events, and the saying fits some of them and misses the rest. So the honest headline is selection bias: people remember the times it worked.
What buy on the rumor sell on the news actually means
The saying describes a two-step trade. First, you buy while a good event is only expected. Then you sell when the event is confirmed, because the people who wanted in have already bought. So a good headline can arrive and the price can still fall.
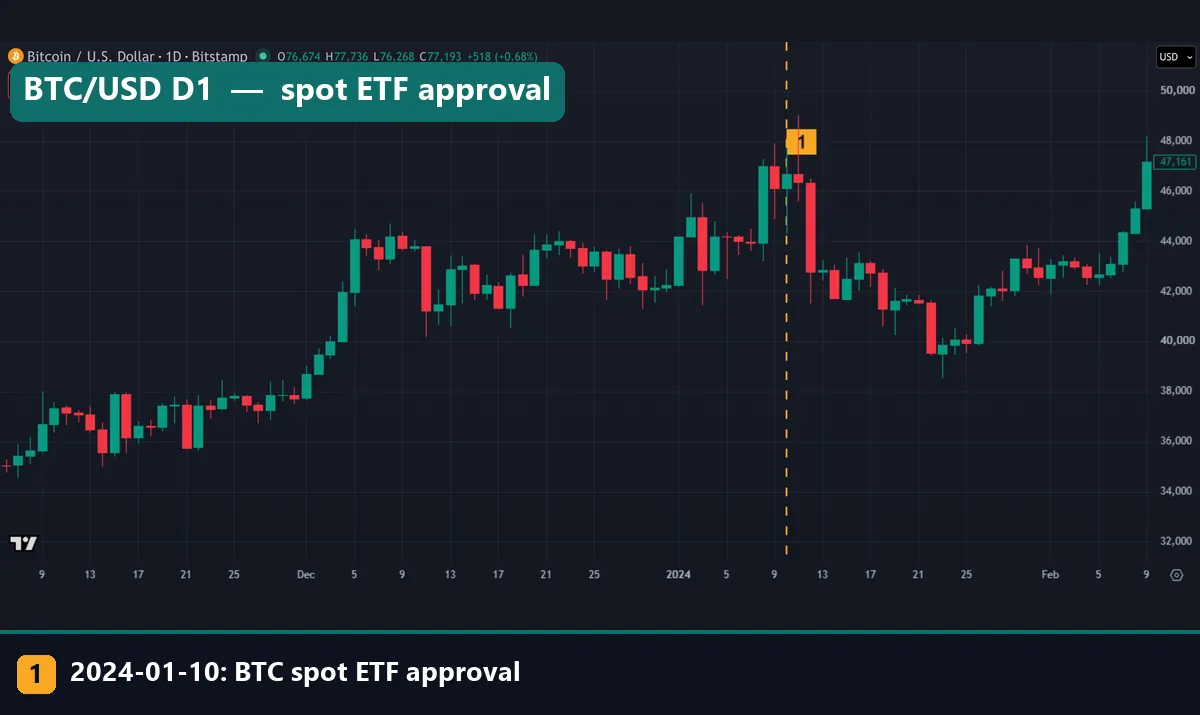
It also runs in reverse: sell ahead of feared news, then buy back once it lands. The chart above shows a famous case. Bitcoin climbed into the spot ETF decision of January 2024, then dropped within days.
The line is old, but its history is thin. Trading guides tell conflicting origin stories, and we found no source that proves a single author. So treat it as folklore that deserves a test.
How the idea is supposed to work
The mechanism rests on one idea: a price moves on surprise, not on news alone.
surprise = what happened - what the market already expected
If everyone expects a rate rise and the rise arrives, the surprise is close to zero. The buying has already happened, so little fresh demand remains. Meanwhile, early buyers hold gains they may want to take. That selling can push the price down on a “good” day.
However, two things must hold before this is any use. First, the run-up must come from the expected event and not from something else. Second, the fall must come often enough to tell apart from chance. Our test looks at the second point, because the first is much harder to prove. For the wider topic, read our guide on using news to trade forex and our page on sentiment versus fundamentals.
Rumor, forecast or calendar date?
Most “rumors” in this debate are not rumors at all. The Federal Reserve’s FOMC calendar lists the meetings and links each statement, so the market can prepare for weeks. Our FOMC meeting guide explains the day itself, and our Fed dot plot guide covers the projections that come with some meetings.
Bitcoin halvings are even less of a secret, because the reward halves at a fixed block interval. The supply table on the Bitcoin Wiki, a community reference, lists block 420,000 on 9 July 2016, block 630,000 on 11 May 2020 and block 840,000 on 20 April 2024. So “rumor” is a poor word for them.
Our other two events had a real decision or a technical step behind them. The SEC order in the Federal Register at GovInfo is dated 10 January 2024, and it approves listing bitcoin-based trust shares. Similarly, the Merge page on ethereum.org gives 15 September 2022. We confirmed those dates from those pages. But we cannot confirm what the crowd believed beforehand, because no chart records that.
How we tested
We ran two checks, and they are not equal. The first is a fixed rule on MetaTrader 4, build 1471, using Capital Point Trading’s history. It uses daily bars for EUR/USD, GBP/USD, AUD/USD, USD/JPY, USD/CHF and USD/CAD. These pairs start in May 2020 on this terminal, so the test covers 49 Fed decisions from 29 July 2020 to 29 July 2026. The terminal has been offline since late August 2026, so the window ends there.
The second check is an illustration, not a test. We measured five hand-picked crypto events on the TradingView web chart, using BITSTAMP:BTCUSD and BITSTAMP:ETHUSD daily bars pulled on 3 November 2026. We chose them because people talk about them, and that is their weakness. This is not a case for or against holding crypto.
Every result comes before spread, swap, financing, commission and dividends. Our editorial testing policy explains how we report these measurements.
The settings behind the Fed test
The rule is fixed, so you can repeat it on your own data.
| Setting | Our choice | Why |
|---|---|---|
| Symbols | Six USD pairs | Direction is measured for the dollar |
| Timeframe | D1 | Daily closes only |
| Event days | 49 Fed decision days | The true sample is the meetings |
| Control | Other Wednesdays | Fed decisions usually fall on a Wednesday |
| Run | 5 trading days before the day | A stand-in for “the rumor” |
| Big run | 1 ATR or more | Where the saying should be strongest |
| Against the run | The day, or the next 5 days, moved the opposite way | The “sell the news” outcome |
As a formula: run = (close[day-1] - close[day-6]) / ATR(14). A reversal counts when the move has the opposite sign to the run. We divide by ATR so that quiet and lively pairs compare fairly. Our guide to what ATR measures explains that unit.
Reading an event on a chart
Start with the event line. Did the price rise into it, and did it fall after it? Then look further out, because the answer often changes with distance. One warning: the quote row at the top of each capture shows the price on capture day, not the bars in view, so ignore it.
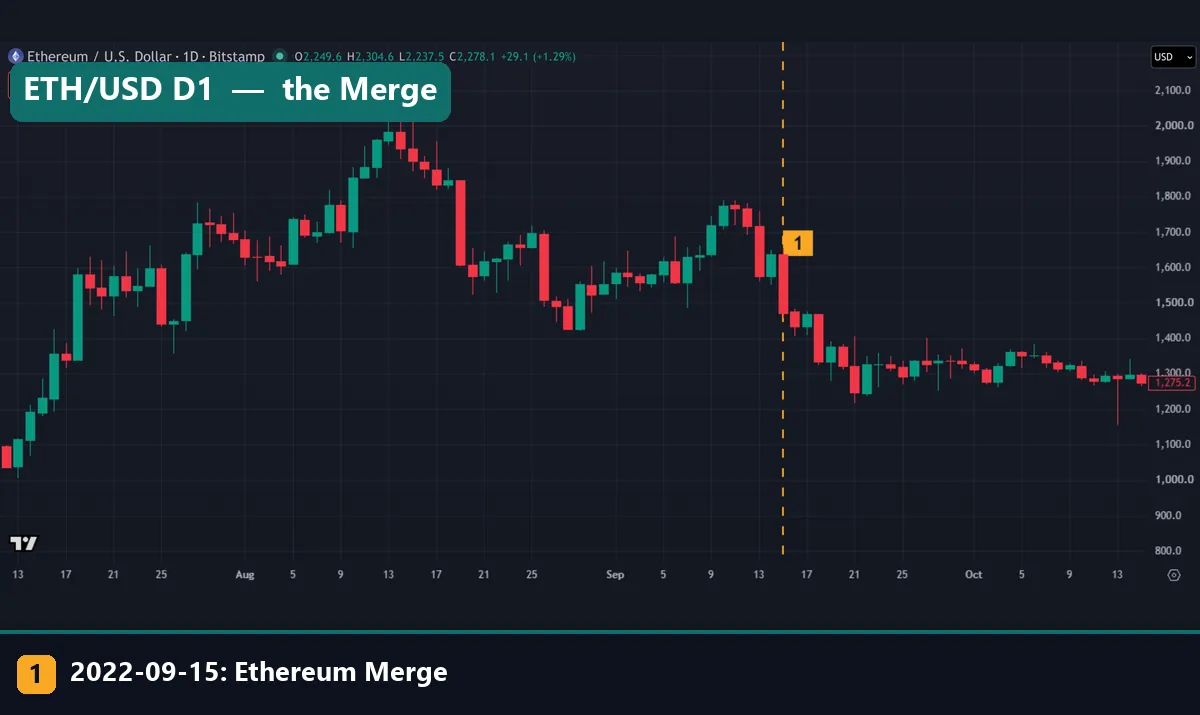
The Ethereum chart looks like the saying at first glance. The bar of 15 September 2022 fell 10.1% and closed at 1,472.6. However, look left of the line. The highest close before the event came a month earlier, on 13 August, at 1,984.3. So the event close sat 25.8% below that peak, and anyone waiting to “sell the news” had missed much of the fall.
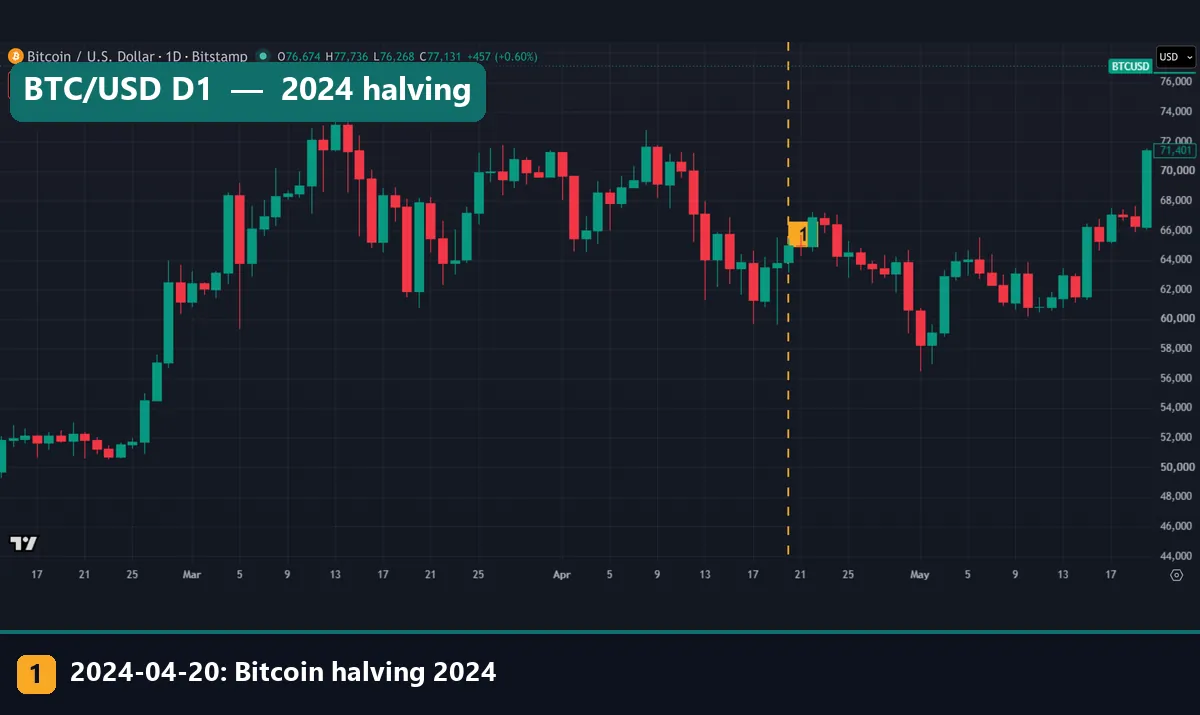
The 2024 halving chart tells a quieter story. Bitcoin’s highest close came on 13 March at 73,121, more than a month before the line. The close on 20 April was 64,990, which is 11.1% below that high. After that, it was 0.8% lower at 5 days, 6.5% lower at 20 days and flat at 60 days. That is the trouble with reading these charts by eye: the story depends on where you stop looking.
Worked example: the Bitcoin ETF approval
This case fits the saying at first, then stops fitting it. The numbers use the first chart in this article. The Bitstamp daily bar closed at 46,681 on 10 January 2024.
- 60 days before: the close was 37,152, so the run-up was +25.6%.
- 20 days before: the run-up was +6.4%, so the rise was still going.
- 5 days after: 42,493, or -9.0%.
- Lowest close in the next 20 days: 39,528 on 22 January, or -15.3%.
- 20 days after: 42,946, or -8.0%.
- 60 days after: 69,026, or +47.9%.
So the saying looks right for three weeks and wrong over two months. Someone who sold at that close and stayed out avoided a 15.3% drop, then saw the price stand 47.9% higher. Neither outcome says what to do next time. It only shows that your window decides the verdict.
The Fed test: 49 meetings and no reliable effect
Now the fairer test, because nobody hand-picked these days. Every scheduled Fed decision in the window is in, whatever happened next.
| Dollar move against its 5-day run | Fed days | Other Wednesdays |
|---|---|---|
| The day | 49.7% | 50.2% |
| The next 5 days | 54.1% | 48.1% |
| Big runs: the day | 51.6% | 50.4% |
| Big runs: the next 5 days | 48.4% | 49.6% |
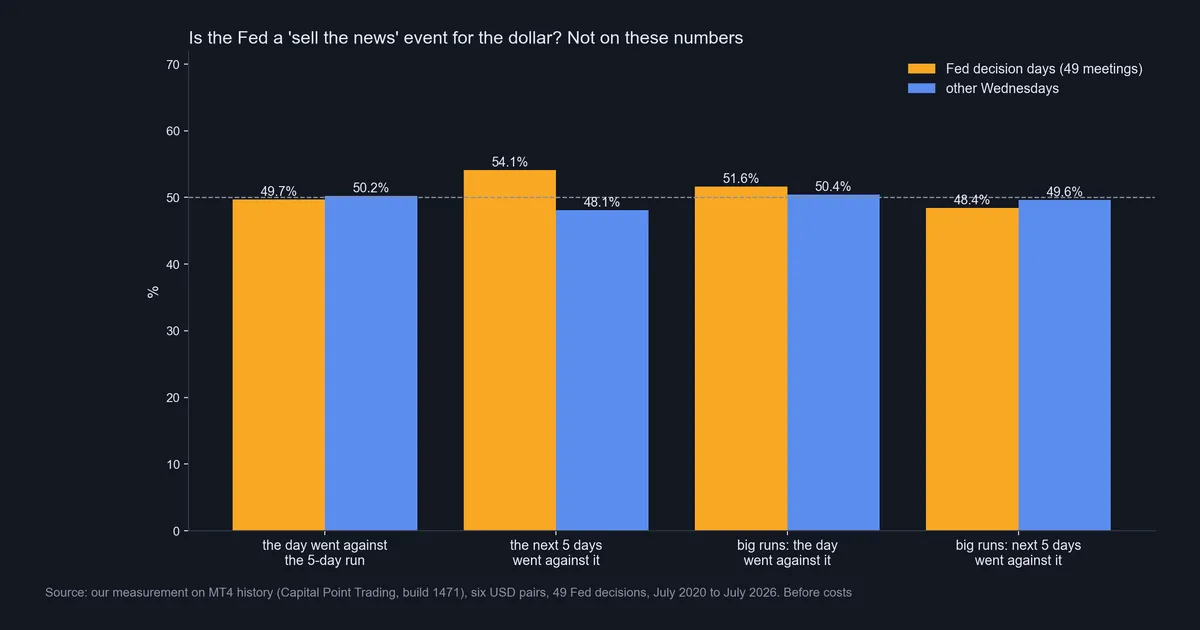
On the day itself there is nothing: 49.7% against 50.2%, which is a coin flip. The one gap worth a look is 54.1% against 48.1% over the next 5 days. But that gap vanishes where the saying should be strongest. After big runs, the figure drops to 48.4%, below the control’s 49.6%. The sizes agree too: the median big-run Fed day moved 0.08 ATR against the run, and the next 5 days moved 0.03 ATR with it.
Sample size matters here. We count 294 pair-days, but six dollar pairs move together on the same meeting, so the true sample is 49. At that size, one standard error is about 7 percentage points: sqrt(0.5 x 0.5 / 49) = 0.071. So a 6-point gap sits inside the noise. Our note on backtest sample size covers why small counts mislead.
Five famous crypto events, side by side
Each figure is measured from the close on the event day. Crypto trades every day, so these are calendar days.
| Event | 60 days before | 5 days after | 20 days after | 60 days after |
|---|---|---|---|---|
| BTC spot ETF approval, 10 January 2024 | +25.6% | -9.0% | -8.0% | +47.9% |
| Ethereum Merge, 15 September 2022 | +10.0% | -10.1% | -8.2% | -15.7% |
| Bitcoin halving, 9 July 2016 | +43.4% | +1.7% | +1.1% | -5.0% |
| Bitcoin halving, 11 May 2020 | +77.0% | +9.5% | +10.2% | +8.3% |
| Bitcoin halving, 20 April 2024 | +24.3% | -0.8% | -6.5% | -0.1% |
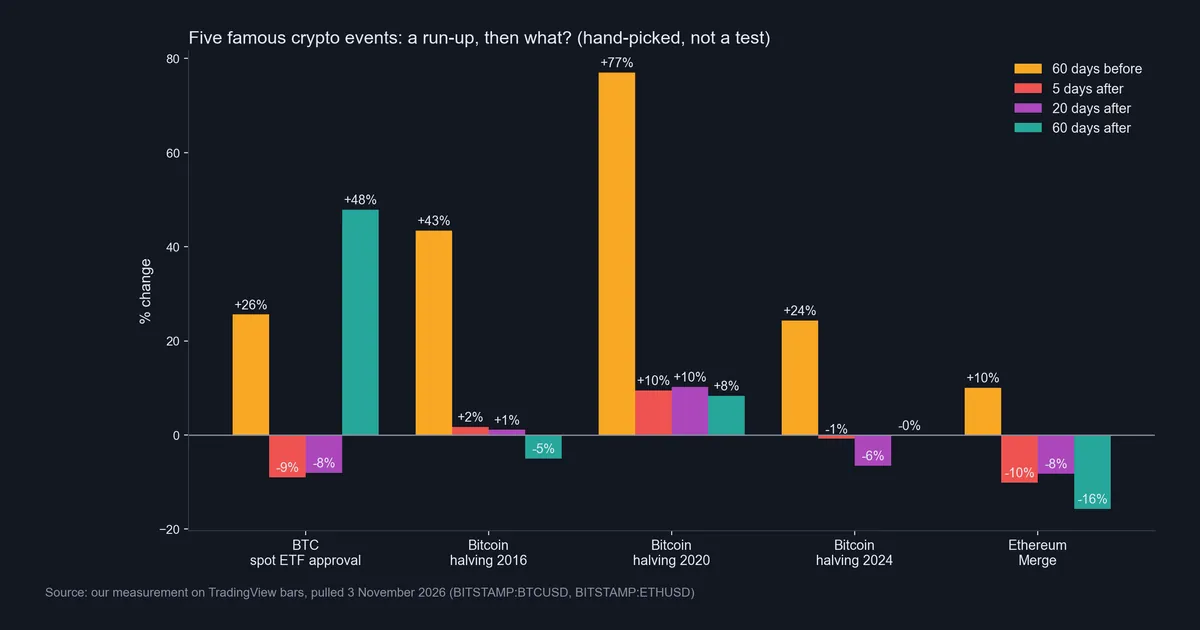
All five rose over the prior 60 days, which looks like a pattern. Yet we have no control group here, so that proves little. Then the picture splits. Three events were lower after 5 and 20 days, while the 2016 and 2020 halvings were higher. So the saying fits two or three of them and misses the others.
Three of the five were also lower than 20 days earlier when the event came: -14.9% in 2016, -8.8% in 2024 and -2.4% for the Merge. In those cases the buying had stopped before the news.
Download the complete indicator database
Put these concepts on your charts. One email unlocks the full library of 1,380+ indicators with compiled MT4 and MT5 files, plus my TradingView scripts. No paywall, no spam, unsubscribe any time.
Get free access to my indicator database
One email unlocks 1,380+ free MT4, MT5 and TradingView indicators — the complete library. No single-tool download; you get the whole database.
Where it fails
Selection bias. This is the main flaw. The ETF drop and the Merge drop get retold because the story is neat. The 2020 halving makes a worse story, since it stood 9.5%, 10.2% and 8.3% higher after 5, 20 and 60 days. Our five events share the flaw, because we picked them for being famous. Our page on confirmation bias in trading covers the habit behind it.
A run is not a rumor. We used a 5-day price move as a stand-in for expectation. But a run can have other causes, and an expectation can build with no run at all. So the Fed test measures price around the meeting, not what traders believed.
It says nothing about timing. The rise can end weeks early, as the Merge and 2024 halving charts show. No rule tells you when the news is fully priced.
Our test is narrow. It covers six dollar pairs, daily closes and one data feed. Moves inside the announcement can look very different, and our guide to the forex news spike deals with those. We did not test stocks or earnings reports. So “no effect on the dollar under these rules” does not mean “no effect anywhere”.
Two Fed days that went opposite ways
These two charts use the OANDA feed on the TradingView web chart, not the MT4 test data. Both meetings carried new projections, yet the outcomes were opposite. That is why one remembered case proves so little.
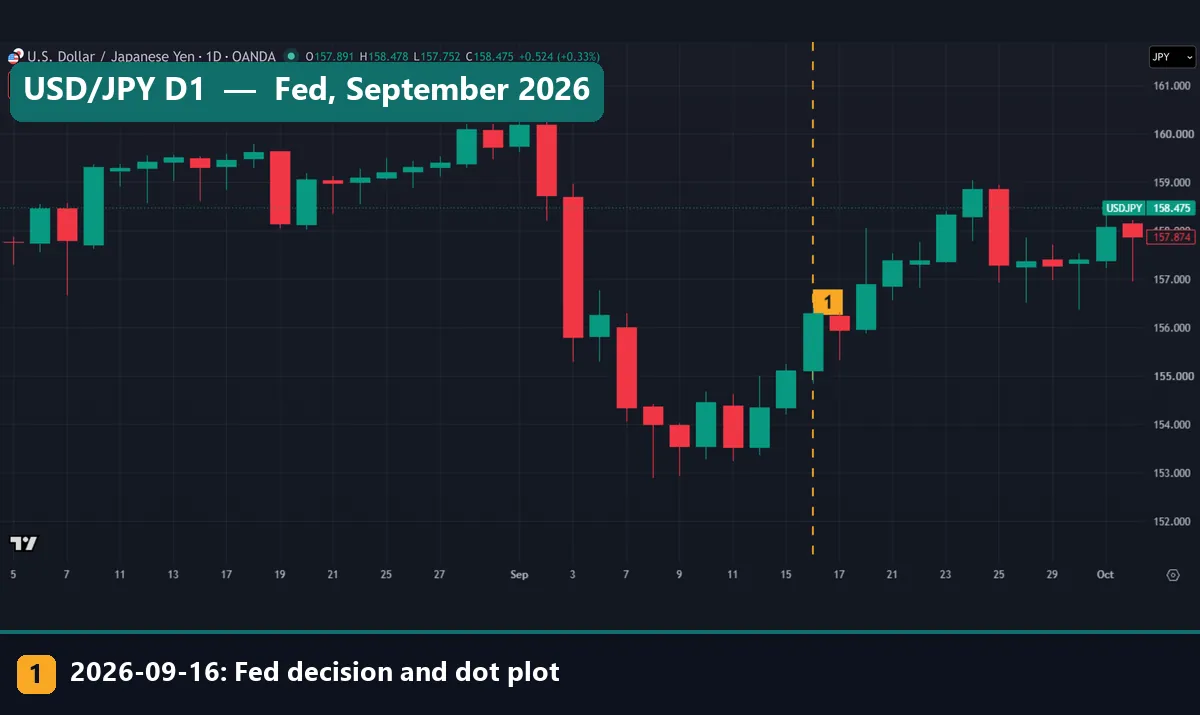
On 16 September 2026 the Fed raised its target range by a quarter point to 3.75% to 4.00%. USD/JPY closed at 154.000 on 8 September and 155.118 on 15 September, so the dollar’s run was up. It then closed at 156.304 on the day and 158.340 five trading days later. So the dollar kept rising through the news, the opposite of the saying. This meeting falls after our test window.
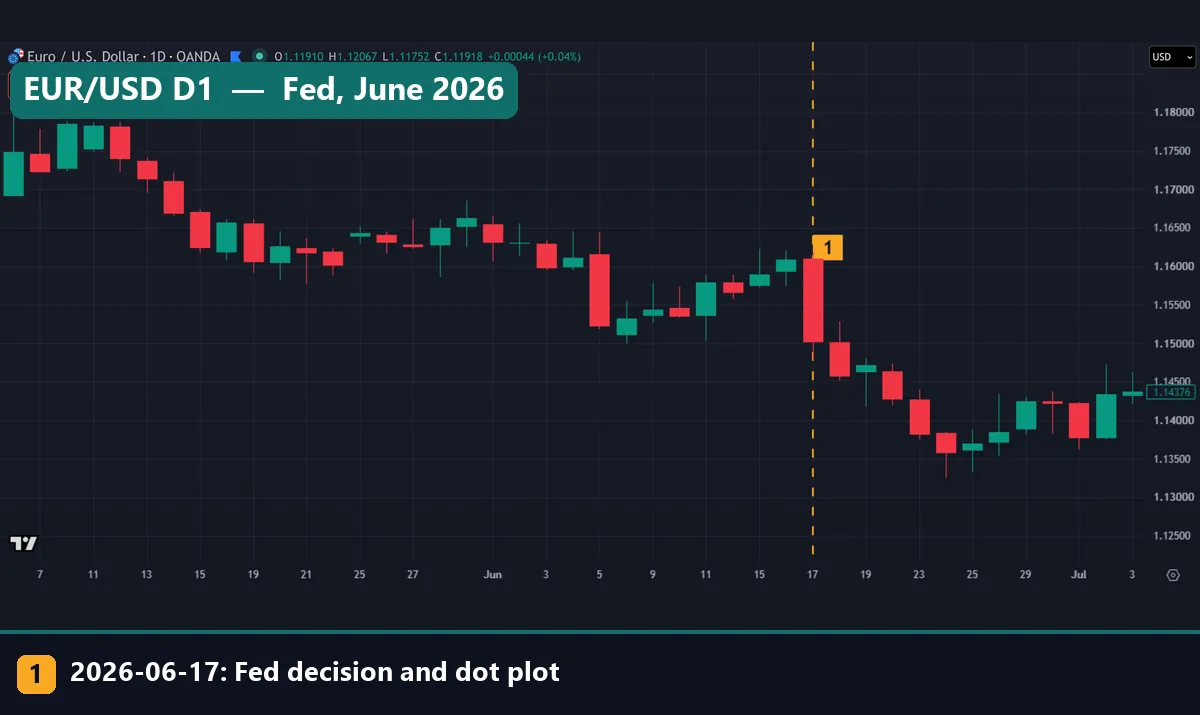
On 17 June 2026 the Fed held its range at 3.50% to 3.75%. EUR/USD closed at 1.15440 on 9 June and 1.16085 on 16 June, so the dollar’s run was down. It then closed at 1.15020 on the day and 1.13586 five trading days later. Here both moves went against the run. We make no claim about what caused either move.
Common mistakes
- Treating a good story as a test. One remembered chart is not a sample. Count the failures as well, and compare them with ordinary days.
- Reading a good headline as a sell signal. On our Fed days, the day went against the run just 49.7% of the time.
- Choosing the window after seeing the chart. The ETF approval was -8.0% at 20 days and +47.9% at 60. So fix your window before the event.
- Carrying too much size through the event. Our guide to position sizing shows how to limit the loss before you enter.
Where to go next
If you want to test the saying yourself, start with the dates. Our economic calendar shows what is coming, and our guide to central bank rate decisions explains those days. Then read whipsaw in trading on sharp two-way moves. Our primary sources sit in the calendar section above.
FAQ: buy the rumor, sell the news
Does buy on the rumor sell on the news work?
On our dollar test it shows no reliable effect. Across 49 Fed decisions, the day went against the prior run 49.7% of the time, against 50.2% on other Wednesdays. It fits some famous crypto events, but those were hand-picked.
What does “sell the news” mean?
It means selling when an expected event is confirmed, because the buying may already be done. It is a market saying, not a measured law.
Is there a sell the news effect on Fed days?
Not on our numbers. The next 5 days went against the run 54.1% of the time, against 48.1% on other Wednesdays. But after big runs that became 48.4% against 49.6%.
Did Bitcoin fall after the spot ETF approval?
Yes, at first. It stood 9.0% lower after 5 days and 8.0% lower after 20 days. However, it was 47.9% higher after 60 days.
Do Bitcoin halvings fit the saying?
Not consistently. After 5 days, the 2016 halving was up 1.7%, the 2020 halving up 9.5% and the 2024 halving down 0.8%.
Why do so many traders believe it?
Because the hits are memorable and the misses are not. That is selection bias, and it can make a saying feel truer than it tests.
Who first said buy the rumor, sell the news?
We could not find out. Trading guides give conflicting origin stories, so treat any named originator with care.
Should I trade around this saying?
We do not tell readers what to trade. If you test it, fix the event list, the window and a control before you look, and count costs, because results are not guaranteed; past performance is not indicative of future results.
Last updated: 3 November 2026.

About the author
Written by Dominic Walsh, a Forex trader and MT4/MT5 indicator, Expert Advisor and script developer. Every tool on forexmt4systems.com is tested on live charts before release and ships with ready-to-use compiled MT4 (.ex4) and MT5 (.ex5) files. Learn more about the trader and developer behind this site.
How we build, test and correct every tool: Editorial & Testing Policy. Trading carries risk; see the disclaimer.