
Confluence trading means taking a trade only when several signals agree on the same bar. This guide settles one question: does that agreement make a signal better, or does it just feel safer? We tested four common long triggers on 23 forex pairs, on daily bars from 2018 to 2026. Two or more agreeing triggers closed higher ten days later 56.7% of the time. But the best single trigger also scored 56.7%, and all days together scored 52.3%. So agreement added almost nothing, because the four triggers mostly measure the same thing.
What confluence trading means
Confluence means a meeting point. In trading, it means two or more reasons to act that line up at one place and time. For example, a trader may want a support level, an oversold oscillator and a bullish candle on the same bar. Each factor is a vote, and the trade needs a majority. Our guide on how to combine indicators covers the mechanics.
The logic only holds if the signals fail at different times. Two signals that read the same price data tend to be right together and wrong together. Then the second vote is an echo, not a second opinion. Statisticians call this multicollinearity. The multicollinearity lesson at StockCharts ChartSchool quotes John Bollinger, who calls it “the multiple counting of the same information”.
How confluence works, and why similar signals overlap
Our four triggers are typical of what traders stack. Here is the math behind each one, plus the score we used to count agreement:
RSI(14)     = 100 - 100 / (1 + RS), RS = average gain / average loss over 14 bars
Lower band  = SMA(close, 20) - 2 x standard deviation(close, 20)
20-day low  = low at or below the lowest low of the prior 20 bars
Engulfing   = a down bar, then an up bar whose body covers it

score  = number of triggers true on the bar (0 to 4)
signal = score of 2 or more
The RSI formula matches TradingView’s RSI help page, which also gives Wilder’s 70 and 30 levels. Our page on overbought and oversold readings explains the 30 line.
Now look at the inputs. All four triggers use the same bars from the last few weeks. When a pair drops hard, RSI falls under 30, the close slips under the lower band and the low sets a new 20-day low, all within a few bars. So a “three-signal” bar often records one event: price fell fast and then bounced.
Rule 4 of John Bollinger’s own Bollinger Band rules says the same: two momentum indicators are not better than one. Our guide to oscillators in trading sorts the common tools by what they measure.
How we tested confluence on 23 pairs
We used MetaTrader 4 history from Capital Point Trading, build 1471, read straight from the terminal’s history files. The sample covers 23 pairs on D1, from 12 June 2018 to 24 August 2026, and start dates differ a little by pair. The pairs: AUDCAD, AUDCHF, AUDJPY, AUDNZD, AUDUSD, CADCHF, CADJPY, CHFJPY, EURAUD, EURGBP, EURUSD, GBPAUD, GBPCAD, GBPCHF, GBPJPY, GBPNZD, GBPUSD, NZDCAD, NZDCHF, NZDJPY, USDCAD, USDCHF and USDJPY.
We tested the long side only. On each bar we checked the four triggers, plus one context check: was the close above the 200-day SMA? The outcome was simple. Did the close ten bars later sit higher than the signal close? As a baseline, 52.3% of all days closed higher ten bars on. We also logged the median ten-day move in units of the 14-day ATR, which our page on ATR in trading explains.
This is a direction count with no stops or targets. Every result comes before spread, swap and commission. Our note on backtesting transaction costs shows why that matters for small edges.
The charts are our own captures on the TradingView web chart, with OANDA daily data, taken on 23 October 2026 and marked with the same rules. Our editorial testing policy sets out how we collect and report data.
Confluence settings: the four triggers and the filter
These are the exact settings we used. The last column shows what kind of information each one reads.
| Trigger | Indicator and setting | Fires when | Information it reads |
|---|---|---|---|
| RSI back above 30 | RSI, period 14, close | RSI sat under 30 on the prior bar and is at or above 30 now | Momentum of closes |
| Back inside lower band | Bollinger Bands, 20 periods, 2 deviations, close | The prior close sat under the lower band and this close is back inside | Closes against their 20-bar spread |
| 20-day low | Lowest low of the prior 20 bars | This bar’s low is at or below that level | Price level |
| Bullish engulfing | Two-bar candle pattern | A down bar, then an up bar whose body covers it | Bar shape |
| Uptrend filter | SMA, 200 periods, close | The close is above the 200-day SMA | Long-term trend |
Notice that the first four rows all read the same few weeks of bars. Only the trend filter looks further back, and even it uses closes. On MT4 and MT5, the band settings map to the period and deviation inputs listed in the iBands entry in the MQL5 reference. Our pages on the engulfing candle and on Bollinger Bands cover the other two pieces.
Reading confluence on a chart
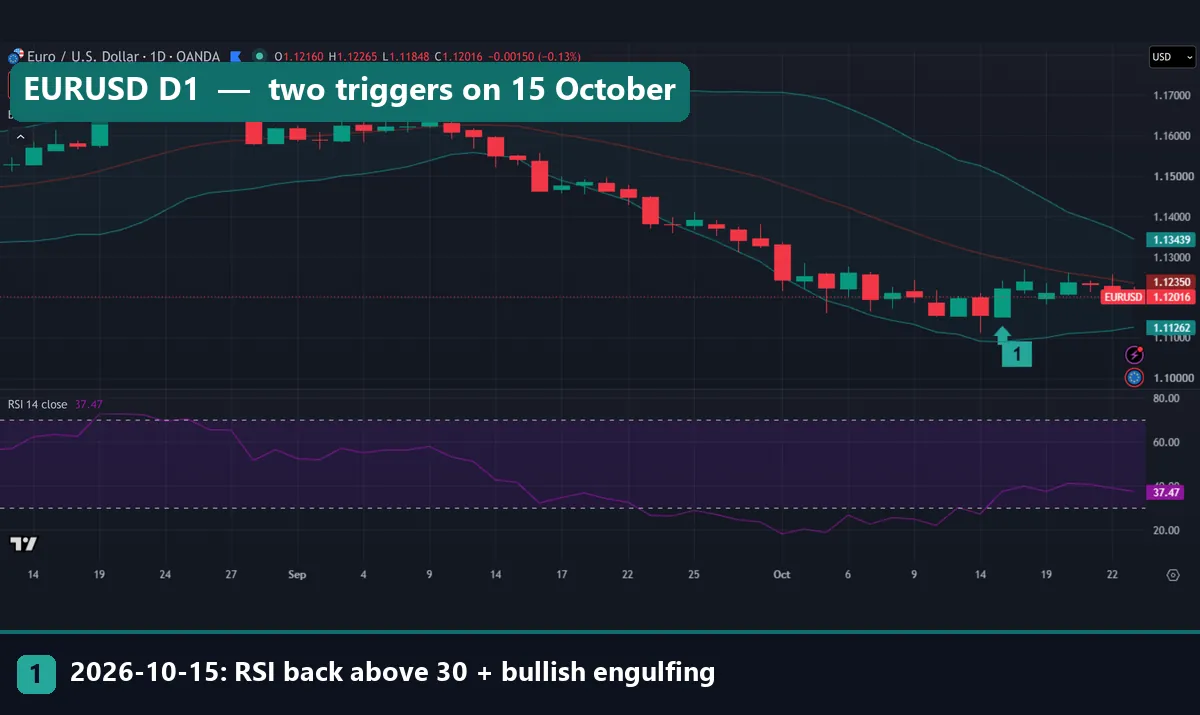
Our charts show price with Bollinger Bands (20, 2) on top and RSI(14) below. The red line is the middle band, and the teal lines are the outer bands. In the RSI pane, the dashed lines sit at 70 and 30. A green marker sits under each bar where two or more triggers fired, and the legend names them.
Read it in three steps. First, find the bar where RSI crosses back above 30. Next, check that bar on the price pane: is the close back inside the lower band, is the low a 20-bar low, is it an engulfing bar? Then count, and ask what each trigger measured.
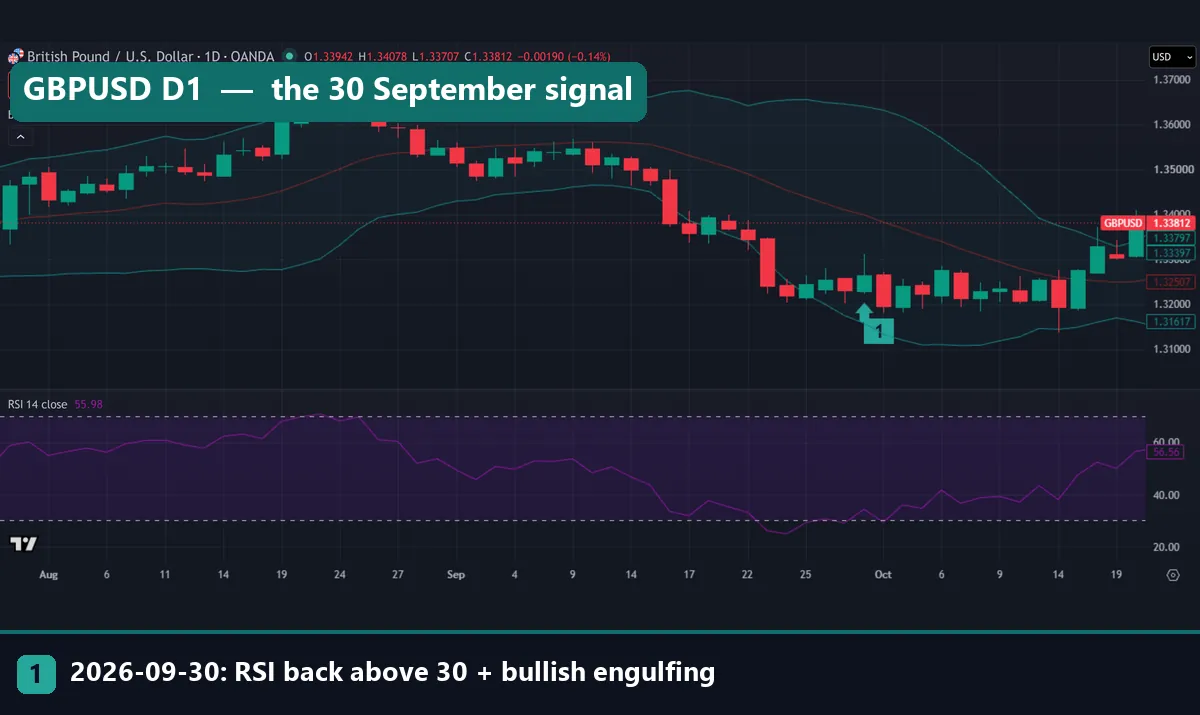
On GBPUSD, the marked bar is 30 September 2026, with RSI back above 30 and a bullish engulfing bar. Yet the next bar was a long red candle that closed below the signal bar’s low. Price then went sideways for two weeks before it rose above the middle band.
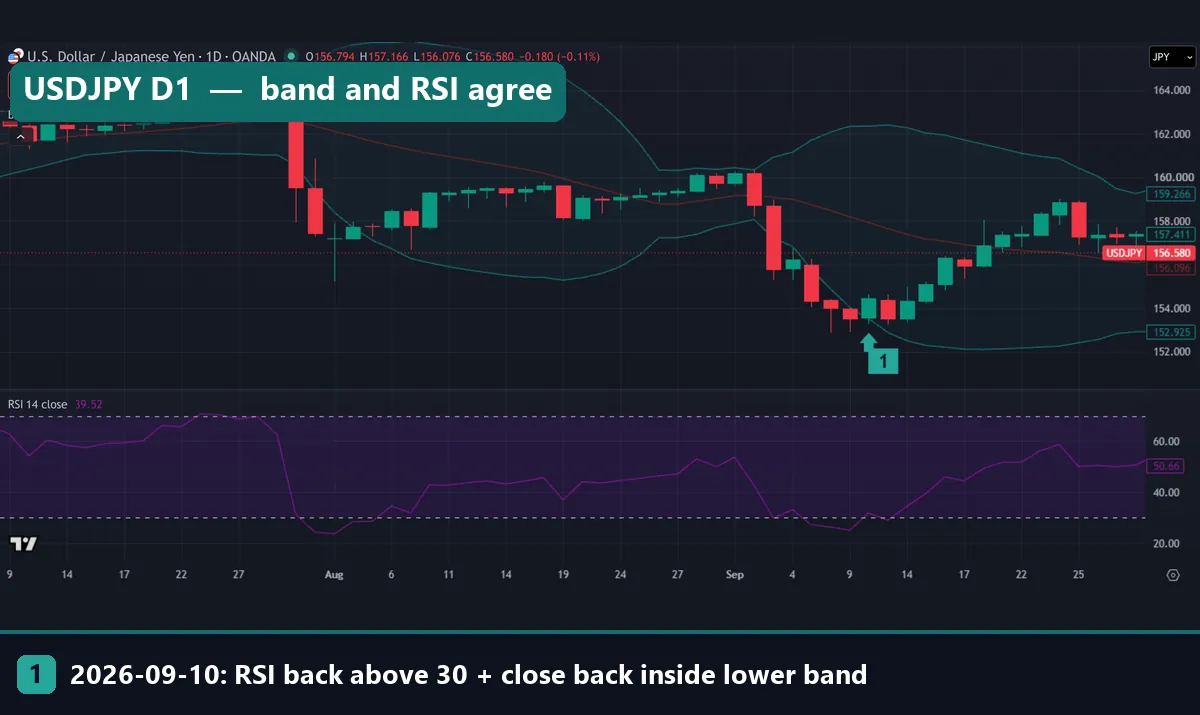
USDJPY tells a different story. On 10 September, the close came back inside the lower band as RSI crossed back above 30. Ten trading days later, the close sat above 158.000 on the price axis. For more on this pairing, see how to trade Bollinger Bands with RSI.
Worked example: three pairs in autumn 2026
The marked bars are not the only confluence signals on these charts. Our marks list, built with the same rules, records each signal’s close. Here are three clusters, with the earlier signals left unmarked.
- EURUSD. A close back inside the lower band plus engulfing fired on 25 September at 1.13911. Then RSI back above 30 plus engulfing fired on 13 October at 1.11988, about 192 pips lower. The same pair fired again on 15 October at 1.12212, which is marker 1 on the first chart. On 23 October EURUSD traded at 1.12016, so that ten-day result is still open.
- GBPUSD. Three triggers agreed on 18 September (back inside the band, a 20-bar low and engulfing), with a close of 1.33947. Five trading days later, a two-trigger signal closed at 1.32455, about 149 pips lower. The marked 30 September signal closed at 1.32636. Ten trading days on, the close was near 1.32000, below it.
- USDJPY. RSI back above 30 plus a 20-bar low fired on 4 September at 156.254. Four trading days later, the marked signal closed at 154.457, about 180 pips lower. That second signal did close higher ten days on.
So in all three pairs, the first agreeing signal came too early. Price kept falling, and the triggers fired again lower down. That is what you would expect when every trigger describes “price fell fast”. They agree most when a fall is strong, and a strong fall often has further to go.
Still, six charts prove nothing on their own, because a few examples can be picked to tell either story. The numbers that matter come from the 23-pair test.
Confluence trading results: single signals vs signals that agree
| Signal (long, D1) | Signals | Higher 10 days later | Median move (ATR) |
|---|---|---|---|
| RSI back above 30 | 366 | 53.8% | 0.14 |
| Bullish engulfing | 3,115 | 53.2% | 0.14 |
| Back inside lower band | 951 | 56.7% | 0.22 |
| 20-day low | 3,704 | 55.6% | 0.26 |
| 2+ agree | 872 | 56.7% | 0.27 |
| 3+ agree | 181 | 55.8% | 0.16 |
| 4 agree | 19 | 68.4% | 0.37 |
| 2+ agree with uptrend | 265 | 53.6% | 0.15 |
| 3+ agree with uptrend | 41 | 56.1% | 0.21 |
| All days (base) | – | 52.3% | – |
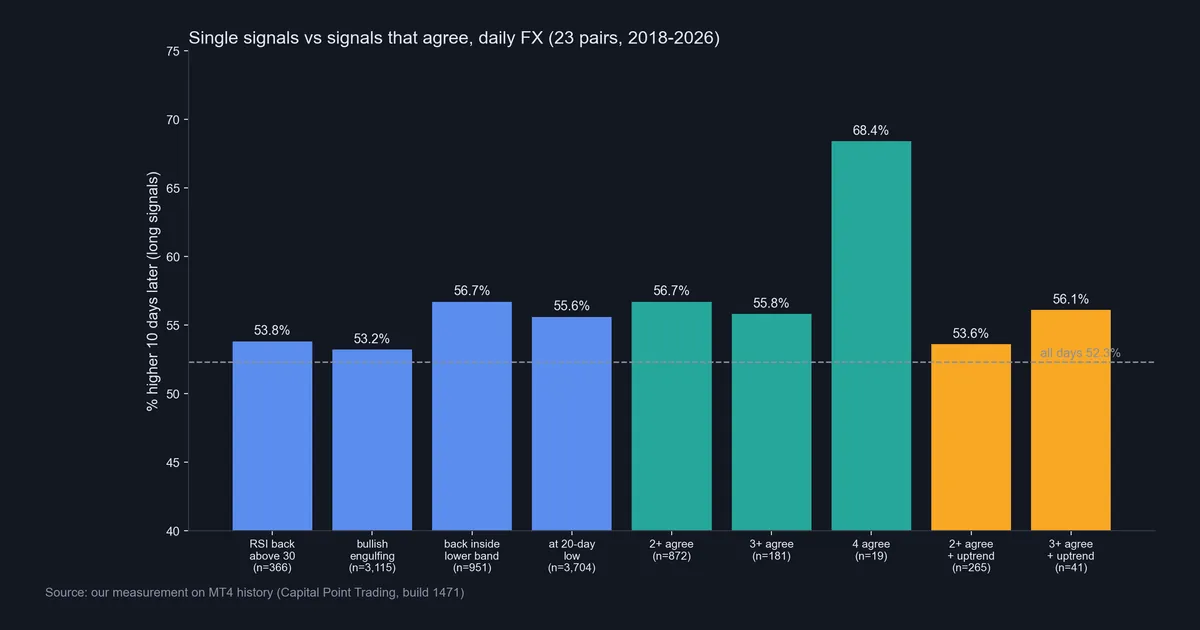
Every signal beat the 52.3% base, but only by a few points. Two or more agreeing triggers reached 56.7% over 872 signals, the same as “back inside the lower band” alone. Three or more did slightly worse, at 55.8%. Four agreeing reached 68.4%, but on only 19 signals: 13 closed higher and 6 did not. Two fewer up closes would cut it to 57.9%. Our guide to backtest sample size explains why a count this small proves little.
The trend filter surprised us. Adding “close above the 200-day SMA” to two or more agreeing triggers cut the score to 53.6% over 265 signals. The median move also fell, from 0.27 to 0.15 ATR. So in this sample, oversold signals inside an uptrend did worse, not better.
Three triggers, still lower: gold in June
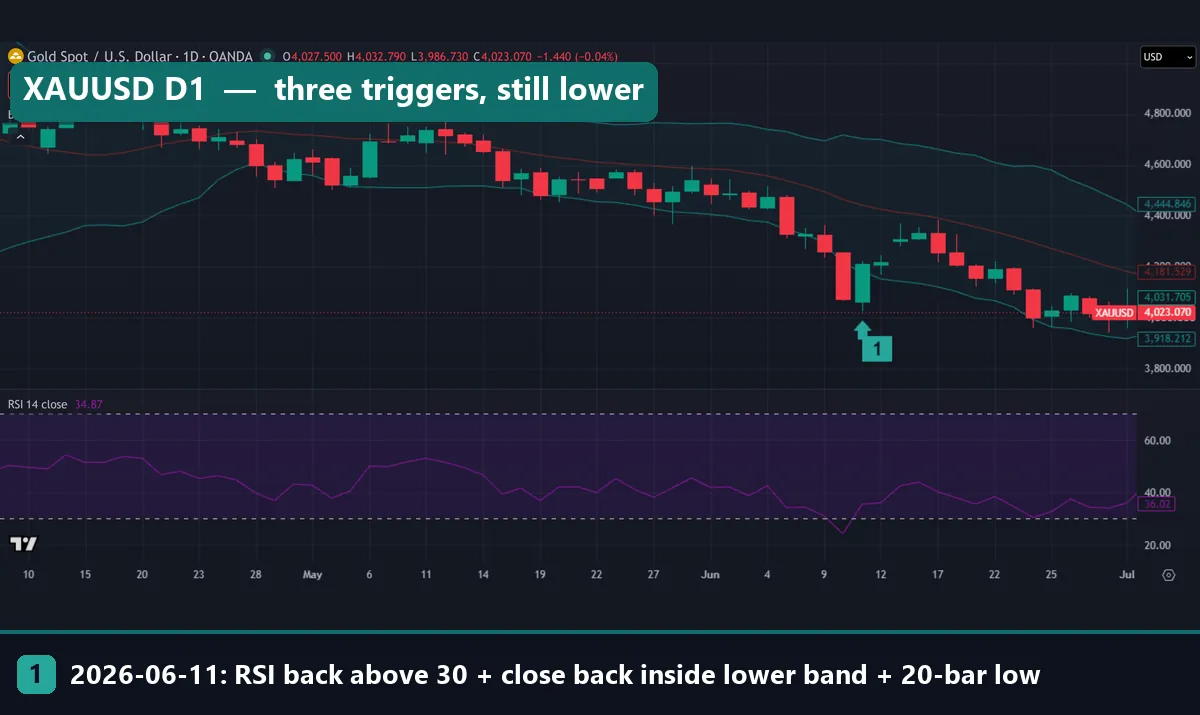
Gold shows why agreement is not a safety net. It sits outside our 23-pair test, but the chart uses the same rules. On 11 June 2026, three triggers agreed: RSI back above 30, a close back inside the lower band and a 20-bar low. The bar closed at 4,211.195. Price bounced for a few days, then fell, and within about two weeks it traded below the signal bar’s low. The marks list shows two earlier signals in the same fall, on 20 May at 4,543.705 and on 8 June at 4,330.065.
Download the complete indicator database
Put these concepts on your charts. One email unlocks the full library of 1,380+ indicators with compiled MT4 and MT5 files, plus my TradingView scripts. No paywall, no spam, unsubscribe any time.
Get free access to my indicator database
One email unlocks 1,380+ free MT4, MT5 and TradingView indicators — the complete library. No single-tool download; you get the whole database.
Where it fails: the limits of confluence trading
- Similar signals echo each other. Stacking triggers built from the same bars added nothing over the best single trigger: 56.7% either way.
- Oversold agreement keeps firing in a fall. The EURUSD, GBPUSD, USDJPY and gold clusters all fired early, then fired again lower.
- High counts mean tiny samples. At four triggers, we had 19 signals in about eight years.
- The edge is thin. A few points above a 52.3% base, before spread, swap and commission, can vanish once costs come in.
- The sample is smaller than it looks. Signals bunch up on nearby days and on related pairs, such as EURUSD and GBPUSD in one dollar move. So 872 signals hold fewer than 872 independent tests.
- A ten-day count is blunt. It ignores how far price went against you on the way, which is what a stop loss would see.
Bollinger’s rule 8 also warns that a close outside the bands starts out as a continuation signal, not a reversal. That fits what we saw: the first signals in a fall often came before the fall had finished.
Two charts where agreement fell short
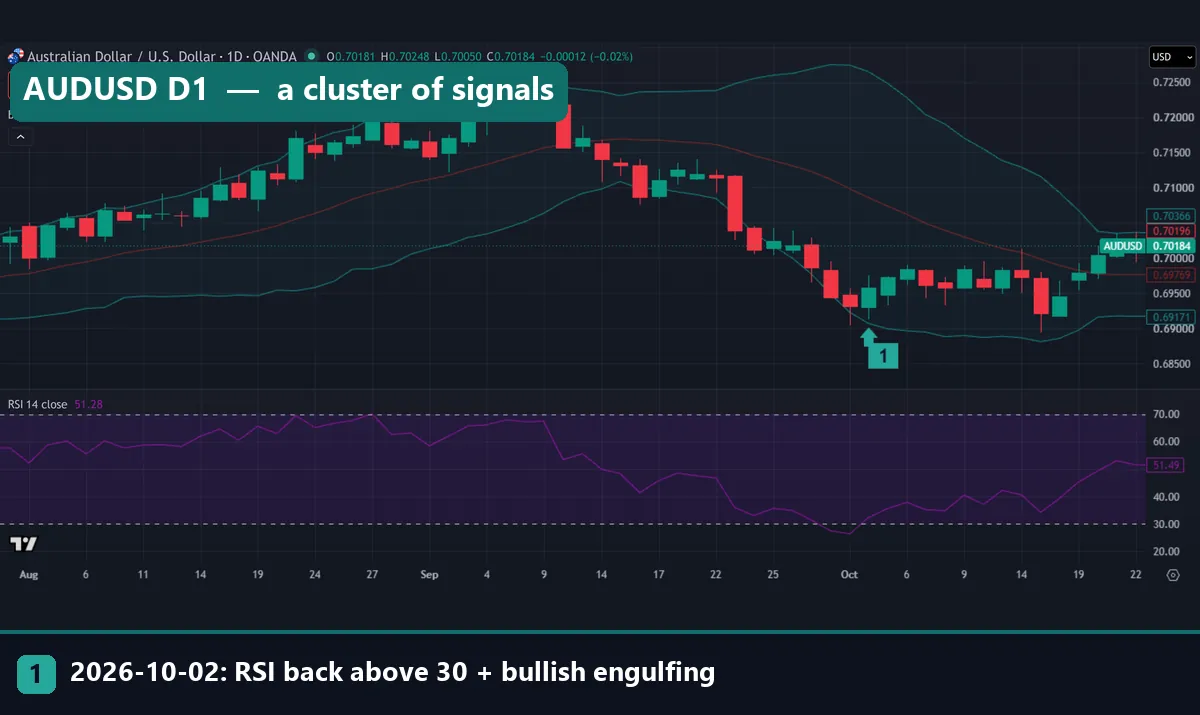
AUDUSD shows the cluster problem again. A close back inside the lower band plus a 20-bar low fired on 25 September at 0.70244, then again on 1 October at 0.69311, about 93 pips lower. The next day, the marked signal closed at 0.69574. Price went sideways for two weeks, and ten trading days on, the close sat a little below the signal close. Yet a few days later, price climbed above the middle band. The ten-day yardstick cuts both ways.
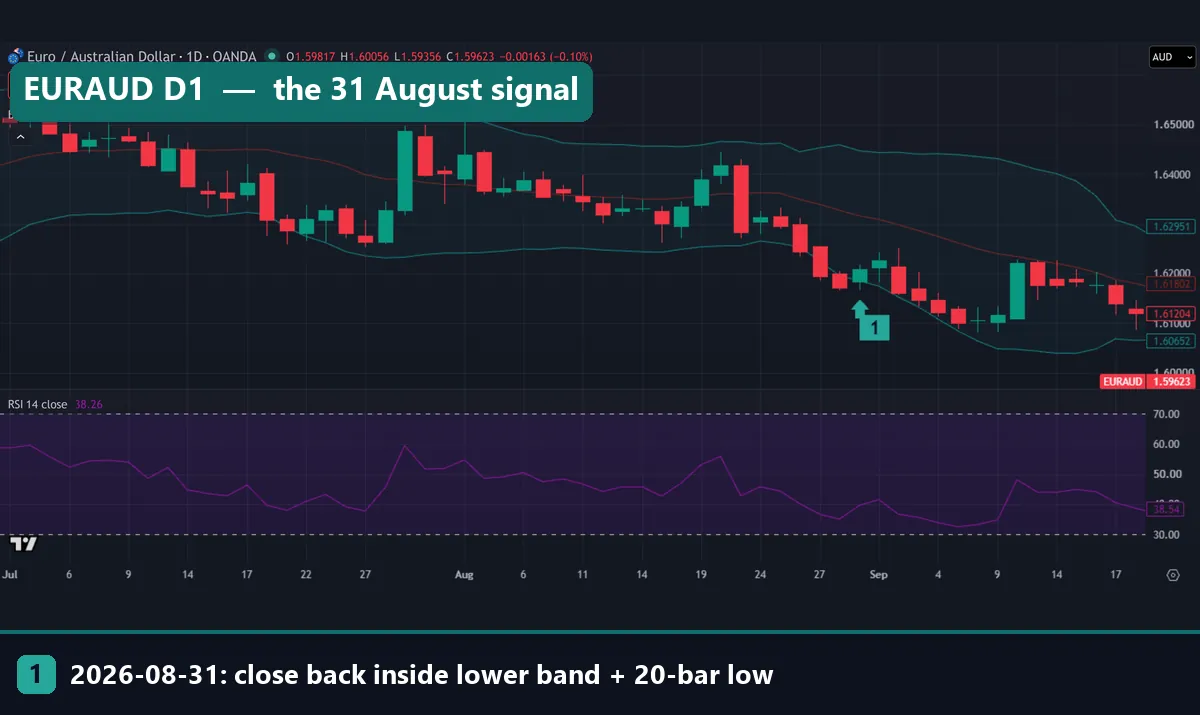
EURAUD is the plainest failure in our set. On 31 August, the close came back inside the lower band at a 20-bar low, at 1.62094. Within a week, price traded near the 1.61000 line. Ten trading days on, the close was still below the signal close. In our MT4 data, the pair’s daily correlation with AUDUSD is -0.70, so it moves mostly on the Australian dollar. No trigger on this chart reads that.
Better confluence: mix different kinds of information
If similar signals echo, the fix is to combine signals that read different things. Bollinger’s rules name momentum, volume, sentiment and inter-market data as sources. Spot forex has no central volume, so the practical choices look like this:
- Time frame: a daily trigger checked against the weekly trend, as our guide to multi-timeframe analysis shows.
- Volatility: whether ATR or band width is rising or falling when the trigger fires.
- Events: whether a rate decision falls inside your holding period.
- Related markets: for a cross like EURAUD, what AUDUSD is doing.
One honest warning, though. Our 200-day SMA filter added a different kind of information, and it still made the score worse. So a filter from a different family is a better bet than a fourth oscillator, but it has to earn its place in a test. Different information is the minimum, not proof.
Four common confluence mistakes
- Counting the same thing twice. RSI, Stochastic and CCI on one chart are three views of momentum, not three votes. The same goes for RSI plus a lower-band touch.
- Trusting a small, shiny sample. The 68.4% for four agreeing triggers came from 19 signals. Treat a result with only a few dozen trades as a lead to check, not a finding.
- Adding rules until the past looks perfect. Each extra filter can fit the noise in your sample. Our guide to curve fitting in trading shows how to spot it.
- Looking for reasons after deciding. If you already want the trade, you will find three confluences. Our page on confirmation bias in trading covers this trap, so write your checklist before you open the chart.
Where to go next
- Our moving averages guide explains the 200-day SMA we used as a trend filter.
- Our page on RSI false signals shows where the 30 line misleads on its own.
- Of the four outside sources above, read the StockCharts lesson and Bollinger’s rules 4, 6 and 8 first. The MQL5 and TradingView pages cover the inputs.
FAQ: confluence trading
What is confluence trading in simple terms?
It means acting only when two or more signals point the same way on the same bar or price zone, such as an oversold RSI and a bullish candle at support.
Do more confluences make a trade better?
Not by count alone. In our test on 23 pairs, two or more agreeing triggers closed higher ten days later 56.7% of the time, the same as the best single trigger. What matters is whether each factor adds new information.
Is RSI plus Bollinger Bands real confluence?
Only partly. Both come from the same closes over a similar window, so they tend to fire together. In our test, their agreement added little. Pair one of them with something that reads a different input.
How many confluence factors should I use?
Two or three that measure different things is a sensible start. Each extra condition cuts the number of trades. At four triggers we had only 19 signals in about eight years of daily data.
Does a trend filter improve confluence signals?
Not in our sample. Requiring a close above the 200-day SMA dropped two-or-more signals from 56.7% to 53.6%. Other filters may behave differently, so test any filter before you rely on it.
Can I use confluence on MT4, MT5 and TradingView?
Yes. RSI, Bollinger Bands and moving averages come built into all three, with the same period and deviation inputs. Our test used MT4 daily history, and our charts came from the TradingView web chart.
Why do confluence signals fire several times in a row?
Because the triggers describe a sharp fall. While a fall goes on, RSI keeps dipping under 30 and price keeps pushing through the lower band, so new signals appear lower down. On EURUSD, signals on 25 September and 13 October were about 192 pips apart.
Does confluence trading work?
In our test, every trigger and every combination closed higher a little more often than the 52.3% base, before costs. Yet the extra edge from agreement itself was close to zero. Use confluence to describe a setup clearly, then test it on your own pairs and costs, and remember that results are not guaranteed; past performance is not indicative of future results.
Last updated: 23 October 2026.

About the author
Written by Dominic Walsh, a Forex trader and MT4/MT5 indicator, Expert Advisor and script developer. Every tool on forexmt4systems.com is tested on live charts before release and ships with ready-to-use compiled MT4 (.ex4) and MT5 (.ex5) files. Learn more about the trader and developer behind this site.
How we build, test and correct every tool: Editorial & Testing Policy. Trading carries risk; see the disclaimer.