
Oscillators are indicators that swing between two levels or around a centre line, and traders use them to spot stretched moves. This guide settles one question with data: when RSI, Stochastic, CCI or Williams %R leaves its overbought or oversold zone, does price turn? We tested all four on 23 forex pairs over eight years of daily bars. The answer is: barely. Only RSI leaving overbought beat the all-days figure by more than half a point.
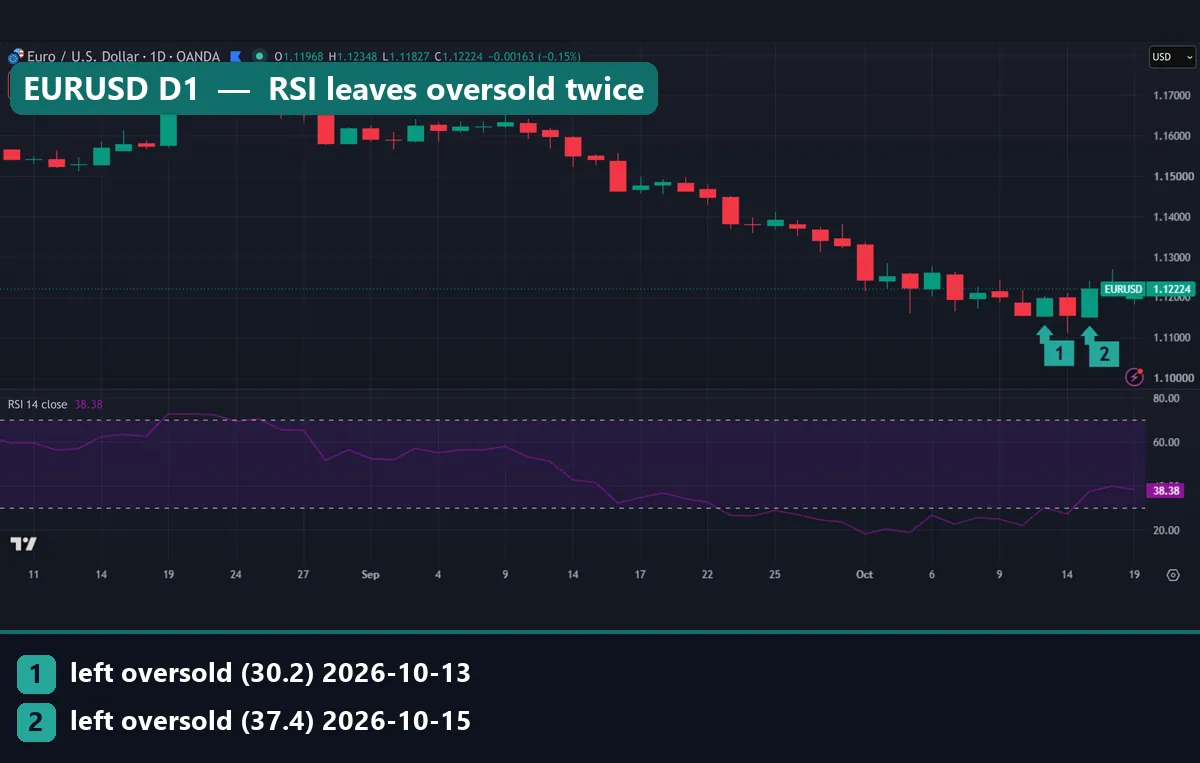
The chart shows RSI(14) on EURUSD daily bars. RSI sat under 30 for almost three weeks while the euro kept sliding. Marker 1 is 13 October 2026, when RSI closed at 30.2 and EURUSD at 1.11988. Then RSI slipped under 30 again on 14 October. So marker 2 is a second exit, on 15 October at 37.4, with EURUSD at 1.12212.
What are oscillators in trading?
An oscillator turns recent price action into a line that moves back and forth. Price can trend for months, but the line keeps returning to the middle. So it works as a gauge of stretch.
Two traits sort them. Bounded oscillators have hard limits: RSI and Stochastic run from 0 to 100, and Williams %R from 0 to -100. Unbounded ones, such as CCI and MACD, have no ceiling. A centred oscillator swings around zero, so its sign shows the direction of momentum. CCI sits in both camps. It swings around zero with no hard limit, yet traders still draw lines at +100 and -100.
Overbought and oversold are just names for the outer zones, as our overbought and oversold explainer shows. A reading above 70 does not mean buyers have run out. It means price rose a lot, fast. Even the MetaTrader 5 help section on oscillators says they suit markets with no clear trend.
How oscillators work: the four formulas
Each of the four compares the latest close with recent history. They differ in which history they use and how they scale it.
RSI comes from J. Welles Wilder’s 1978 book. It compares average gains with average losses over 14 bars: RSI = 100 - 100 / (1 + average gain / average loss). Wilder smoothed both averages, so RSI moves slowly. TradingView’s RSI help page gives his 70 and 30 lines.
Stochastic, from George Lane, asks where the close sits in the 14-bar range: %K = 100 x (close - lowest low) / (highest high - lowest low). The slow version averages %K over 3 bars, and %D averages that line over 3 more. Our slow stochastic guide covers the smoothing.
Williams %R measures the same range from the top: %R = -100 x (highest high - close) / (highest high - lowest low). Do the algebra and %R equals the raw 14-bar %K minus 100. So it works like a stochastic with no smoothing, on a negative scale. Our page on what Williams %R is has more.
CCI came from Donald Lambert in 1980. It measures how far the typical price sits from its 20-bar average: CCI = (TP - SMA of TP) / (0.015 x mean deviation), with TP = (high + low + close) / 3. StockCharts ChartSchool’s CCI page says Lambert chose 0.015 so that 70 to 80 percent of readings would fall between -100 and +100. On our daily forex data, only 58.0% did. For trade rules, see how to use the CCI indicator.
How we tested the four oscillators
We used MetaTrader 4, build 1471, with history from the Capital Point Trading server. Daily bars covered 23 currency pairs from 12 June 2018 to 24 August 2026: AUDCAD, AUDCHF, AUDJPY, AUDNZD, AUDUSD, CADCHF, CADJPY, CHFJPY, EURAUD, EURGBP, EURUSD, GBPAUD, GBPCAD, GBPCHF, GBPJPY, GBPNZD, GBPUSD, NZDCAD, NZDCHF, NZDJPY, USDCAD, USDCHF and USDJPY. Hourly bars covered EURUSD, GBPUSD and USDJPY from 22 December 2025, plus gold (XAUUSD) from 1 July 2025. Each ran to mid or late August 2026.
An exit is the first close back inside the zone after a bar at or beyond the line. After an overbought exit, we checked if the close 10 bars later sat lower. After an oversold exit, we checked if it sat higher. Then we compared each share with the base rate, the same check run on every bar. On daily bars, 52.3% of all closes finished higher 10 days later.
We scored direction only, before spread, swap and commission. The charts come from the TradingView web chart with OANDA data, captured on 19 October 2026, with times in UTC. Our editorial testing policy explains how we report tests.
Oscillator settings we used
We kept the common defaults. One input changes between platforms, though: the price source.
| Oscillator | Inputs | Scale | Overbought line | Oversold line | Price source in our test |
|---|---|---|---|---|---|
| RSI | 14 bars, Wilder smoothing | 0 to 100 | 70 | 30 | Close |
| Stochastic | %K 14, slowing 3, %D 3 | 0 to 100 | 80 | 20 | High, low and close |
| CCI | 20 bars, constant 0.015 | No limit, swings around 0 | +100 | -100 | Typical price (high + low + close) / 3 |
| Williams %R | 14 bars | 0 to -100 | -20 | -80 | High, low and close |
For other RSI lengths, see our guide to the best RSI indicator settings.
Reading oscillators on a chart
Read the line against its two zone lines, and watch the bar where it comes back inside.
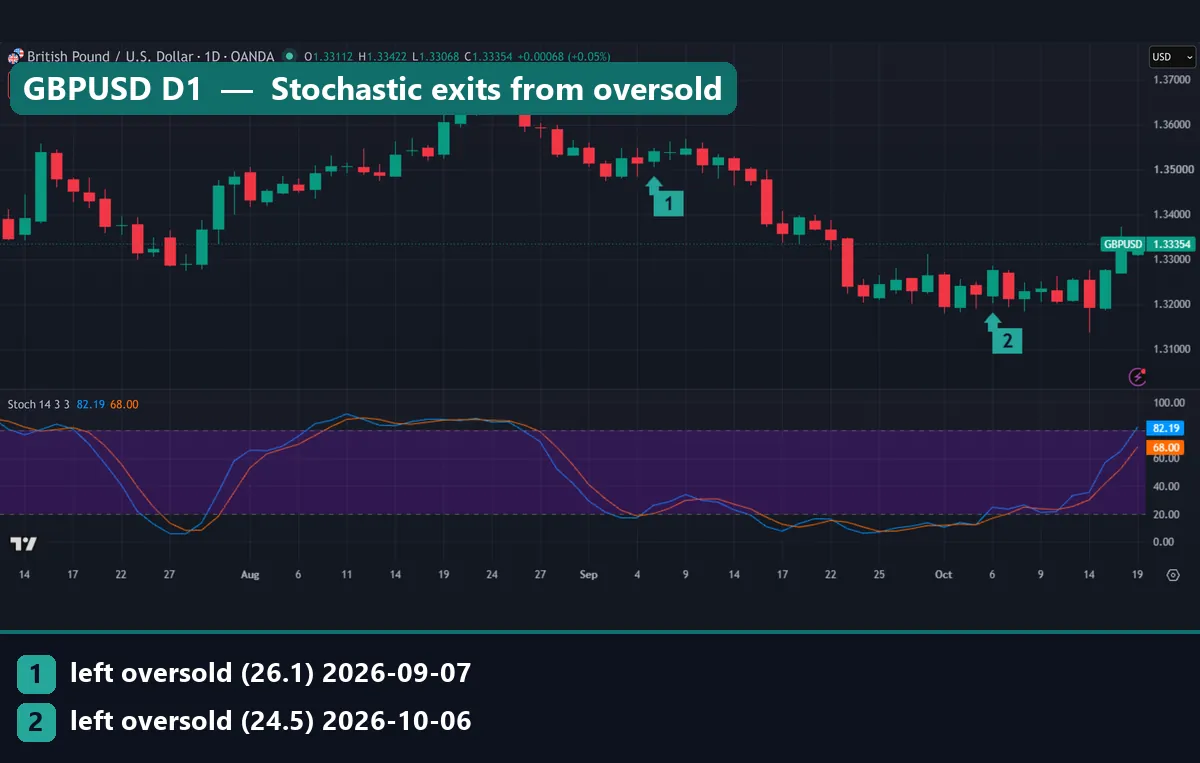
On GBPUSD daily bars, marker 1 is 7 September 2026, when %K climbed back above 20 to 26.1 with GBPUSD at 1.35408. That exit did not mark a low. Within two weeks the pair closed under the 1.34000 line, and %K sank under 20 again for almost three weeks. Marker 2, on 6 October at 24.5 with GBPUSD at 1.32752, came after that slide. Our RSI vs Stochastic comparison explains why the Stochastic reacts this fast.
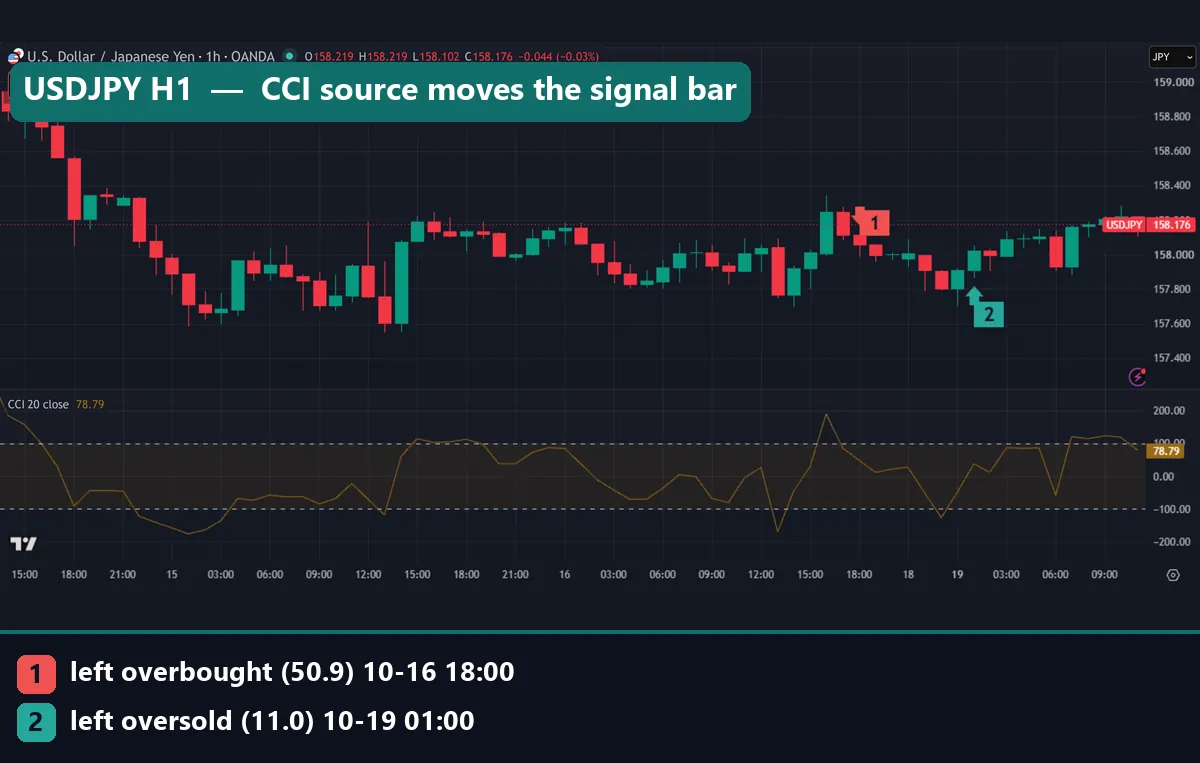
On USDJPY hourly bars, CCI(20) spiked above +100 at 16:00 UTC on 16 October 2026. Marker 1 is the 18:00 bar, where our calculation put CCI back at 50.9. Marker 2, at 01:00 UTC on 19 October, is the exit from below -100, at 11.0. Yet the plotted line crosses back one bar earlier both times. The legend reads “CCI 20 close”, so this chart feeds closes into the formula, while our test used Lambert’s typical price. Same name and length, but a different signal bar.
Worked example: what 53.7% is worth
Now turn the best daily result, RSI leaving overbought, into signals. It fired 492 times across 23 pairs in about eight years, or roughly 21 times per pair.
- Hits: 53.7% of 492 is about 264 lower closes 10 days later.
- Chance: on all days, 47.7% of closes finished lower, and 47.7% of 492 is about 235.
- Edge: about 29 extra correct calls, or under four a year for the whole basket.
- Oversold side: 52.6% of 416 exits is about 219, against about 218 by chance. That gap is one signal.
- Stochastic: 46.4% of 1,514 overbought exits is about 702, against about 722 by chance. So it did worse than no signal at all.
These counts ignore size, too. A small right call and a large wrong one both count as one. So the RSI result is a tilt to study, not a rule to trade. Our mean reversion trading test adds exits and measures profit.
What the zone exits did across 23 pairs
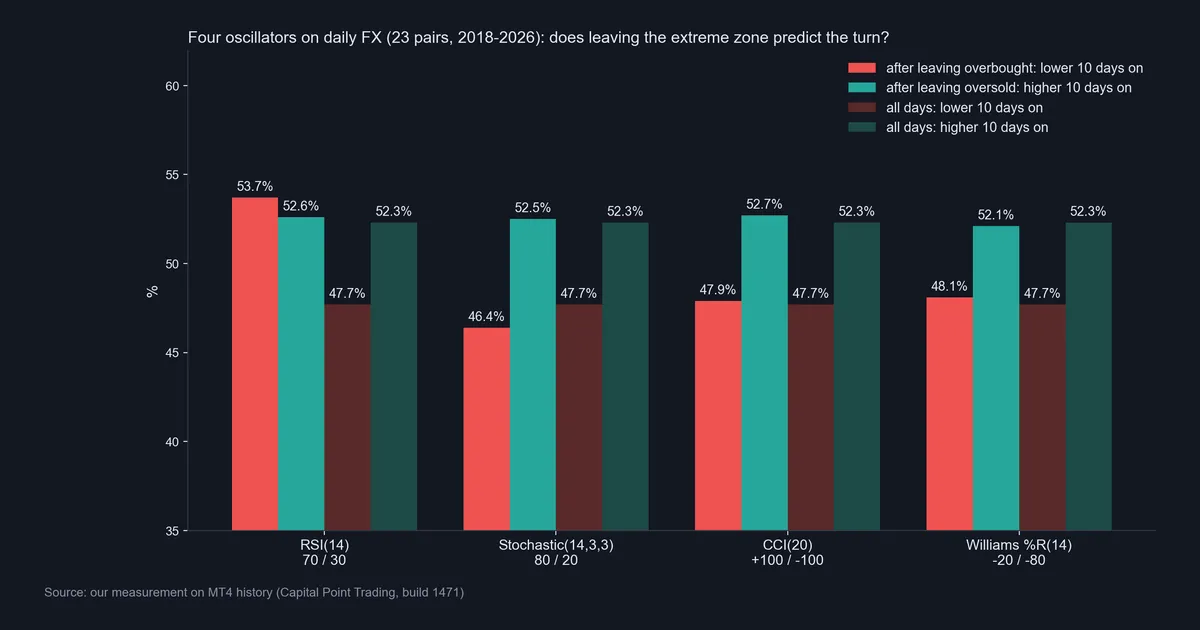
Red bars show how often price closed lower 10 days after an overbought exit. Teal bars show how often it closed higher after an oversold exit, and the dark bars show the same measures for every day. Every oversold exit landed within half a point of the 52.3% base. Among overbought exits, RSI beat its 47.7% base by 6 points, CCI and Williams %R by under half a point, and Stochastic fell 1.3 points short.
| Oscillator | Bars in overbought zone | Bars in oversold zone | Overbought exits | Lower 10 days later | Oversold exits | Higher 10 days later |
|---|---|---|---|---|---|---|
| RSI(14) | 4.4% | 3.3% | 492 | 53.7% | 416 | 52.6% |
| Stochastic(14,3,3) | 22.1% | 17.0% | 1,514 | 46.4% | 1,319 | 52.5% |
| CCI(20) | 22.5% | 19.5% | 1,870 | 47.9% | 1,679 | 52.7% |
| Williams %R(14) | 24.3% | 19.3% | 2,709 | 48.1% | 2,439 | 52.1% |
| All days (base rate) | n/a | n/a | n/a | 47.7% | n/a | 52.3% |
Williams %R: the busiest of the four
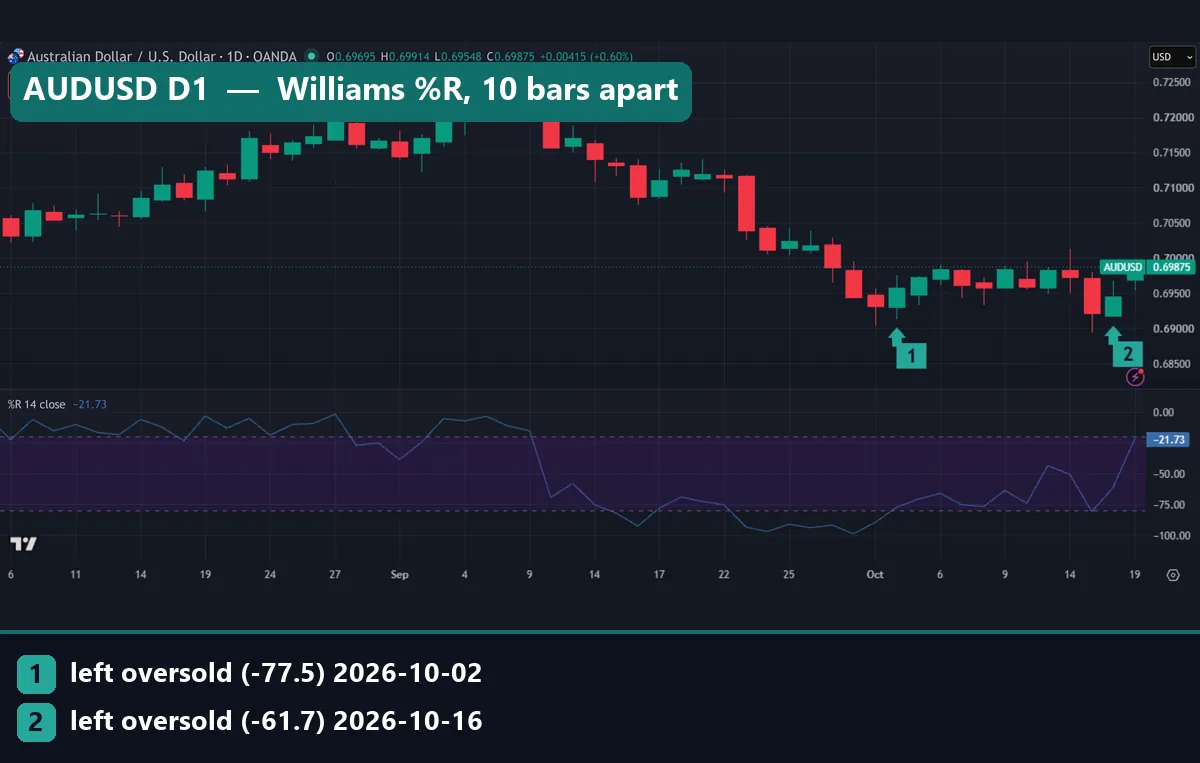
Williams %R gave the most signals: 2,709 overbought exits and 2,439 oversold exits. With no smoothing, it crosses its lines far more often than the slow Stochastic.
On AUDUSD, %R hugged the -80 line from mid-September while the pair slid from about 0.71 to under 0.70. Marker 1 is the exit on 2 October 2026, at -77.5 with AUDUSD at 0.69574. Marker 2 sits exactly 10 bars later, on 16 October, so it also scores marker 1. AUDUSD closed at 0.69460 that day, 11.4 pips lower, which makes it a miss by our rule. Yet one bar later, when we took the shot, it stood at 0.69875.
Download the complete indicator database
Put these concepts on your charts. One email unlocks the full library of 1,380+ indicators with compiled MT4 and MT5 files, plus my TradingView scripts. No paywall, no spam, unsubscribe any time.
Get free access to my indicator database
One email unlocks 1,380+ free MT4, MT5 and TradingView indicators — the complete library. No single-tool download; you get the whole database.
Where it fails: the limits of oscillators
Trends. A strong move pins an oscillator to one end. Our three daily charts show RSI under 30, Stochastic under 20 and %R near -80 for close to three weeks while price kept falling. The zone said the move was strong, but never that it had ended. Our page on trend following trading covers the other side.
Fixed lines. Overbought means different things for each tool. On daily forex, the Stochastic sat above 80 on 22.1% of bars, but RSI sat at 70 or higher on only 4.4%.
Inputs. Platforms differ on defaults, as the CCI chart showed, so a signal can move by a bar.
Size and costs. We scored direction only. A small tilt can vanish after spread, swap and commission, or when losers run larger than winners.
Sample. Related pairs often move together, so many signals overlap and the true sample runs smaller than the count.
Two oscillators agreeing is one signal twice
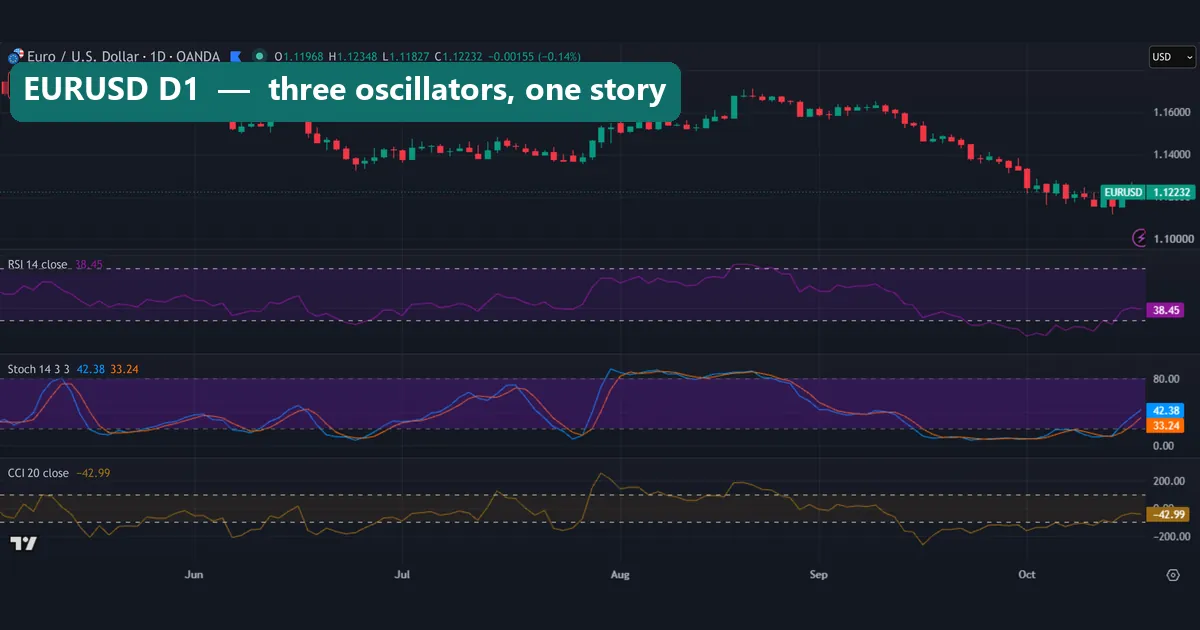
This EURUSD chart stacks RSI, Stochastic and CCI over about six months, and the lines rise and fall together. In August the Stochastic sat above 80 for weeks, while RSI only touched 70. On our daily data, RSI and Stochastic had a correlation of 0.833.
When RSI read 70 or more, the Stochastic also sat at 80 or more 93.4% of the time. The reverse held only 18.5% of the time. So two lines from the same closes act like one witness. For a second view, pick a tool with a different job, as our MACD vs Stochastic comparison shows.
Hourly charts and gold
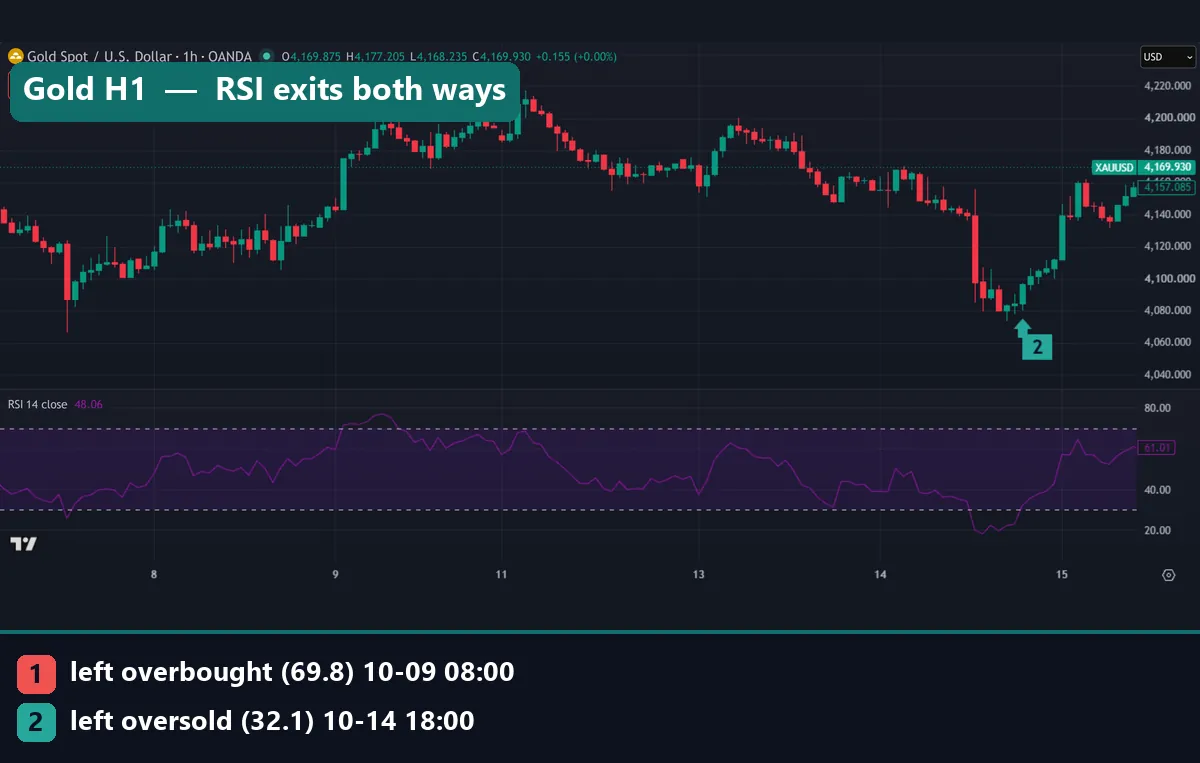
Hourly bars told the same story. Overbought exits came out 46.0% to 50.5% lower 10 bars later, and oversold exits 50.8% to 57.8% higher. We have no hourly base rate, so read those against 50%. The 57.8% for RSI leaving oversold rests on just 244 signals from four symbols, so treat it as a lead to retest.
On gold, marker 1 is RSI leaving overbought at 69.8 at 08:00 UTC on 9 October 2026, with gold at 4,187.75 dollars. Price did not fall away, and it pushed above 4,200 early on 12 October. Marker 2 is RSI leaving oversold at 32.1 at 18:00 UTC on 14 October, at 4,096.63. Ten bars later gold traded above 4,120. See our gold RSI chart guide for more.
Four common mistakes with oscillators
1. Selling because the line sits high. Sitting in the zone was not a signal in our tests. Also, the Stochastic spends about one day in five above 80.
2. Counting two oscillators as two confirmations. RSI and Stochastic share most of their information. A second opinion should read a different input, such as a higher timeframe or a price level.
3. Assuming the same name means the same signal. Check the price source, smoothing and zone lines on each platform. Switching CCI from typical price to close moved both of our signals by a bar.
4. Ignoring the base rate. A figure of 52.6% higher after oversold sounds like an edge until you see 52.3% for all days. Always ask what a random day would have done.
Where to go next
Divergence is the other common way to read these lines. Our RSI divergence explainer covers it, and it deserves the same base-rate check. For a short general definition, see the oscillator entry at Investopedia. Once you know what each line measures, its signals look less like magic and more like arithmetic.
FAQ: oscillators in trading
What is an oscillator in trading?
It is an indicator that moves back and forth inside a range or around a centre line. RSI, Stochastic and Williams %R have fixed limits, while CCI and MACD do not. Traders use them to judge how stretched price looks.
Which oscillator worked best in our test?
None stood out by much. RSI leaving overbought was the only daily signal more than half a point better than chance: 53.7% lower 10 days later, against 47.7% on any day.
Why does the Stochastic give more signals than RSI?
Its 80 and 20 lines sit closer to normal readings. On daily forex, the Stochastic spent 22.1% of bars above 80, against 4.4% for RSI at 70 or higher. So it gave 1,514 overbought exits to RSI’s 492.
Is CCI an oscillator if it has no limits?
Yes. CCI swings around zero with no ceiling, which makes it a centred, unbounded oscillator. Its +100 and -100 lines are habits, and on our daily data CCI spent 42% of bars beyond them.
Do oscillators work better on hourly charts?
Not clearly. Hourly exits on EURUSD, GBPUSD, USDJPY and gold came out between 46.0% and 57.8% in the expected direction. The best figure rests on only 244 signals.
Should I combine RSI and Stochastic?
It adds less than it seems. Their daily readings had a correlation of 0.833, so a tool built on different information makes a better second check.
Are MACD and momentum oscillators?
Yes. Both swing around zero with no fixed top or bottom, which makes them centred oscillators. We left them out of this test.
Can oscillators predict reversals?
Not on their own, in our data. Leaving an extreme zone predicted the next 10 days little better than chance on 23 pairs, before spread, swap and commission; results are not guaranteed; past performance is not indicative of future results.
Last updated: 19 October 2026.

About the author
Written by Dominic Walsh, a Forex trader and MT4/MT5 indicator, Expert Advisor and script developer. Every tool on forexmt4systems.com is tested on live charts before release and ships with ready-to-use compiled MT4 (.ex4) and MT5 (.ex5) files. Learn more about the trader and developer behind this site.
How we build, test and correct every tool: Editorial & Testing Policy. Trading carries risk; see the disclaimer.