
MACD vs Stochastic is really a choice between a slow signal and a fast one. Both sit in a pane under the chart, and both have two lines that cross. But they measure different things, and on our EURUSD daily test the Stochastic crossed about three times as often as the MACD. This guide explains both formulas, shows both on the same charts, and settles which one fits which kind of trade.
What MACD and the Stochastic actually measure
MACD stands for Moving Average Convergence Divergence. Gerald Appel built it. It tracks the gap between two exponential moving averages of the close. So it answers one question: is short-term momentum pulling away from the longer trend, or falling back toward it? The value is in price units, so on EURUSD it reads in fractions of a cent.
The Stochastic Oscillator comes from George Lane. It asks a different question: where did this bar close inside the recent high-low range? A close at the top of the range reads near 100. A close at the bottom reads near 0. So the Stochastic is bounded, while MACD is not.
That difference drives almost everything else. MACD moves slowly, while the Stochastic moves fast and hits its extremes often. For a longer primer on each tool, read our MACD explained guide and what the stochastic oscillator is.
How MACD works: the formula
MACD has three parts, and each one builds on the last.
- MACD line:
EMA(close, 12) - EMA(close, 26) - Signal line:
EMA(MACD line, 9) - Histogram:
MACD line - signal line
When the 12-period average rises faster than the 26-period one, the MACD line climbs. Then the signal line follows it, but one step behind. So the histogram shows the gap between the two. It grows while momentum speeds up and shrinks while it fades.
A cross of the MACD line over its signal line is the classic trigger. However, every input here is an average of an average. That smooths out noise, but it also adds delay. By the time the lines cross, part of the move has often happened. For the exact calculation TradingView uses, see TradingView’s MACD help page. Our SMA vs EMA guide explains the averages.
How the Stochastic works: the formula
The Stochastic also has two lines, but its math is simpler.
- Raw %K:
(close - lowest low of 14) / (highest high of 14 - lowest low of 14) x 100 - %K (slow): the raw value smoothed with a 3-period simple average
- %D:
SMA(%K, 3)
So a reading of 90 means the close sat near the top of the last 14 bars. A reading of 10 means it sat near the bottom. The standard bands are 80 and 20. Above 80 is called overbought and below 20 oversold, but those words only describe position. They do not predict a turn.
Because the window is short and the smoothing is light, %K reacts to almost every swing. Then %D trails it by a few bars, and the two cross often. The StockCharts fast, slow and full Stochastic article at StockCharts ChartSchool covers the three smoothing variants. Also, our slow stochastic guide shows why the smoothed version is the default today.
How we tested MACD vs Stochastic
We ran both indicators with their default settings on two charts. First, EURUSD daily from the OANDA feed, from 1 August 2025 to 25 September 2026. Next, EURUSD H1 from 10 September 2026 to 28 September 2026. On each chart we counted events over the last 259 bars, so the warmup bars at the start did not skew the counts.
We counted three things. First, how often the MACD line crossed its signal line. Second, how often Stochastic %K crossed %D. Third, how many bars %K spent above 80 or below 20. We then divided the bar count by the number of crosses to get the average gap between signals.
The screenshots come from the TradingView web chart, captured on 28 September 2026. We also added one GBPUSD daily chart as a second market. We did not trade these signals or measure profit. Our full method is on the editorial testing policy page.
Default settings side by side
Both tools ship with three numbers. However, the numbers mean different things, so the same change has a different effect on each.
| Parameter | MACD default | Stochastic default | What raising it does |
|---|---|---|---|
| Main length | Fast EMA 12 | %K lookback 14 | Slower line, fewer crosses |
| Second length | Slow EMA 26 | %K smoothing 3 | Smoother line, more delay |
| Signal length | Signal EMA 9 | %D period 3 | Later crosses, fewer of them |
| Source | Close | High, low and close | Not a length setting |
| Scale | Unbounded, price units | Bounded, 0 to 100 | Not a length setting |
| Reference levels | Zero line | 80 and 20 | Not a length setting |
Note the source row. MACD only looks at closes. The Stochastic uses the highs and lows too, so a long wick moves it even when the close barely changes. For tuning ideas, see the best MACD settings and the best setting for the Stochastic.
Reading MACD vs Stochastic on a chart
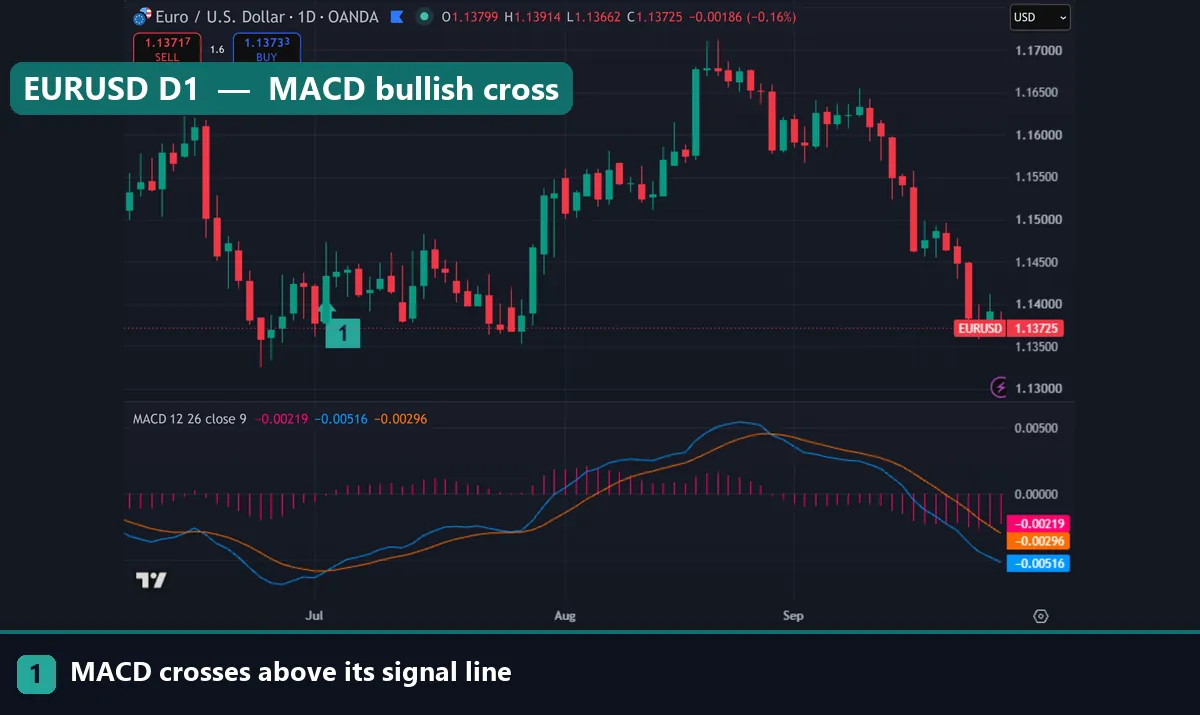
The first chart shows MACD alone on EURUSD daily. Marker 1 sits at the start of July, where the blue MACD line crossed above the orange signal line. Both lines were still below zero at that point. Then price climbed through July and August, and the MACD line crossed above zero toward the end of July. So the cross came near the low, but the zero-line cross came weeks later.
Notice how few crosses the pane shows from July to September. That is the MACD style: slow, with few signals.
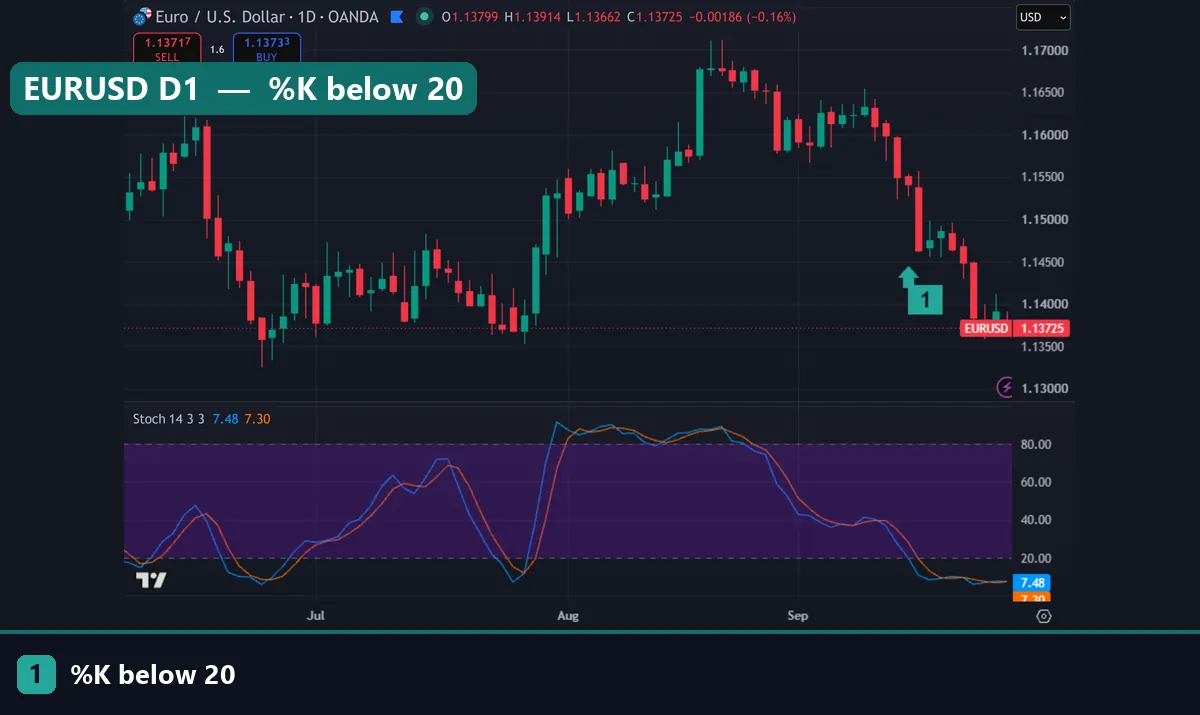
The second chart shows the Stochastic on the same pair and dates. Marker 1 sits in mid-September, where %K fell below 20. Price kept falling after that, and %K stayed under 20 to the right edge of the chart, where it read 7.48 against a %D of 7.30.
So the oversold reading was not a buy signal. It told you the close sat near the bottom of the range, which it did for bar after bar. In contrast, look at August: %K sat above 80 for weeks while price held near its highs. Our guide on what overbought and oversold mean goes deeper on this.
Worked example: EURUSD daily and H1 counts
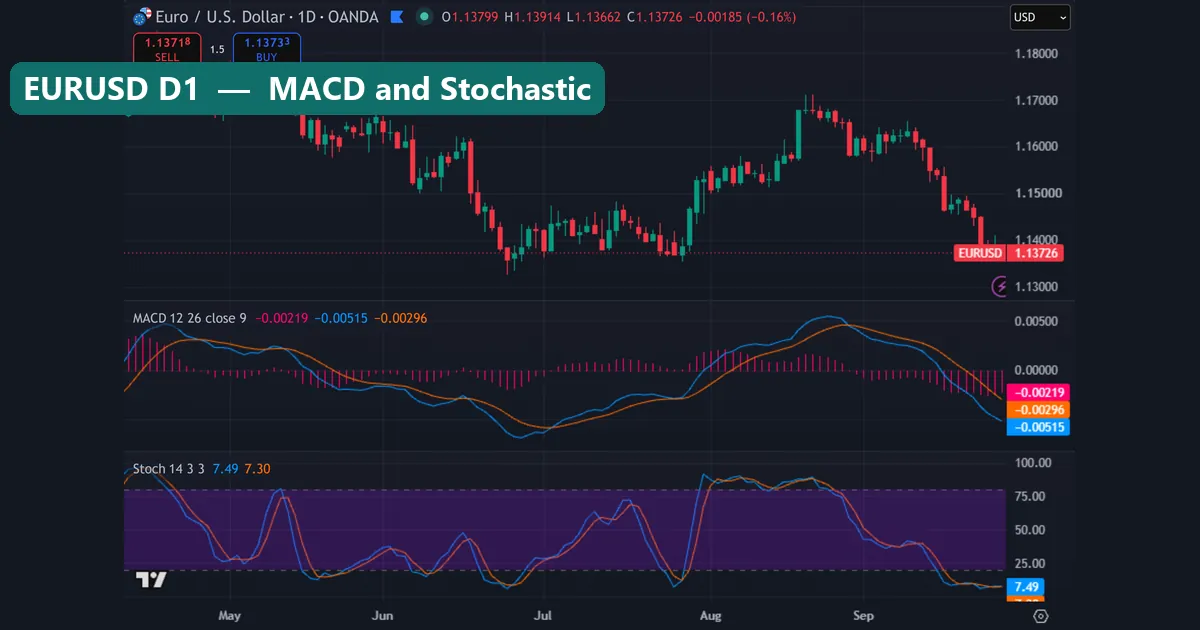
Here are the numbers from our test. On EURUSD daily, over 259 bars, MACD(12,26,9) crossed its signal line 18 times. That is about one cross every 14.4 bars. Over the same bars, Stochastic(14,3,3) %K crossed %D 55 times, or about one cross every 4.7 bars. So the Stochastic gave roughly three crosses for every MACD cross.
The H1 chart told the same story. Over 259 hourly bars, MACD crossed 15 times, about every 17.3 bars. The Stochastic crossed 61 times, about every 4.2 bars. That gap is closer to four to one.
The extremes were busy too. On the daily chart, %K spent 43 bars above 80 and 50 bars below 20. That is 93 of 259 bars in a zone that many traders treat as a signal. On H1, %K spent 13 bars above 80 and 67 bars below 20, because the hourly chart was in a steady decline.
Now look at the latest values. On 25 September our daily export put %K at 7.6 and the MACD line at -47.43 pips. By the 28 September capture in the first image, the MACD line read -0.00515, the signal -0.00296 and the histogram -0.00219. Both tools agreed that momentum was down. But the Stochastic had flagged it as extreme for days, while MACD simply showed a widening gap.
Changing the settings in TradingView
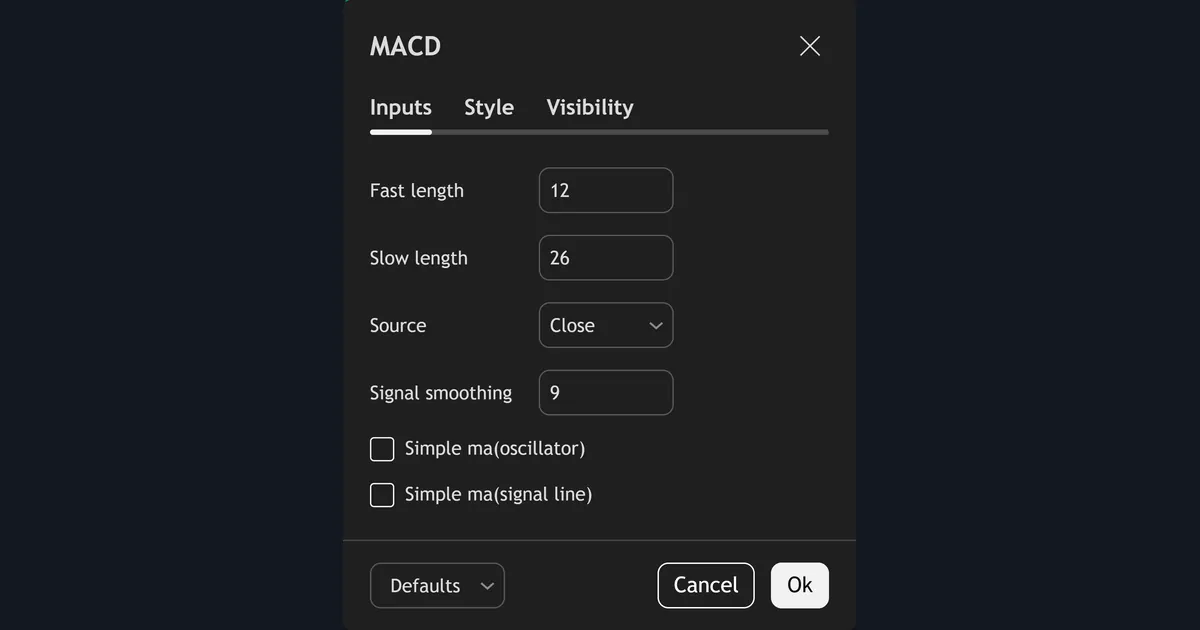
The MACD dialog has four inputs: fast length 12, slow length 26, source close and signal smoothing 9. Two checkboxes switch the oscillator or the signal line to a simple average.
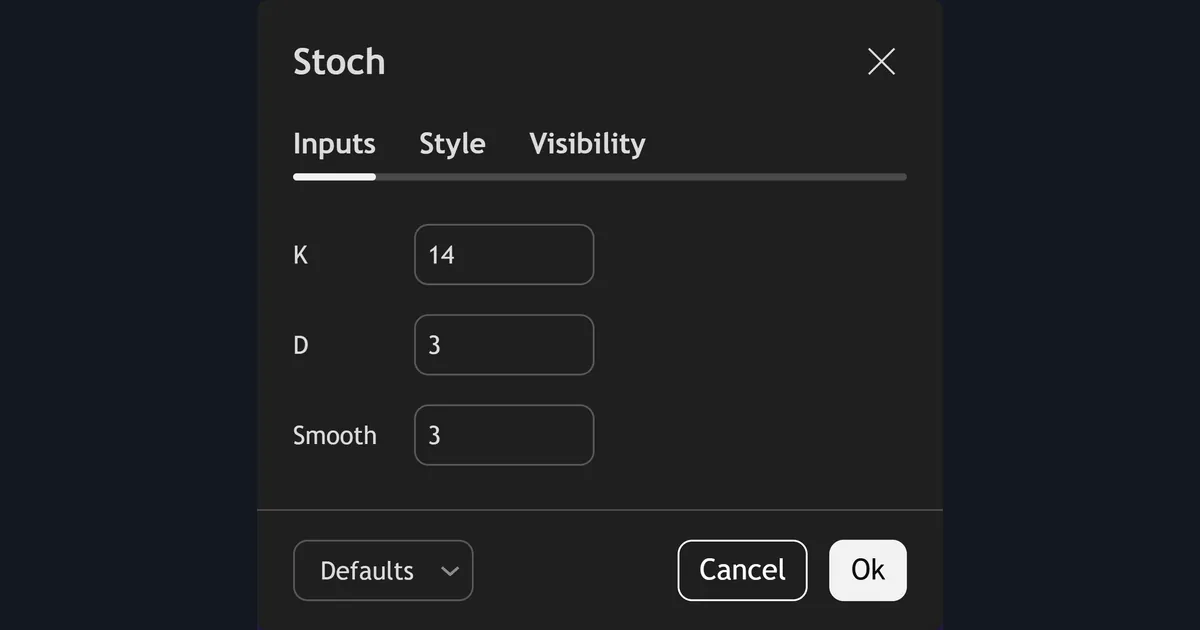
The Stochastic dialog is shorter. K is 14, D is 3 and Smooth is 3. Here, Smooth is the %K smoothing, and D is the %D average of that smoothed line. If you set Smooth to 1, you get the fast Stochastic, which crosses even more often. MetaTrader uses the same three ideas under different names. For the MT4 and MT5 function, see the iMACD reference in the MQL5 documentation. Also note that MetaTrader’s built-in MACD draws the MACD line as a histogram and uses a simple average for its signal line, so its crosses will not match TradingView bar for bar.
Download the complete indicator database
Put these concepts on your charts. One email unlocks the full library of 1,380+ indicators with compiled MT4 and MT5 files, plus my TradingView scripts. No paywall, no spam, unsubscribe any time.
Get free access to my indicator database
One email unlocks 1,380+ free MT4, MT5 and TradingView indicators — the complete library. No single-tool download; you get the whole database.
Where it fails: lag and noise
Each tool fails in its own way, and the failure is the flip side of its strength.
MACD fails through lag. It stacks three averages, so its crosses arrive late. In a fast reversal, the cross can come after much of the move is done. In a flat, choppy market it also whipsaws: the lines twist around each other near zero and each cross goes nowhere.
The Stochastic fails through noise. On our daily test it crossed 55 times in 259 bars, and most of those crosses were small wiggles. In a strong trend it pins itself to one extreme. So a trader who sells every reading above 80 keeps selling into a rising market, as the GBPUSD chart below shows.
Both tools also share one blind spot. They are built only from price, so they add no new information. Two oscillators that agree are not two votes. Instead, they are one price series seen twice. Our RSI and MACD together guide explains how to avoid this overlap.
Lag and noise on other charts
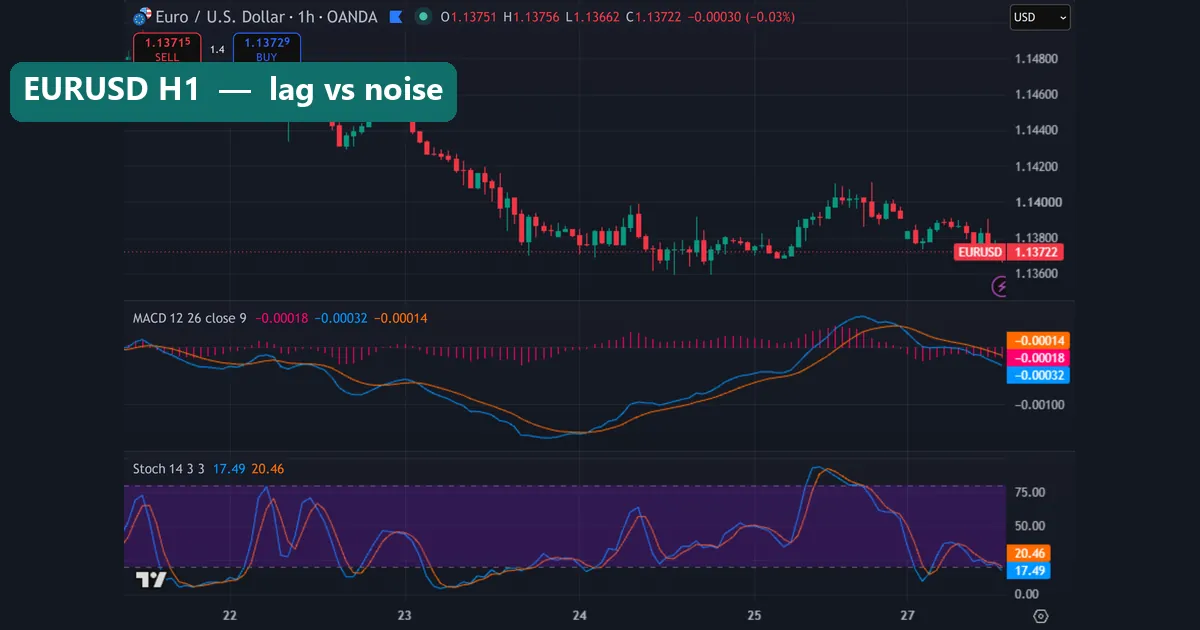
This is EURUSD H1 from 22 to 27 September, with both indicators. The planned marker for a bearish MACD cross did not render cleanly in the capture, so read the pane directly. Near the right edge, the blue MACD line has dropped back under the orange signal line after a rise on 25 and 26 September. The Stochastic, meanwhile, swung from above 75 down to below 20 across the same stretch, crossing %D several times. At capture it read 19.61 for %K and 21.16 for %D.
So one MACD turn lined up with a cluster of Stochastic crosses, which is our four-to-one count seen on screen.
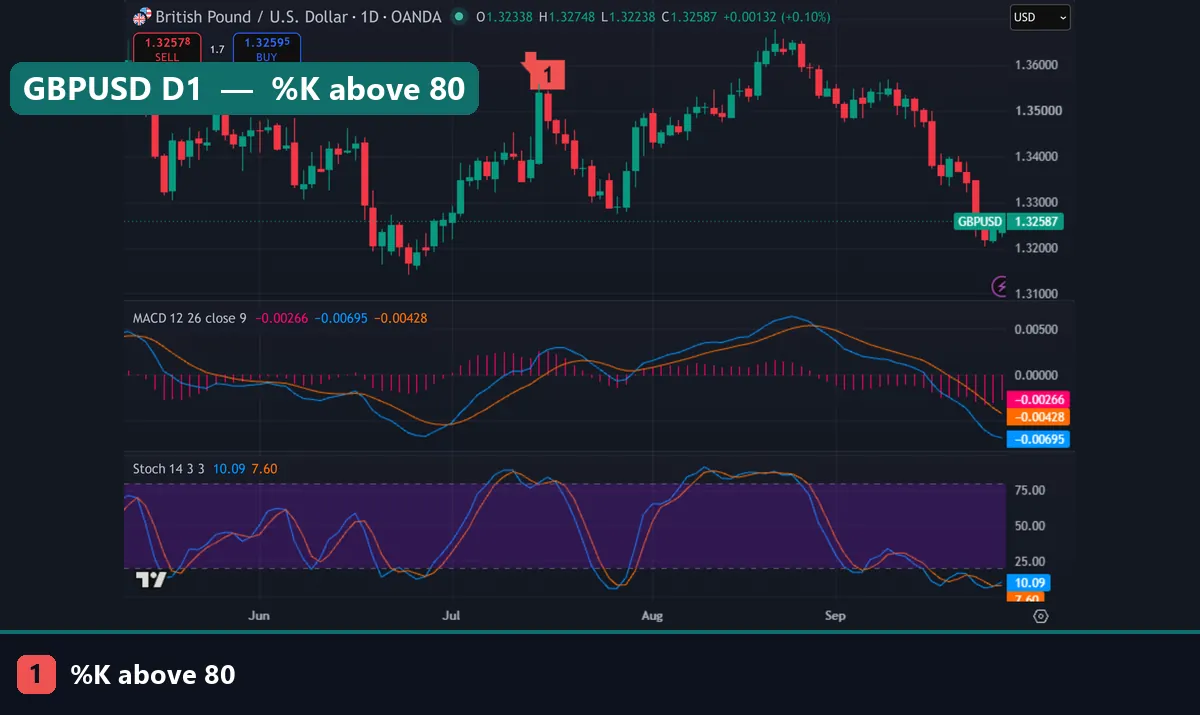
The last chart is GBPUSD daily. Marker 1 sits at a mid-July high, where %K rose above 80. Price did fall for a couple of weeks after that. Yet look at August: %K pushed back above 80 and stayed there for most of the month while price climbed to its highs. A sell on each overbought reading would have been right once and wrong for weeks. Through that August climb, MACD stayed above its signal line.
Common mistakes with MACD and the Stochastic
- Treating 80 and 20 as sell and buy levels. They describe where the close sits in the range. In a trend, the Stochastic can stay at an extreme for weeks, as our GBPUSD chart shows.
- Taking every Stochastic cross. With a cross about every 4.7 daily bars, most are noise. So filter them, for example with the trend on a higher timeframe or with a cross that happens inside an extreme zone.
- Expecting MACD to catch the turn. It confirms a move after it starts. If you need early entries, MACD alone will frustrate you.
- Stacking both and calling it confirmation. Both are built from the same bars. Agreement is common and adds little. Instead, pair one of them with something that uses other data, such as volume or a support level.
Divergence is another trap, since it can last a long time before price turns. Our guide on how to trade divergence covers the rules we use.
Which oscillator fits your trade: MACD vs Stochastic
The answer depends on the trade you plan. Neither tool is more profitable by nature; each is a filter with a speed.
First, pick MACD if you trade with the trend and hold for days. Its slow crosses and zero line help you stay in a move and skip small pullbacks. Its main cost is late entries.
Next, pick the Stochastic if you trade pullbacks or ranges. It shows you when price sits at the edge of a recent range, which helps you time an entry in the direction you already chose. Its main cost is many false crosses.
Then there is the combined approach. Some traders use MACD on a higher timeframe for direction and the Stochastic on a lower one for timing. That works because the two jobs differ. Still, test it on your own pair first, since our counts only cover EURUSD and one GBPUSD chart. The how to use the stochastic oscillator guide shows timing setups in more detail.
Where to go next
If you want to compare these two with other tools, start with MACD vs RSI and RSI vs Stochastic. For a close cousin of the Stochastic, read Williams %R vs Stochastic. For shorter charts, see our MACD scalping settings.
For outside reading, the Stochastic oscillator entry on Wikipedia covers Lane’s background.
FAQ: MACD vs Stochastic
Is MACD or the Stochastic better for beginners?
MACD is often easier to start with, because it gives fewer signals and each one is tied to a trend shift. The Stochastic moves fast and tempts new traders into overtrading. That said, learn both formulas first, since the formula tells you what each line can and cannot do.
Why does the Stochastic give so many more signals?
It uses a short 14-bar range and light smoothing, so it reacts to almost every swing. MACD stacks longer exponential averages, which slows it down. In our EURUSD daily test, that meant 55 Stochastic crosses against 18 MACD crosses over 259 bars.
Can I use MACD and the Stochastic together?
Yes, but give them different jobs. A common split is MACD for direction on a higher timeframe and the Stochastic for timing on a lower one. However, do not count their agreement as two separate confirmations, because both come from the same prices.
Does an oversold Stochastic mean price will rise?
No. A reading below 20 only says the close sits near the bottom of the last 14 bars. In our EURUSD daily chart, %K stayed below 20 for the whole second half of September while price kept falling.
What does the MACD histogram show?
It shows the MACD line minus the signal line. So it grows when momentum speeds up and shrinks as it fades. When the histogram crosses zero, the two lines have crossed.
Which is better for scalping, MACD or the Stochastic?
The Stochastic reacts faster, so many scalpers prefer it for timing. But on our H1 test it crossed 61 times in 259 bars, so it needs a filter. MACD on short charts lags more, though shorter settings can speed it up at the cost of more noise.
Do MT4 and TradingView calculate these the same way?
The Stochastic is close, though default periods can differ, so check the inputs. MACD differs more: MetaTrader’s built-in version draws the MACD line as a histogram and uses a simple average for the signal line. As a result, crosses can land on different bars.
Can either indicator predict where price goes next?
No. Both describe what price has already done, one as momentum and one as position in a range. Use them to frame a plan, set your exit before you enter, and size risk to what you can afford to lose; results are not guaranteed; past performance is not indicative of future results.
Last updated: 28 September 2026.

About the author
Written by Dominic Walsh, a Forex trader and MT4/MT5 indicator, Expert Advisor and script developer. Every tool on forexmt4systems.com is tested on live charts before release and ships with ready-to-use compiled MT4 (.ex4) and MT5 (.ex5) files. Learn more about the trader and developer behind this site.
How we build, test and correct every tool: Editorial & Testing Policy. Trading carries risk; see the disclaimer.