
The slow stochastic is the smoothed version of George Lane’s oscillator, and it is the one most platforms show by default. It measures where the current close sits within the recent high-low range, then smooths that reading so it produces fewer false turns than the fast version. This guide covers the formula, how slow differs from fast, and the context that decides whether an extreme reading means anything.
What the slow stochastic measures
The starting point is a simple question: where did price close relative to its recent range? A close at the top of the range means buyers finished in control; a close at the bottom means sellers did.
%K = (close − lowest low) ÷ (highest high − lowest low) × 100
The lookback is normally 14 periods. A reading of 80 means the close sat 80% of the way up the fourteen-period range.
That raw calculation is the fast %K, and it is jumpy. The slow version applies smoothing, which is the whole difference between the two.
Fast versus slow
The distinction confuses people because both use the same underlying maths and both show two lines. The difference is one smoothing step.
| Version | %K line | %D line | Character |
|---|---|---|---|
| Fast | Raw calculation | 3-period average of %K | Very responsive, many false signals |
| Slow | 3-period average of raw %K | 3-period average of slow %K | Smoother, fewer signals, slight lag |
| Full | Smoothing period is adjustable | Adjustable average | Same idea with the smoothing exposed |
So the slow %K is simply the fast %D. Everything shifts one step along, adding a layer of averaging.
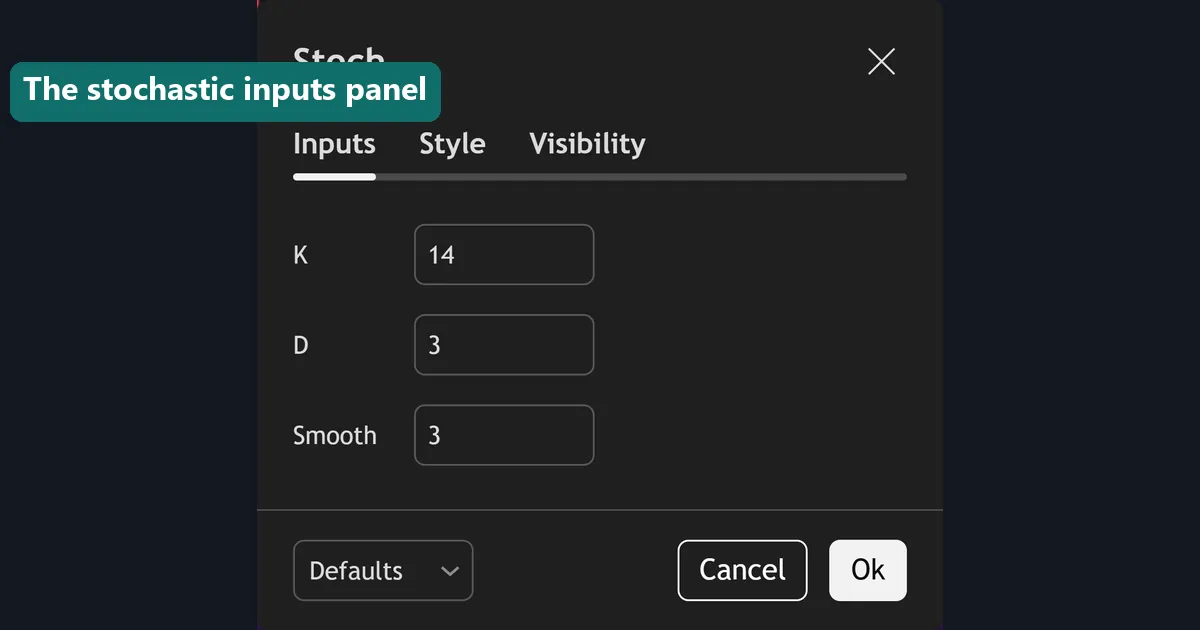
The default 14, 3, 3 gives you a fourteen-period lookback with three-period smoothing on both lines. That is the setting most platforms ship and most traders leave alone, with good reason: faster settings mostly add noise. Our best stochastic settings guide covers when a change is justified.
The signals it produces
Three readings, in ascending order of usefulness.
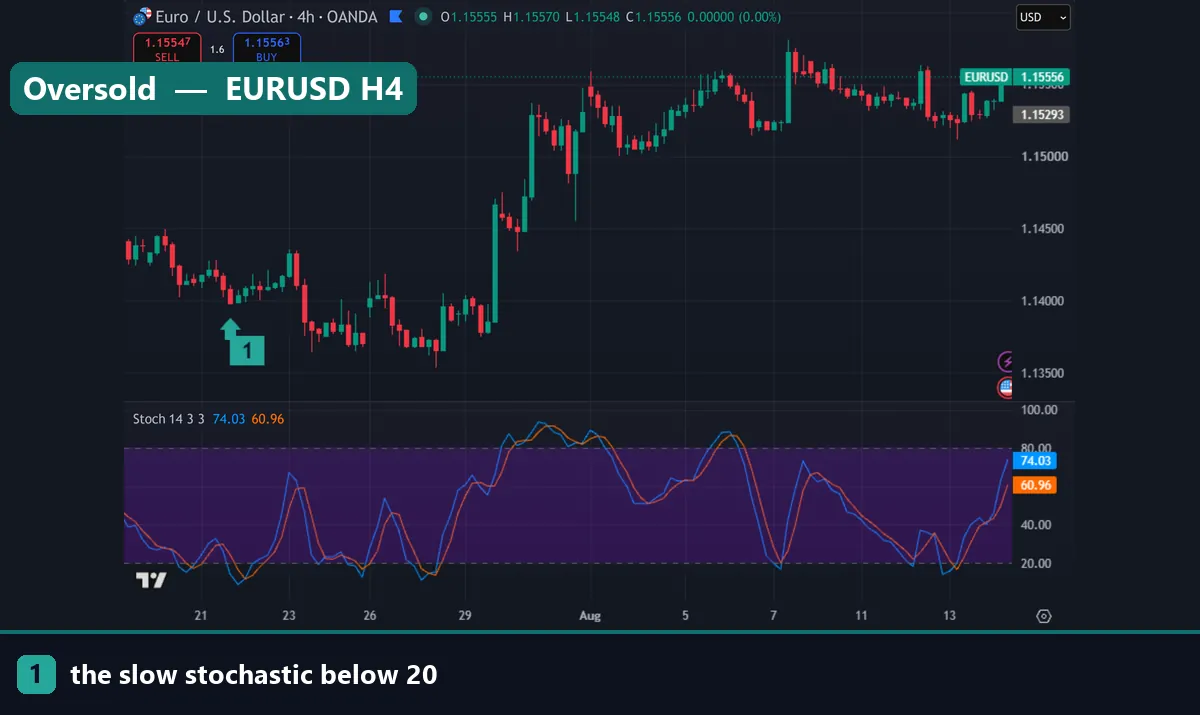
Overbought and oversold. Above 80 is conventionally overbought, below 20 oversold. The signal is the cross back out of the zone, not the entry into it. Buying the moment %K touches 20 means buying while selling pressure still dominates.
The %K and %D cross. When %K crosses above %D in oversold territory, that is the classic buy read, and the mirror for sells. Crosses in the middle of the range mean far less.
Divergence. Price making a lower low while the oscillator makes a higher low says the new low came with less force. This is the strongest reading, because it compares two swings rather than one value.
Where the classic reading fails
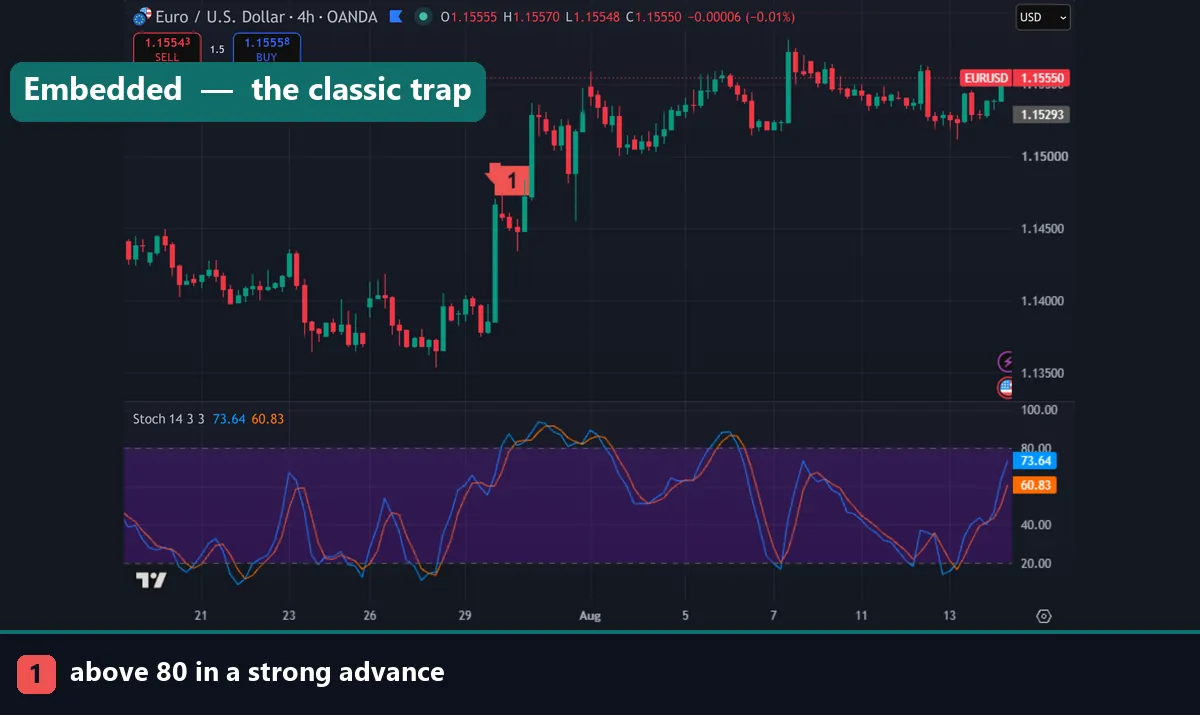
Same trap as every oscillator, and it deserves stating plainly. An overbought reading is not a sell signal.
In a strong uptrend, closes keep landing near the top of the range, so the stochastic sits above 80 for a long time. Traders call this embedding. Each new overbought reading looks like a better short than the last, and each one loses money.
Context decides. In a ranging market, extremes mark the edges and mean reversion works — this is the environment the tool was designed for. In a trending market, extremes confirm strength and fading them is a reliably losing rule.
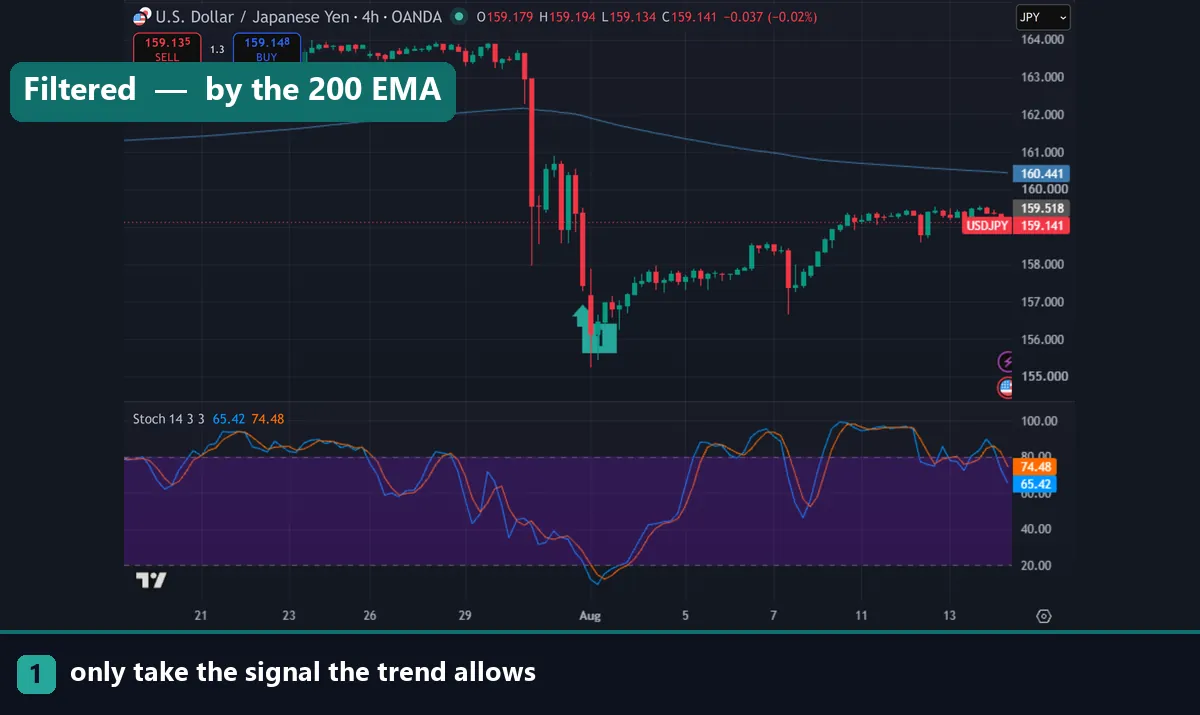
The fix is a trend filter. With a 200 EMA on the chart, take oversold buys only above the line and overbought sells only below it. Our EMA trading strategies guide covers the variations, and the same principle appears in our RSI buy and sell signals guide.
Download the complete indicator database
Put these concepts on your charts. One email unlocks the full library of 1,380+ indicators with compiled MT4 and MT5 files, plus my TradingView scripts. No paywall, no spam, unsubscribe any time.
Get free access to my indicator database
One email unlocks 1,380+ free MT4, MT5 and TradingView indicators — the complete library. No single-tool download; you get the whole database.
Choosing settings and timeframe
Two decisions matter, and the second matters more.
Settings. The 14, 3, 3 default suits most work. Shortening the lookback to 5 or 9 produces far more signals with a much lower hit rate. Lengthening it to 21 smooths further at the cost of timing. If the tool feels too noisy, change the timeframe before changing the numbers.
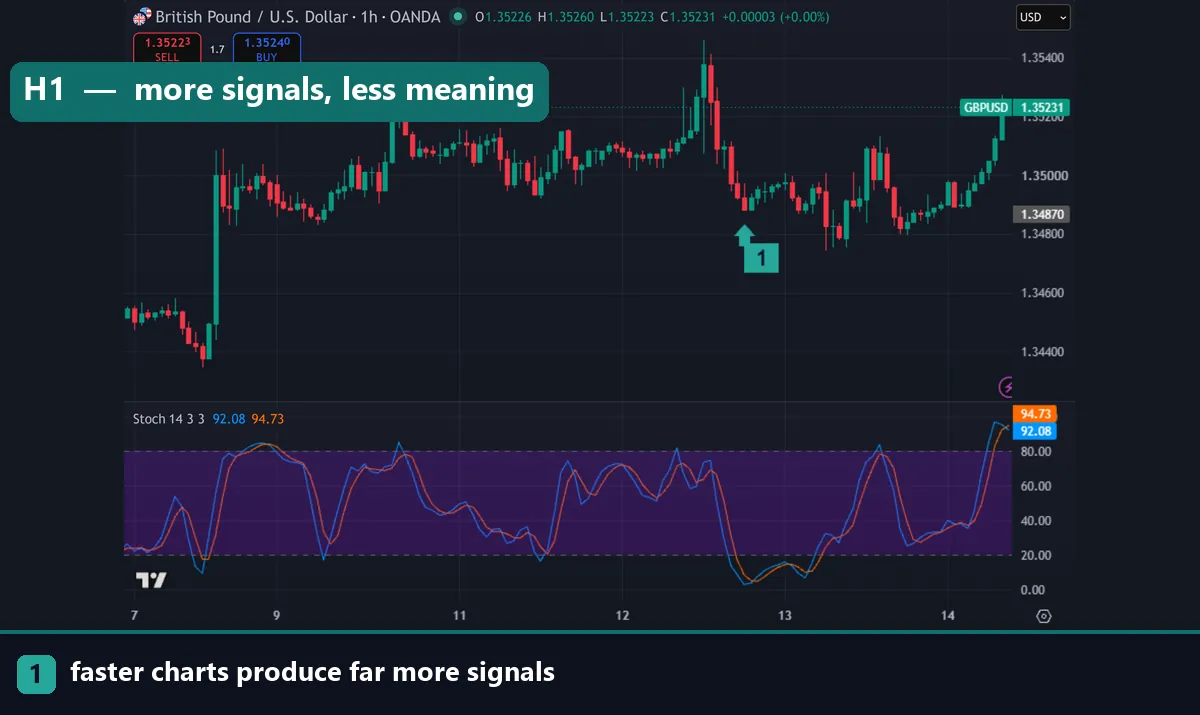
Timeframe. H4 and daily readings carry real information. On M5 and M15 the oscillator crosses 20 and 80 constantly, and most of those crossings lead nowhere. This is the single biggest determinant of whether the tool is useful.
Set stops on structure rather than on the oscillator, since it turns long before price does. Our ATR stop loss guide covers the distance and the position sizing calculator the lots.
Stochastic against RSI
Both are momentum oscillators scaled 0 to 100, and traders often run both without realising they measure closely related things.
The stochastic compares the close to the recent range. RSI compares the size of recent gains to recent losses. In practice the stochastic is more sensitive and produces more signals, while RSI is smoother and holds extremes longer.
Running both is usually duplication rather than confirmation. Pick one momentum tool, then add something that measures a different thing entirely — trend direction or volatility — as covered in our best entry and exit indicators guide.
Common mistakes
Four repeat. Selling every reading above 80 tops the list, and in a trend the oscillator embeds there for weeks. Entering on the touch rather than the cross back out comes second. Third, traders use it on M5 where the crossings are noise. Fourth, they run stochastic and RSI together and treat the agreement as two confirmations when it is one.
Where to go next
The oscillator is one input among several. Set it up with the best stochastic settings, then read the RSI divergences cheat sheet for the divergence reads that transfer directly. Our best entry and exit indicators guide covers combining tools without duplicating them. To load a custom stochastic variant, follow how to install MT4 and MT5 indicators. For further reading, Investopedia explains the stochastic oscillator at Investopedia, and the stochastic oscillator article on Wikipedia covers Lane’s original work.
FAQ
What is the slow stochastic?
The smoothed version of the stochastic oscillator. Its %K line is a three-period average of the raw calculation, which removes much of the noise the fast version produces.
What is the difference between fast and slow?
One smoothing step. The slow %K equals the fast %D, and the slow %D averages that again. Slow gives fewer signals with slightly more lag, which is usually the better trade.
What do 14, 3, 3 mean?
A fourteen-period lookback for the range, three-period smoothing on %K and three-period smoothing on %D. It is the platform default and suits most timeframes.
Does a reading above 80 mean sell?
No. It means closes are landing near the top of the recent range, which describes a strong uptrend. The oscillator can stay above 80 for weeks while price keeps rising.
Which timeframe suits it best?
H4 and daily. On M5 and M15 the oscillator crosses the extremes constantly and most of those crossings carry no information worth acting on.
Should I use stochastic or RSI?
One or the other. Both measure momentum, so running both gives the same information twice rather than a second confirmation. Trading involves risk, results are not guaranteed, and past performance is not indicative of future results.

About the author
Written by Dominic Walsh, a Forex trader and MT4/MT5 indicator, Expert Advisor and script developer. Every tool on forexmt4systems.com is tested on live charts before release and ships with ready-to-use compiled MT4 (.ex4) and MT5 (.ex5) files. Learn more about the trader and developer behind this site.
How we build, test and correct every tool: Editorial & Testing Policy. Trading carries risk; see the disclaimer.