
Wyckoff accumulation is a sideways range where, in Richard Wyckoff’s reading, large buyers absorb supply before prices rise. Its best-known event is the spring: a dip under the floor of the range that closes back inside. This guide settles what the schematic says, how to read a spring on a chart, and what springs did on 23 forex pairs in our own test. The short answer: daily springs leaned up a little, hourly springs did not, and upthrusts failed as sell signals.
What Wyckoff accumulation is
Richard D. Wyckoff (1873 to 1934) was a New York broker, trader and publisher. His biography on Wikipedia names him as the founder of The Magazine of Wall Street and a pioneer of technical analysis. He studied how the big operators of his day built and sold positions.
In his model, a market cycles through accumulation, markup, distribution and markdown. In accumulation, price stops falling and swings sideways while, in his view, large buyers collect stock from tired sellers. He pictured those buyers as one imagined trader, the “Composite Man”, an idea the Wyckoff Method tutorial at Wyckoff Analytics quotes from his course.
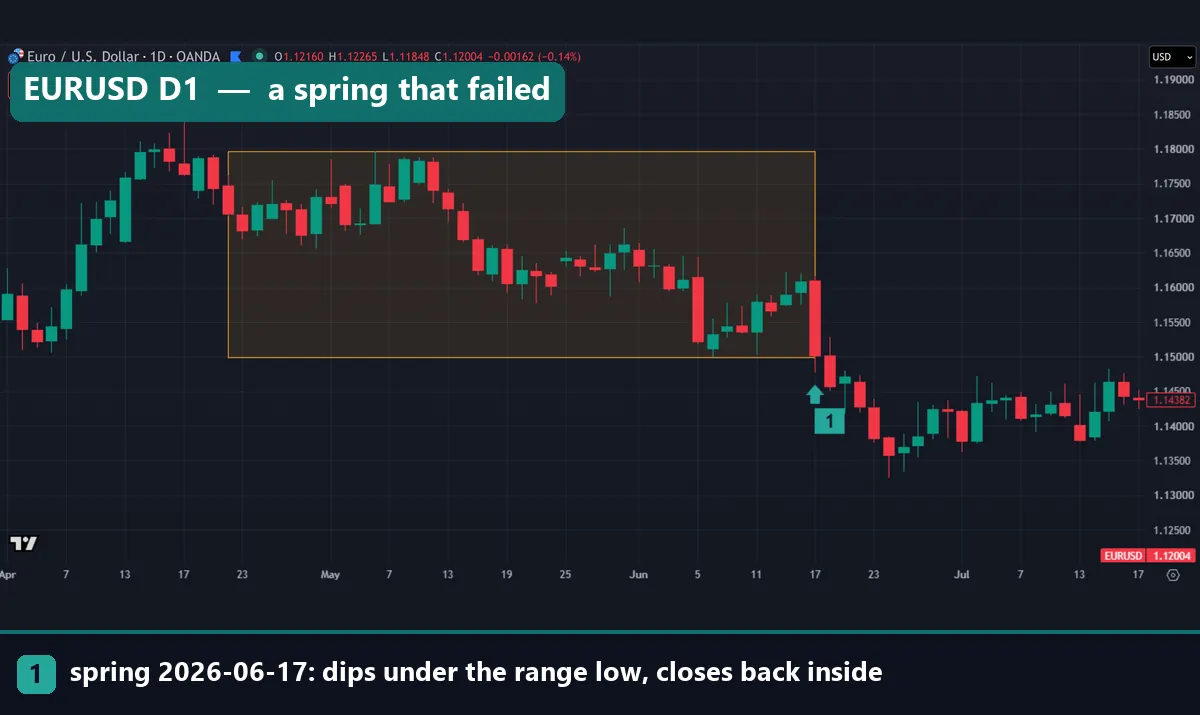
The chart above shows why “accumulation” is a label, not a fact. On EURUSD daily, price spent about two months inside the yellow box. On 17 June 2026 it dipped under the floor and closed back inside, marker 1. That is a spring by the book. Then the pair kept falling. Nobody can see the buyers, only the bars, so the label proves itself only after the move.
How it works: the five phases and the spring
Wyckoff students split an accumulation range into five phases, A to E. The table follows StockCharts ChartSchool’s Wyckoff Method tutorial.
| Phase | What happens | Key events |
|---|---|---|
| A | The downtrend stops | Preliminary support, selling climax, automatic rally, secondary test |
| B | The range builds a “cause” | Repeated tests of both edges |
| C | A last test of supply | Spring or shakeout, then a test of it |
| D | Demand takes control | Sign of strength, last point of support, back-up |
| E | Price leaves the range | Markup, sometimes with new, higher ranges |
The spring is the key event of Phase C. Price breaks under the floor, late sellers jump in, and then price snaps back inside. The tutorial calls it a bear trap. A spring is optional, though: its second schematic shows a range with no spring at all.
Wyckoff also leaned on volume. A spring on low volume, then a test of it on even lower volume, was his sign that supply had dried up. The same idea drives volume spread analysis. As we coded it for our test, the rule looks like this:
range_high = highest high of the previous 40 bars
range_low  = lowest low of the previous 40 bars
sideways   = range_high - range_low <= 6 * ATR(14)
spring     = low < range_low and close > range_low
upthrust   = high > range_high and close < range_high
The mirror image: distribution and the upthrust
Distribution is accumulation turned upside down. It forms after a rally, when, in Wyckoff’s view, large holders sell into public buying. Its Phase C event is the upthrust: a push above the ceiling that closes back inside. Traders call a late one an upthrust after distribution, or UTAD.
The tutorial adds a warning of its own. Traders who short every upthrust can get stopped out by one after another, so it suggests waiting for a weak rally later in the range. Our data, below, gives that warning teeth.
Smart money traders know the spring as the manipulation leg of accumulation, manipulation and distribution, or simply as a stop run.
How we tested Wyckoff springs and upthrusts
Wyckoff is a reading method, not one rule. A trained reader weighs volume, the shape of each swing and the wider market. A script cannot do that, so we tested one mechanical version of the two Phase C events. We wrote the rules before we looked at any result.
The daily test ran in MetaTrader 4, build 1471, on Capital Point Trading history. It covers 12 June 2018 to 24 August 2026, though some pairs start later. These are the 23 pairs:
- Dollar pairs: EURUSD, GBPUSD, USDJPY, USDCHF, USDCAD, AUDUSD
- Yen and franc crosses: AUDJPY, CADJPY, CHFJPY, GBPJPY, NZDJPY, AUDCHF, CADCHF, GBPCHF, NZDCHF
- Other crosses: AUDCAD, AUDNZD, EURAUD, EURGBP, GBPAUD, GBPCAD, GBPNZD, NZDCAD
The hourly test used EURUSD, GBPUSD and USDJPY from 22 December 2025 to mid-August 2026, plus gold (XAUUSD) from 1 July 2025 to 20 August 2026.
The chart examples come from the TradingView web chart with OANDA daily data, captured on 23 October 2026. The yellow box is the 40-bar range, and the marker sits on the spring bar. We placed no trades, so every figure is before spread, swap and commission. Our editorial testing policy sets out the full method.
Our test parameters
Here is the full rule set. Change one line and you get a different sample, so read our numbers as results for these settings only.
| Parameter | Our setting | Why |
|---|---|---|
| Trading range | The previous 40 bars | About two months of daily bars |
| Sideways filter | Range height no more than 6 ATR(14) | Keeps trends out |
| Spring | Low under the range low, close back inside | Expect up |
| Upthrust | High over the range high, close back inside | Expect down |
| Break | A close outside the range | Expect the break to continue |
| Spacing | At most one event per 5 bars | One move counts once |
| Outcome | Close 5, 10 and 20 bars later | Further in the expected direction? |
| Base rate | Every 7th bar, read as a long | What an ordinary day did |
| Volume | Not used | Spot FX has tick volume only |
| Costs | Not included | Before spread, swap and commission |
ATR is the average true range over 14 bars. Our guide to what ATR means in trading explains it, and the iATR function in the MQL4 Reference shows how MetaTrader 4 computes it.
Reading a Wyckoff spring on a chart
Start with the range, not the spring. You need a clear floor and ceiling after a fall. Next, watch for a bar that trades under the floor. Then check the close: back inside is a spring candidate, while below the floor is a breakdown.
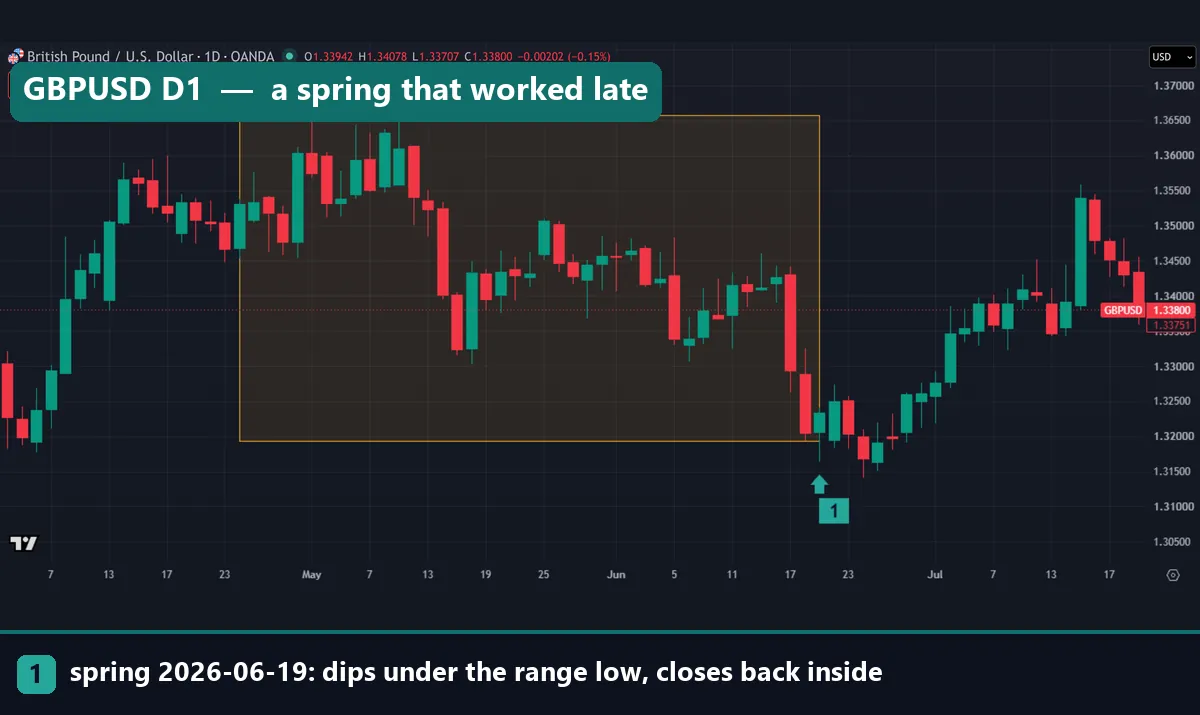
GBPUSD daily shows a spring that worked, but not neatly. The range ran from 1.31929 to 1.36578, about 465 pips tall. On 19 June 2026 a small green bar wicked under the floor and closed at 1.32335, marker 1. A few days later, price dipped below that bar’s own low. Only then did the rally come, and by mid-July the pair traded above 1.35.
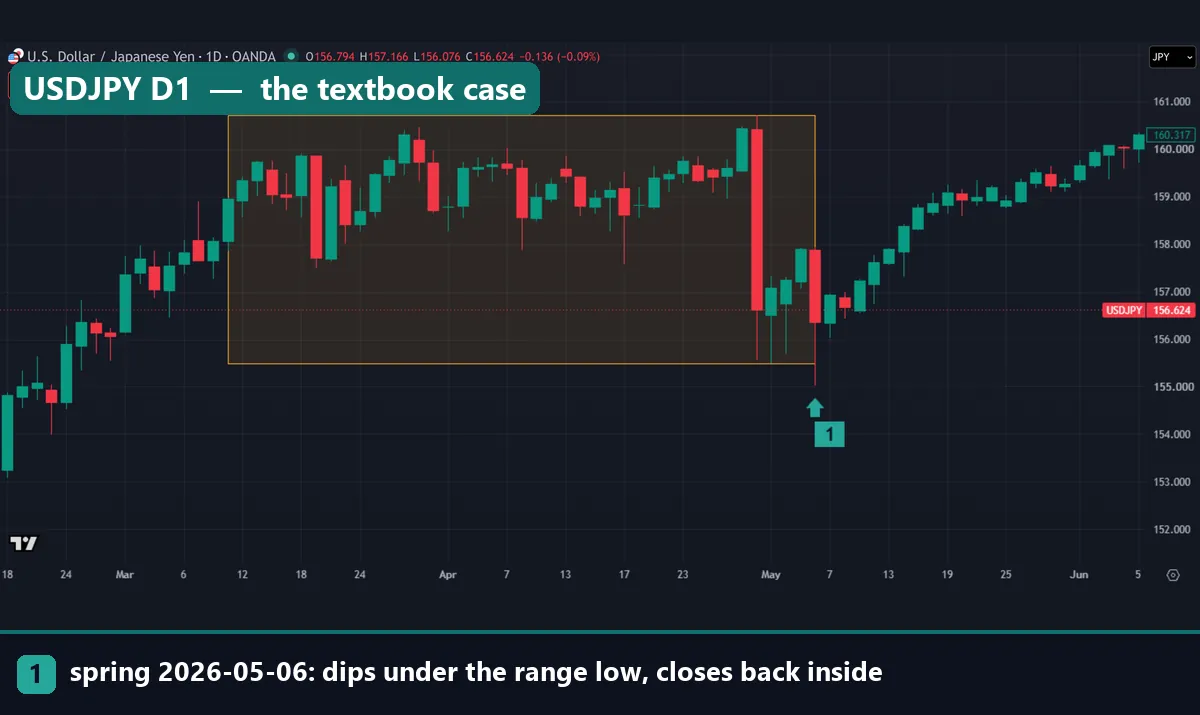
USDJPY daily is closer to the textbook. The range ran from 155.488 to 160.726 for about two months. On 6 May 2026 the bar wicked well under the floor and closed at 156.37, back inside. From there the pair climbed with few pauses, and the last bar shown, in early June, closed at 160.317.
This chart also holds an unmarked upthrust. On 29 April a bar poked above 160.464, the prior 40-bar high, and closed back under it at 160.45. Eight bars later the close was 157.226, so that one went the expected way.
Worked example: the USDJPY spring in numbers
The 6 May spring, step by step:
- Range: 160.726 – 155.488 = 5.238, or about 524 pips.
- Spring bar: it traded under 155.488, then closed at 156.37.
- Close inside: 156.37 – 155.488 = 0.882, or 88.2 pips, about a sixth of the range height.
- Eight bars later: the close was 158.858, which is 248.8 pips above the spring close.
Now the same sums for all six springs in our charts. “Inside by” is how far the spring closed above the floor.
| Chart | Spring | Floor | Spring close | Inside by | Close 8 bars later | Change |
|---|---|---|---|---|---|---|
| USDJPY D1 | 6 May 2026 | 155.488 | 156.37 | 88.2 pips | 158.858 | +248.8 pips |
| GBPUSD D1 | 19 Jun 2026 | 1.31929 | 1.32335 | 40.6 pips | 1.32758 | +42.3 pips |
| XAUUSD D1 | 8 Jun 2026 | 4,311.93 | 4,330.065 | 18.1 dollars | 4,208.995 | -121.1 dollars |
| EURUSD D1 | 17 Jun 2026 | 1.14997 | 1.1502 | 2.3 pips | 1.14242 | -77.8 pips |
| AUDUSD D1 | 9 Jun 2026 | 0.70244 | 0.70277 | 3.3 pips | 0.70138 | -13.9 pips |
| EURAUD D1 | 12 Oct 2026 | 1.6028 | 1.60295 | 1.5 pips | 1.59786 | -50.9 pips |
Both springs that closed well back inside went on to work. All four that closed right at the floor failed. Six charts prove nothing, and we did not test a “close well inside” filter. Still, it is the first rule we would test next.
What 1,363 daily events did next
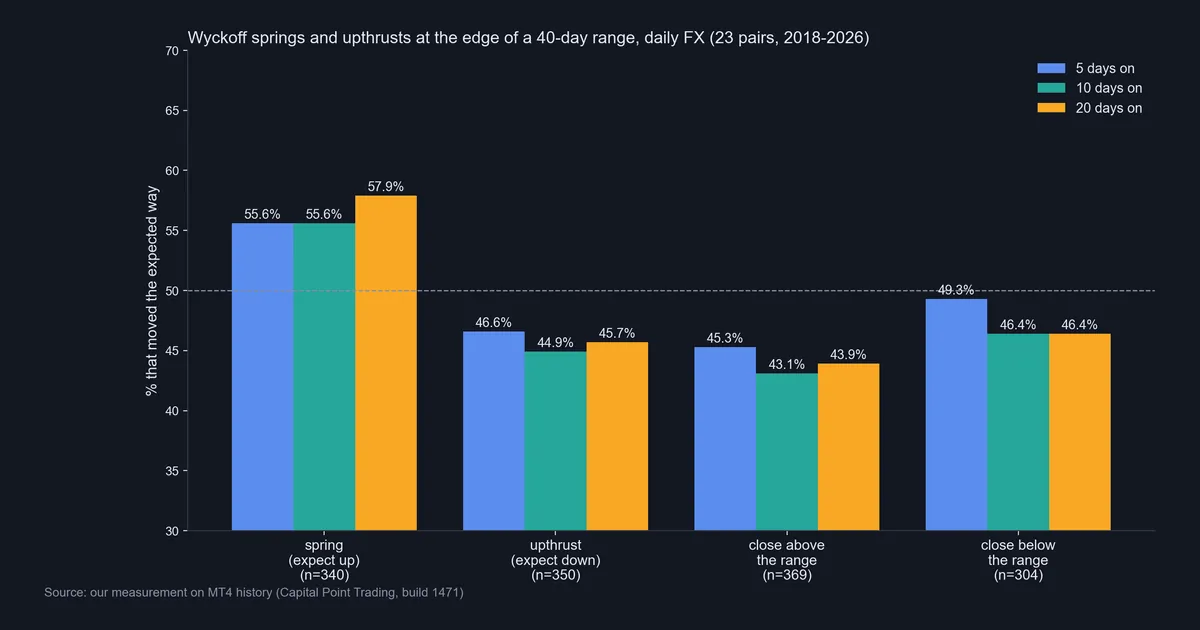
The chart above sums up the daily test. Springs went the expected way, up, 55.6% of the time after 5 days, 55.6% after 10 days and 57.9% after 20 days. An ordinary day, read as a long, rose about 52% of the time over the same spans (51.6%, 51.9% and 52.1%). So springs leaned up, but only mildly.
The size of the move tells the same story. After 10 days the median spring stood 0.24 ATR higher, against 0.07 ATR for an ordinary day. After 20 days the gap was 0.46 against 0.11 ATR.
Upthrusts did the opposite of the textbook. Only 44.9% stood lower after 10 days. Clean closes outside the range also tended to reverse: closes above it kept rising only 43.1% of the time after 10 days, and closes below it kept falling only 46.4% of the time.
The hourly test found nothing. Across 140 hourly springs, 51.4% went up after 5 and after 10 bars, against a base of about 51%.
A spring that failed: gold in June 2026
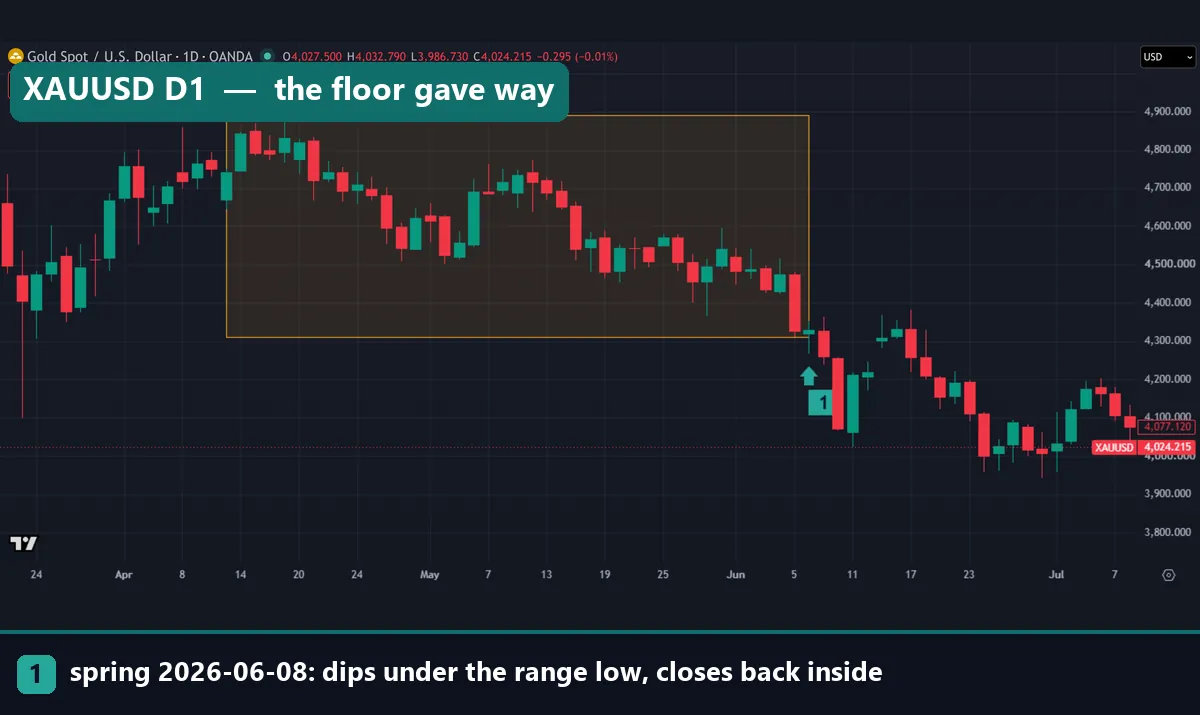
Gold daily shows how a spring can look right and still fail. The range ran from 4,311.93 to 4,891.54, about 580 dollars tall. On 8 June 2026 a small bar wicked under the floor and closed at 4,330.065, marker 1. Within days, two red bars took gold below 4,100. Eight bars after the spring the close was 4,208.995, and by late June gold traded under 4,000.
Download the complete indicator database
Put these concepts on your charts. One email unlocks the full library of 1,380+ indicators with compiled MT4 and MT5 files, plus my TradingView scripts. No paywall, no spam, unsubscribe any time.
Get free access to my indicator database
One email unlocks 1,380+ free MT4, MT5 and TradingView indicators — the complete library. No single-tool download; you get the whole database.
Where it fails
The edge is small. At 10 days, springs beat the base rate by under four points: 55.6% against 51.9%. With 340 cases over eight years and 23 pairs, part of that gap could be luck. Our note on backtest sample size explains why.
It vanished on the hourly chart. Hourly springs went up 51.4% of the time, about the same as any hour. If the spring has an edge in forex, our version found it only on daily bars.
Upthrusts and breaks went the wrong way. Selling every upthrust, or buying every close above the range, put a trader on the wrong side more often than not in our sample. That fits the tutorial’s warning about repeated upthrusts.
We left out volume. Wyckoff judged a spring by its volume. Spot forex has no central volume feed, and MT4 shows tick volume only, so our test reads price alone. A version with volume might score differently.
The phases get their names after the fact. While a range is still open, a spring and the start of a breakdown look the same. The EURUSD, gold, AUDUSD and EURAUD charts in this guide all show a spring that turned into a breakdown.
The rules decide the sample. A 60-bar range or a looser sideways filter would find other springs and other numbers. Treat any Wyckoff statistic, ours included, as a product of its rules.
Two more failed springs: AUDUSD and EURAUD
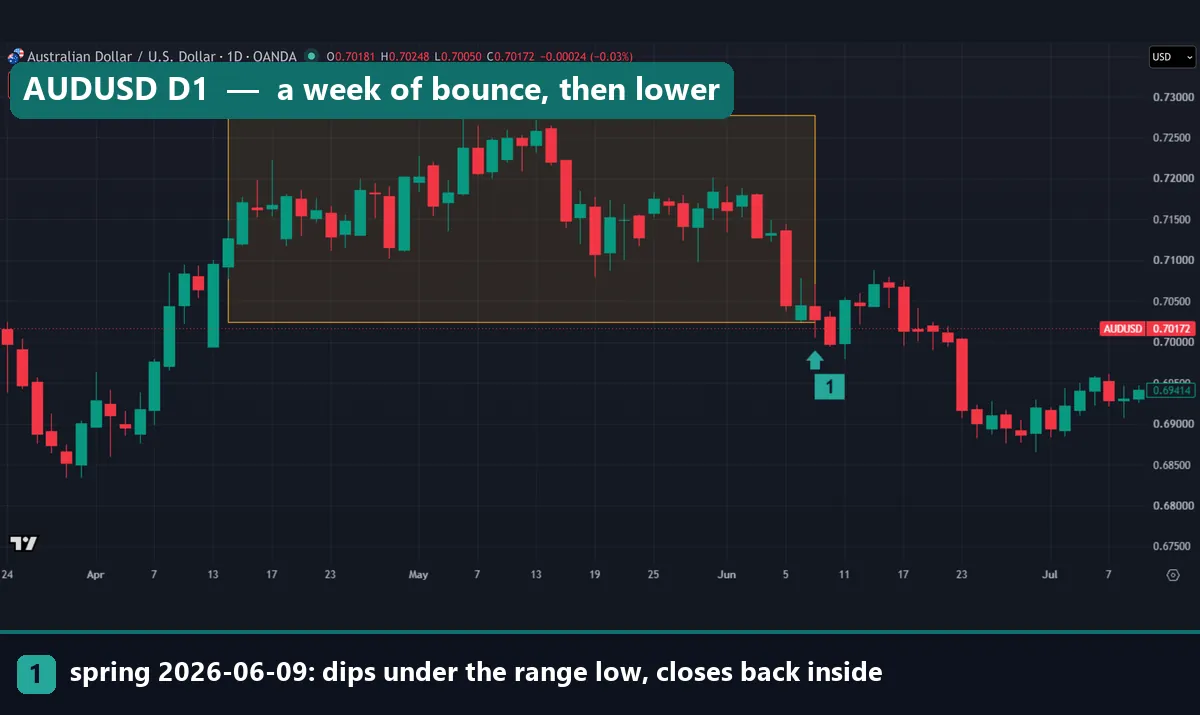
AUDUSD daily held up for a while. The range ran from 0.70244 to 0.72777. On 9 June 2026 the bar dipped under the floor and closed at 0.70277, only 3.3 pips inside, marker 1. Price bounced toward 0.7070 over the next week. Then a long red bar on 23 June broke the floor for good, and the pair spent late June near 0.6900.
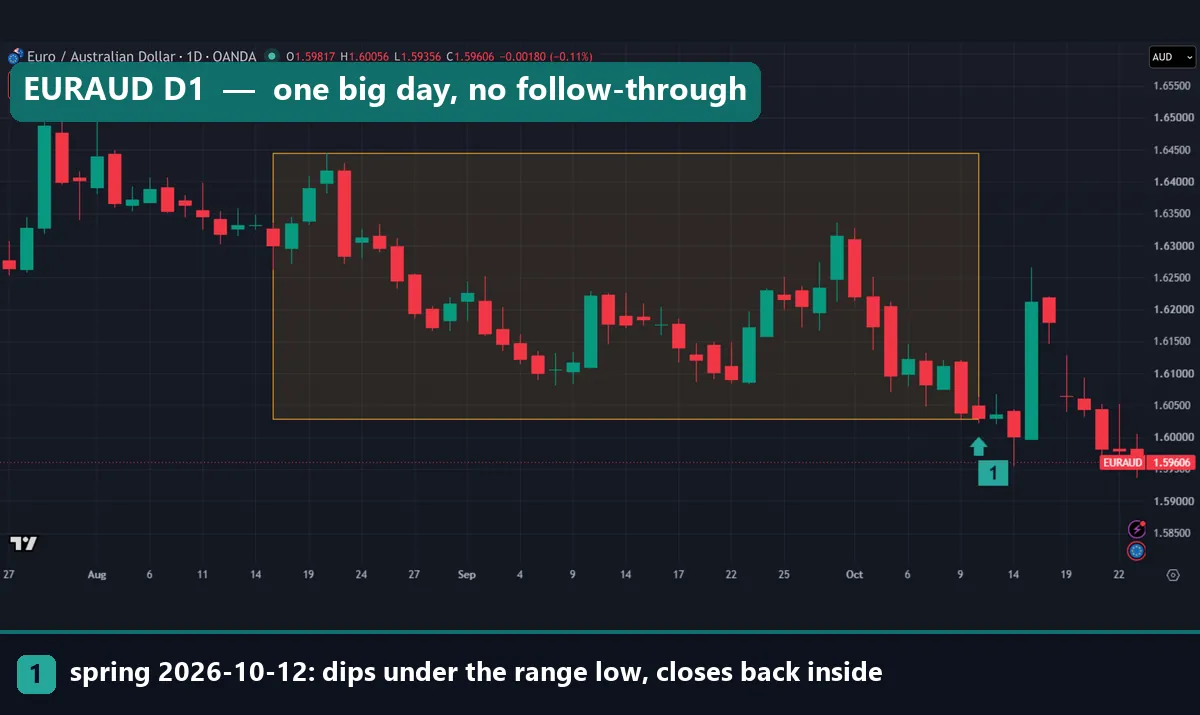
EURAUD daily is the most recent case. The range ran from 1.6028 to 1.64452. On 12 October 2026 the bar closed at 1.60295, just 1.5 pips inside the floor, marker 1. Three bars later a long green bar lifted the pair above 1.62. It looked like the sign of strength the schematic wants, but it did not hold. Eight bars after the spring the close was 1.59786, 50.9 pips under the spring close.
Our scan also flagged an earlier spring on 5 October, which closed at 1.60961. Its close eight bars later, 1.62116, fell on that big green day, so it scored as a success. One day decided both verdicts, which is why we check 5, 10 and 20 bars.
Four common Wyckoff accumulation mistakes
- Calling any dip under a low a spring. A spring needs a range first: a sideways base after a fall. Our rule asked for a 40-bar range no taller than 6 ATR. Without that, a dip under a low is just a lower low. Our support and resistance guide shows how to mark the floor.
- Trusting a close one pip inside. In our six charts, every spring that closed right at the floor failed. A bar that falls hard and closes on the line has not reversed. It has paused.
- Sizing as if the spring low will hold. GBPUSD traded under its spring bar’s low before it rallied. Set the stop and size before entry so a hit costs a fixed slice of the account, as our guide to risk per trade shows.
- Assuming the upthrust mirrors the spring. In our data it did not, since upthrusts went up more often than down. Test each side on its own before you trade it.
Where to go next
The spring has cousins in other schools. A liquidity sweep is the same poke through a low, and our page on liquidity grab vs liquidity sweep separates the two terms. The turtle soup strategy fades a failed break of a 20-bar low, close to our rule.
Our PO3 guide tests ICT’s version, which squeezes the Wyckoff cycle into one candle. Zone traders may prefer the supply and demand strategy. Also, since clean breaks of the range mostly reversed in our test, mean reversion trading is worth a read.
The two tutorials linked above cover the nine buying tests and point and figure counts, which this guide leaves out.
FAQ: Wyckoff accumulation questions
What is Wyckoff accumulation in simple terms?
It is a sideways range after a fall, in which Wyckoff believed large buyers were quietly taking positions. In theory, it ends when price leaves the range upward.
What is a spring in Wyckoff?
A spring is a dip under the range floor that closes back inside, usually late in the range, in Phase C. Its job in the schematic is to shake out the last sellers before the markup.
What are the phases of Wyckoff accumulation?
There are five: A stops the downtrend, B builds the range, C tests supply with a spring, D shows demand in control, and E is the markup out of the range.
Does the Wyckoff spring work in forex?
On daily charts our mechanical spring went up 55.6% of the time after 10 days, against about 52% for any day: a mild lean. On hourly charts it showed no edge.
What is the difference between accumulation and distribution?
Accumulation forms after a fall and should, in the schematic, break up; its key test is the spring. Distribution forms after a rise and should break down; its key test is the upthrust.
Is Wyckoff accumulation the same as the accumulation/distribution indicator?
No. The accumulation/distribution indicator is a running total built from price and volume by a fixed formula, while Wyckoff accumulation is a way of reading a price range and its events.
Which timeframe is best for Wyckoff accumulation?
In our test only the daily chart showed any lean, while hourly springs scored 51.4%, no better than chance. We did not test weekly or 4-hour charts.
Can Wyckoff accumulation tell me where price will go?
Not on its own. In our sample it tilted the odds a little after daily springs and not at all after upthrusts or hourly springs. Treat it as one input with a defined exit and a fixed risk, and remember that results are not guaranteed; past performance is not indicative of future results.
Last updated: 23 October 2026.

About the author
Written by Dominic Walsh, a Forex trader and MT4/MT5 indicator, Expert Advisor and script developer. Every tool on forexmt4systems.com is tested on live charts before release and ships with ready-to-use compiled MT4 (.ex4) and MT5 (.ex5) files. Learn more about the trader and developer behind this site.
How we build, test and correct every tool: Editorial & Testing Policy. Trading carries risk; see the disclaimer.