
A supply and demand strategy trades the price areas where a fast move started, on the idea that unfilled orders still wait there. This guide turns that idea into one fixed rule, tests it on 23 daily forex pairs, and shows what came out. The short answer: the rule finished ahead before costs, but by a modest margin, on small samples per pair, and only in sample.
What a supply and demand strategy is
A demand zone is a small pause in price, right before a strong rally. A supply zone is the same pause before a strong drop. The theory says big buyers or sellers could not fill their whole order in that pause. So when price comes back, the rest of the order may meet it and push price away again.
Spot forex has no central order book, so that story is hard to prove. Still, the chart shape is easy to define: a base of small candles, then one large departure candle. In short, the zone is the base, and the trade is the first return to it.
This page is the tested strategy. If you want the theory side, we cover how zones differ from plain levels in support and resistance vs supply and demand. We also compare zones with the ICT version in order block vs supply and demand. The classic economic meaning of the two words is on the supply and demand article on Wikipedia. Here we skip those comparisons and look at numbers.
How the zone rule works
Most zone traders draw by eye, so no two people draw the same box. We wrote the rule down first instead. Every size in the rule is a multiple of the 14-bar Average True Range, so the same rule fits EURUSD and GBPJPY alike. The ATR page at StockCharts ChartSchool explains how that value is built.
- Base: one to three small candles, each with
body <= 0.5 x ATR(14). - Departure: the next candle, with
body >= 1.5 x ATR(14). - Type: a bullish departure makes a demand zone; a bearish one makes a supply zone.
- Zone: from the lowest low to the highest high of the base candles.
The trade then works in R, where one R is the distance from entry to stop. For a demand zone, the entry is the top edge and the stop sits just under the bottom edge:
R = near edge - (far edge - 0.1 x ATR), and target = near edge + 2R.
A supply zone mirrors this. Because the target is 2R, a trade needs to reach target in more than one third of cases (33.3%) to break even. That simple sum is the bar the rule has to clear. Our guide to trading expectancy walks through the same maths.
How we tested the zone rule
We ran the rule on MetaTrader 4 history from the Capital Point Trading terminal, MetaTrader 4, build 1471. The set covers 23 forex pairs on the daily chart, from 12 June 2018 to 24 August 2026. That is 37,748 daily candles in total. We read the raw history files and applied the rule in code, so nobody drew a zone by hand.
For the charts in this article, we used the TradingView web chart with OANDA data. We took those shots on 7 October 2026. They show EURUSD, GBPUSD and USDJPY on the daily chart, plus XAUUSD and AUDUSD on the 1-hour chart. The boxes in each shot are zones found by the same written rule, not by eye.
Two limits apply to every number below. First, all results are before spread, swap and commission, because this history has no usable spread data. Second, we tested the rule once on the full sample. We did not hold back any years for an out-of-sample check. Our full method is on the editorial testing policy page.
Settings we used
Here is every input. Change one, and our numbers no longer apply.
| Input | Our value | What it does |
|---|---|---|
| ATR period | 14 bars | Sets the yardstick for every size below |
| Base candles | 1 to 3 | The pause that becomes the zone |
| Base body limit | 0.5 x ATR | Keeps the base quiet |
| Departure body | 1.5 x ATR or more | Demands a fast exit from the base |
| Return window | 60 bars | A zone untouched after 60 bars is dropped |
| Entry | Limit order at the near edge | Fills on the first return only |
| Stop | 0.1 x ATR beyond the far edge | Gives the far edge a small buffer |
| Target | 2R | Twice the risk from entry |
| Time exit | 30 bars | Closes trades that stall |
On MetaTrader, the ATR input comes from the standard iATR function, which the MQL5 iATR reference documents. On TradingView, the built-in ATR uses the same idea.
Reading supply and demand zones on a chart
A daily zone can take weeks to get its first touch, while a 1-hour zone can take hours. Either way, you only judge the zone at the touch.
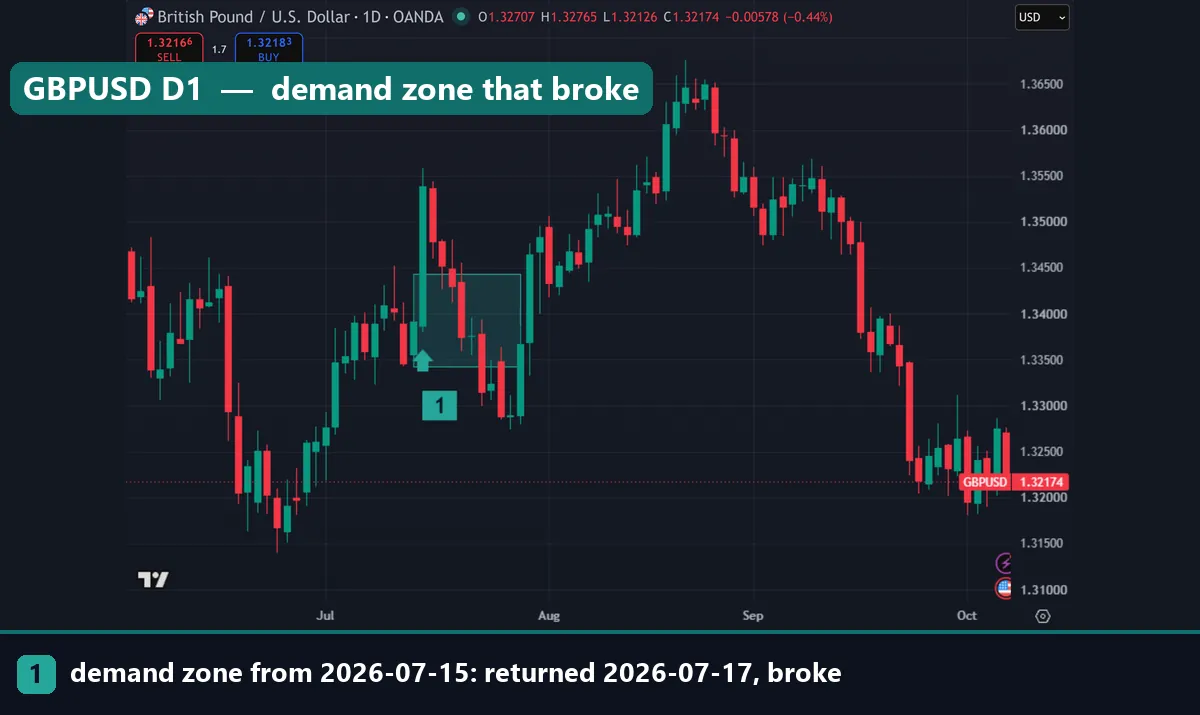
The GBPUSD daily chart below shows a demand zone that failed. The departure came on 15 July 2026, and the zone runs from 1.33424 to 1.34438. Price came back on 17 July. Then daily candles closed under the bottom edge, so the zone broke. That is the stop-out case, and it happens often.
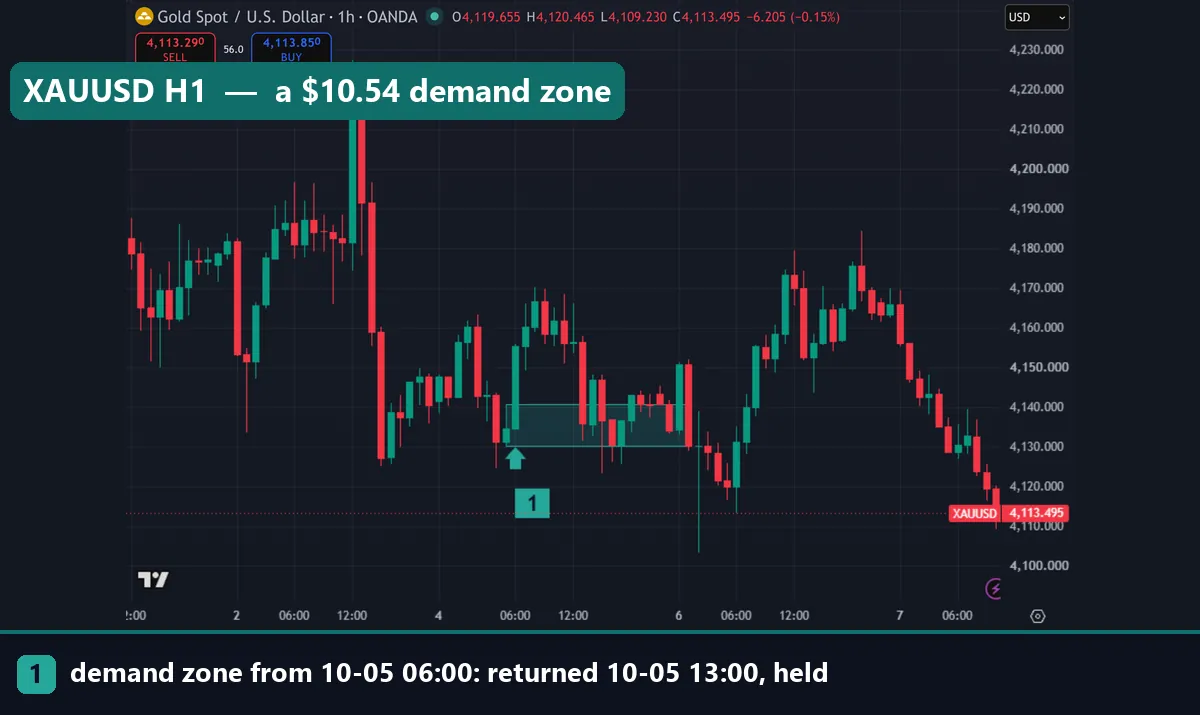
Next, the gold chart shows a short-term demand zone on the 1-hour chart. It formed at 06:00 UTC on 5 October 2026, from 4,130.40 to 4,140.94 dollars. So it was $10.54 tall. Price returned at 13:00 the same day, and the zone held. Note how long price stayed inside the box, though. A touch is not a clean bounce.
Worked example: a EURUSD daily supply zone
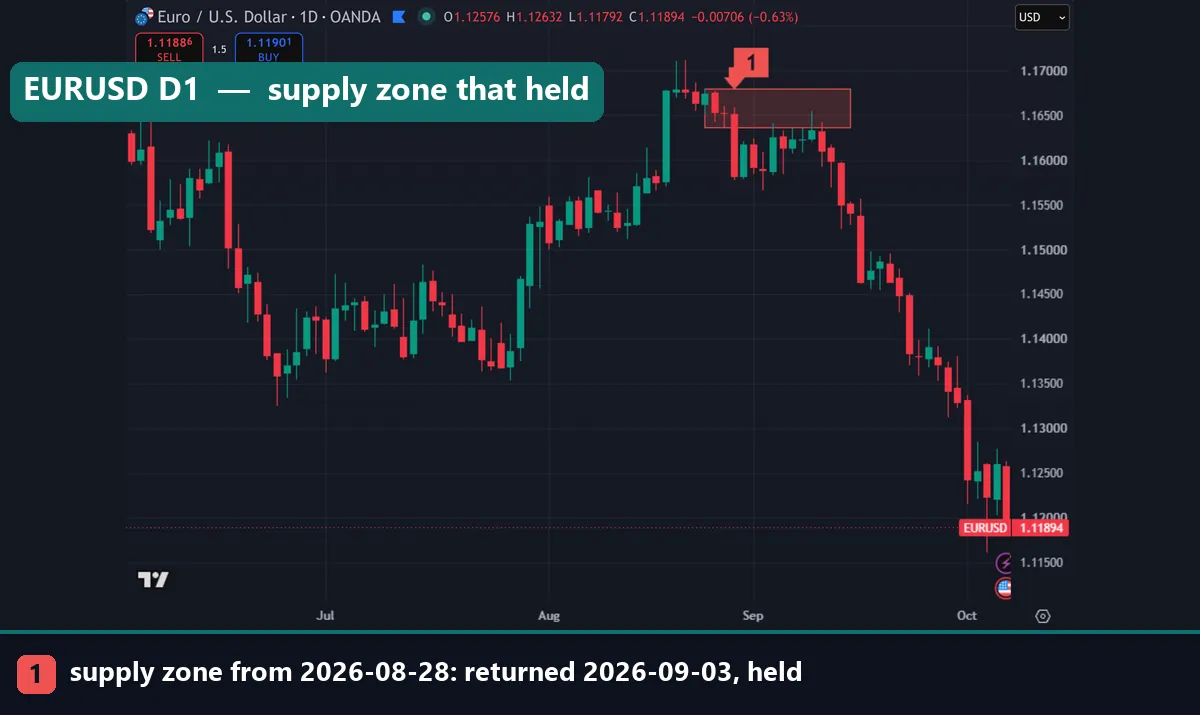
Go back to the first chart at the top. That red box is a supply zone on EURUSD daily. The bearish departure candle printed on 28 August 2026. The base candles before it span 1.16366 to 1.16798, so the zone is 43.2 pips tall.
Under our rule, the trade plan reads as follows:
- Place a sell limit at the near edge, 1.16366.
- Put the stop 0.1 ATR above the far edge, 1.16798. So the risk is 43.2 pips plus that buffer.
- Set the target at twice the risk below entry. That puts it at 1.15502 at the very least, and lower once the buffer is added.
- Close the trade after 30 bars if neither level is hit.
Price came back to the zone on 3 September 2026. After that touch, it moved away by more than one ATR before any close above the box, so by our label the zone held. The chart then shows daily closes below 1.15000 by mid-September.
Two honest notes, though. The chart does not show its ATR value, so the target is a minimum, not an exact price. Also, our MT4 history ends on 24 August 2026, so this zone sits outside the test set. It shows how the rule reads, not that it works.
What 399 trades showed
The rule found 486 zones on the 23 pairs. Price came back within 60 bars to 82.1% of them. Of those returns, 74.2% held and 25.6% broke, by our labels.
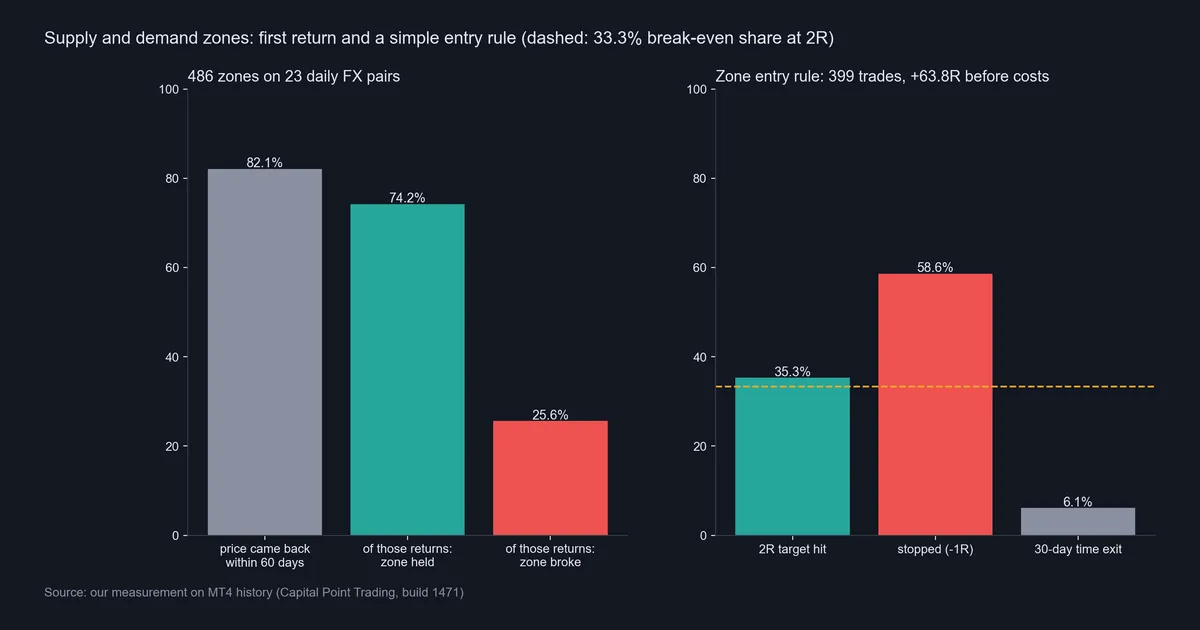
However, “held” only means a one-ATR move. A trade needs 2R. Out of 399 trades, 35.3% hit the 2R target and 58.6% hit the stop. The other 6.1% closed on the 30-bar time exit. Since 35.3% is only just above the 33.3% break-even line, the total came to +63.8R before costs. That works out to about 0.16R per trade.
Next, the per-pair chart shows how uneven that total is. Sixteen of 23 pairs finished positive. USDJPY led with +21.0R from 27 trades. AUDJPY was worst at -9.3R from 24 trades, with GBPUSD and GBPCAD at -7.0R each. GBPJPY ended flat after 27 trades.
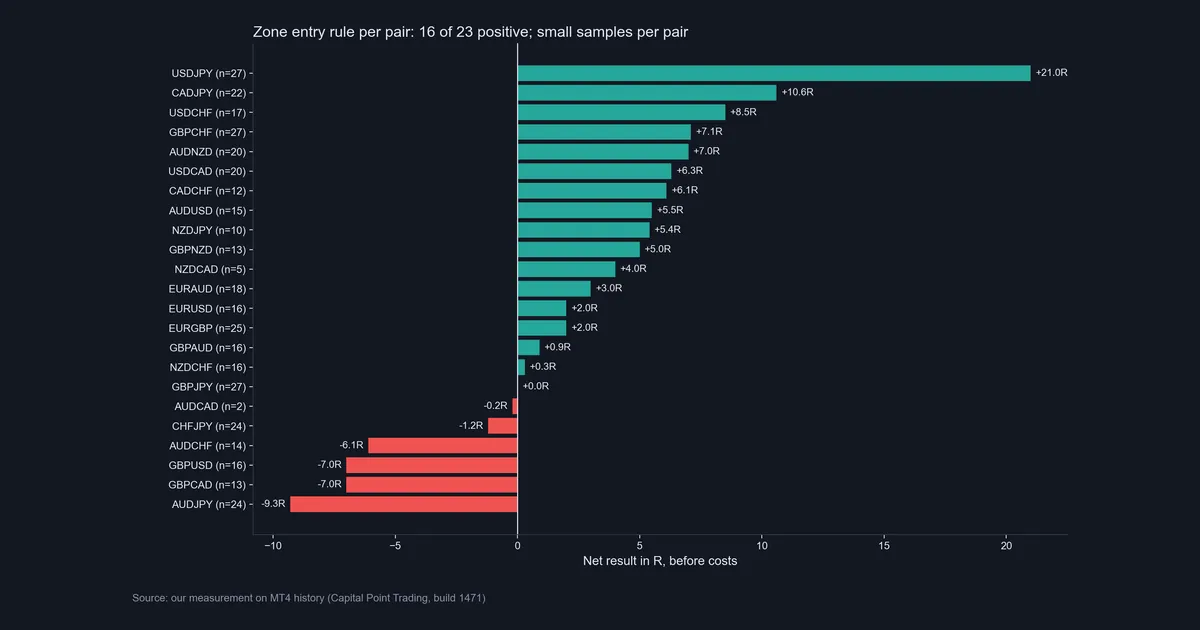
Also look at the sample sizes. Most pairs have 10 to 27 trades over eight years, and AUDCAD has only 2. One lucky run can swing a pair that small. Our note on backtest sample size explains why that matters.
In short, it is a modest, in-sample edge before costs, not proof.
Download the complete indicator database
Put these concepts on your charts. One email unlocks the full library of 1,380+ indicators with compiled MT4 and MT5 files, plus my TradingView scripts. No paywall, no spam, unsubscribe any time.
Get free access to my indicator database
One email unlocks 1,380+ free MT4, MT5 and TradingView indicators — the complete library. No single-tool download; you get the whole database.
Where it fails
First, costs. On a daily zone 43 pips tall, the spread is a small slice of the risk. On a 1-hour zone a few pips tall, it can be a large slice. Since our result is only 0.16R per trade before costs, spread and swap on small zones could erase it. Our guide to backtesting transaction costs shows how to add them back.
Second, at 58.6% stopped, long losing streaks are normal. Many traders quit before the average shows up.
Third, the rule has no trend filter. It takes demand zones in a falling market and supply zones in a rising one. We did not split the results by trend, so we cannot say how much those counter-trend zones cost. Seven pairs still lost money, and AUDJPY lost 9.3R.
Fourth, we tested once on all the data. We did not run a walk-forward analysis or keep years aside. So we cannot tell how much of the +63.8R is luck in this exact sample. If you tune the ATR multiples until the total looks better, you add curve fitting on top.
Finally, we measured a chart shape, not bank orders. Nobody can see those on spot forex.
Two more zones: one held, one broke
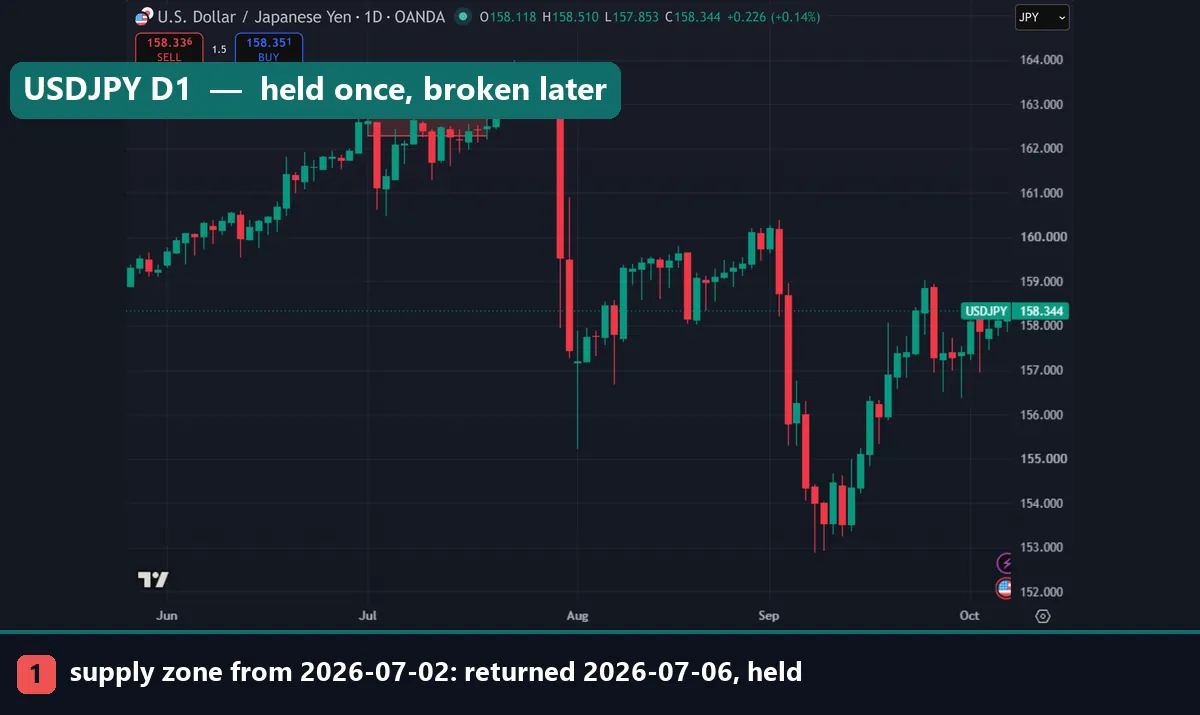
The USDJPY daily chart shows a supply zone from 2 July 2026, between 162.294 and 162.84. Price returned on 6 July and the zone held by our label: price dropped one ATR before any close above the box. Then look further right. Later in July, price climbed through the zone and traded near 164.000 before a sharp fall. So a zone that held once can still fail later. Our rule only trades the first return, for that reason.
The AUDUSD 1-hour chart shows the opposite case. Its demand zone formed at 11:00 UTC on 6 October 2026. It spans 0.69672 to 0.69709, so it is only 3.7 pips tall. Price came back at 04:00 on 7 October, and the zone broke. A box that thin gives the stop almost no room. Normal hourly noise, plus the spread, can clear it in one candle.
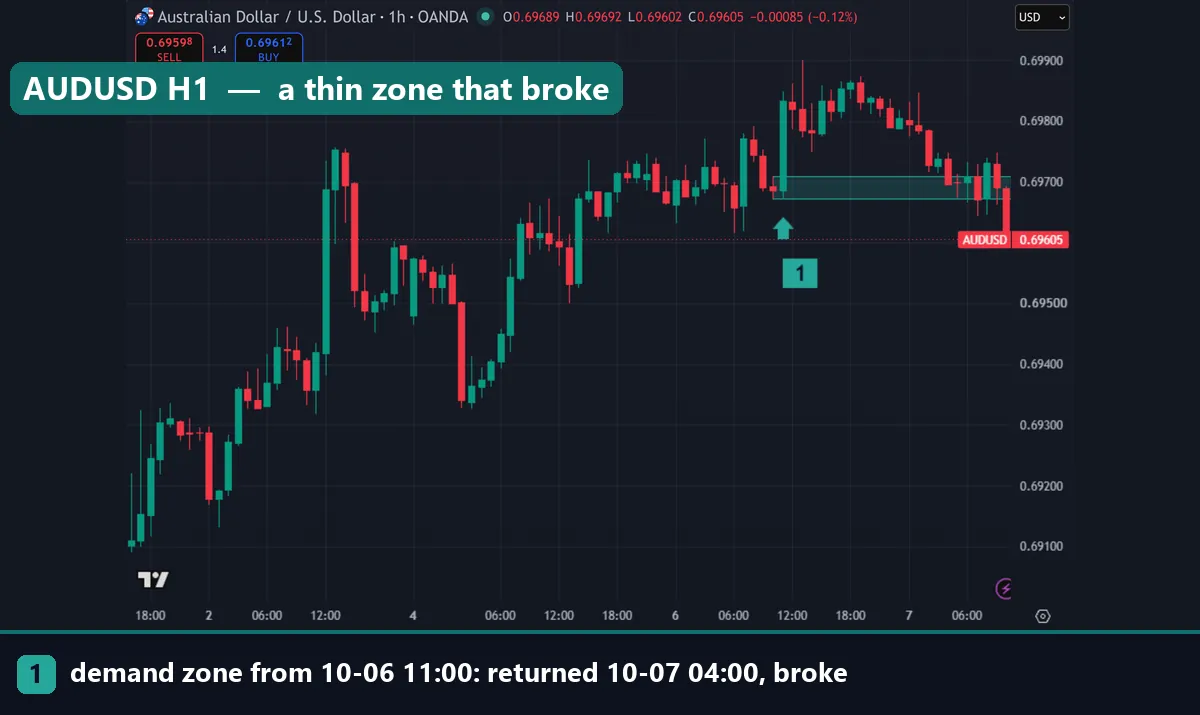
Both came from the same rule. It finds zones the same way every time, but it cannot tell which will hold.
Common mistakes with supply and demand zones
We see the same four errors again and again, and each one changes the test without the trader noticing.
- Drawing zones after the move. It is easy to spot a perfect zone once you know price bounced. Instead, mark zones with a fixed rule, before the touch.
- Trading the second and third touch. Each touch uses up some of the orders the theory relies on. As the USDJPY chart shows, a zone that held once can break later.
- Stops in the middle of the zone. Price often trades deep into the box before it turns. A stop past the far edge, with an ATR buffer, sizes the risk to the zone. Our page on using ATR as a stop loss covers the buffer idea.
- Fixed lot size on every zone. A 43-pip zone and a 4-pip zone carry very different risk per lot. Instead, size each trade from the stop distance, as our position sizing guide explains.
How to test the rule yourself
You do not need code to check a few zones. Pick one daily pair, scroll back a year, and mark every base and departure that fits the table. Record the edges before you look at what came next.
After that, score each touch as target, stop or time exit. Add up the results in R, and then take off a fair spread for each trade. If you would rather use MetaTrader, our MT4 Strategy Tester guide shows how to run a rule over history. Keep at least the last year aside, and test on it only once at the end.
If you want zones drawn for you, our supply and demand zones indicator page has a free MT4 and MT5 tool. Its logic differs from our test rule, so check its zones first.
Where to go next
For the theory behind returns to a zone, read our page on RTM trading. Then, to judge trends before you take a zone, see market structure in forex. For the stop and target maths, the risk reward ratio explained page fits well with the 2R target used here. And if ATR is new to you, start with what ATR is in trading.
Outside our site, the ATR help page in the TradingView docs shows the built-in study we used on the charts.
FAQ: supply and demand strategy
Does a supply and demand strategy work in forex?
Our fixed zone rule finished at +63.8R over 399 daily trades on 23 pairs, before costs. That is a modest, in-sample result, and we did not test it out of sample.
How often does price come back to a zone?
In our daily test, price returned to 82.1% of the 486 zones within 60 bars. Of those returns, 74.2% held by our one-ATR label.
Why did the strategy lose so many trades?
The stop was hit on 58.6% of trades, because a 2R target needs a long move. It still finished ahead since 35.3% of trades reached 2R.
Which pairs did best in the test?
USDJPY led at +21.0R, then CADJPY at +10.6R and USDCHF at +8.5R. However, each pair had 27 trades or fewer, so the ranking may not repeat.
Which timeframe did you test?
We tested the daily chart from June 2018 to August 2026. The 1-hour charts in this guide are examples only and were not part of the test.
Where should the stop loss go?
Our rule puts it 0.1 ATR beyond the far edge of the zone. A stop inside the box gets hit by normal moves into the zone.
Are spreads included in the results?
No. Every figure is before spread, swap and commission, because our history files hold no usable spread data. Costs will cut the result, more so on small zones.
Can I trade this rule without changes?
You can copy it from the settings table, but test it on your own broker data and costs first. Treat our numbers as one in-sample test: results are not guaranteed; past performance is not indicative of future results.
Last updated: 7 October 2026.

About the author
Written by Dominic Walsh, a Forex trader and MT4/MT5 indicator, Expert Advisor and script developer. Every tool on forexmt4systems.com is tested on live charts before release and ships with ready-to-use compiled MT4 (.ex4) and MT5 (.ex5) files. Learn more about the trader and developer behind this site.
How we build, test and correct every tool: Editorial & Testing Policy. Trading carries risk; see the disclaimer.