
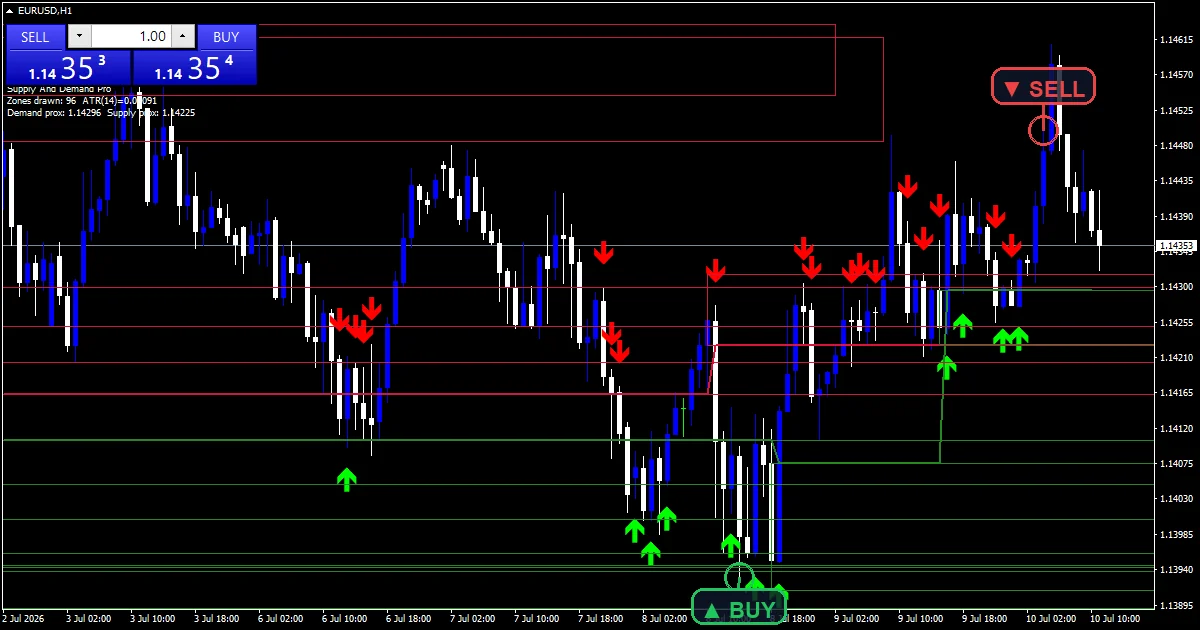
The supply and demand zones indicator finds the candle that launched an impulse move and boxes it. Green outlines mark demand under price, and red outlines mark supply above it. Lime and red arrows tag the impulse bar itself. Zone traders get a mechanical version of a pattern they usually draw by hand.
This build ships as a compiled .ex4 for MT4 and .ex5 for MT5; the screenshots below come from EURUSD H1.
| Platforms | MT4 (.ex4) + MT5 (.ex5) |
|---|---|
| Chart window | Main price chart |
| Plots | 2: Demand Impulse, Supply Impulse |
| Alerts | popup, push notification, email, sound |
| Inputs | 14 |
The plots and where they sit
Demand Impulse is the lime up arrow, code 233. It sits under the bullish bar that broke away from a small base. Supply Impulse is the red down arrow, code 234, and it sits above the bearish version of the same pattern.
The rectangles come from chart objects. Each one wraps the high and low of the base candle, the quiet bar right before the impulse. InpExtendBars pushes the right edge forward so the box reaches live price. InpDemandColor and InpSupplyColor set the outlines, and the boxes stay unfilled so the candles show through.
A comment block sits in the top-left corner. It reports the symbol, the timeframe, the current volatility reading and how many zones of each side the pass drew.
- Demand Impulse: arrow, lime, width 2, arrow code 233
- Supply Impulse: arrow, red, width 2, arrow code 234
From price to plot
Wilder volatility from scratch
The code builds true range on every bar. It takes the widest of the bar range and the two gaps measured against the previous close. Then it seeds an average at the oldest usable bar and recurses forward toward the live candle. InpAtrPeriod sets the length of that average.
Impulse and base tests
Two body tests run together. The impulse bar needs a body wider than InpImpulseMult times the average range on its own bar. The bar immediately before it needs a body smaller than InpBaseMaxMult times the average range on that bar. Only the pairing counts, so a big candle on its own never creates a zone.
Drawing and capping the zones
The scan runs newest first and skips the live bar. A bullish impulse creates a demand box from the high and low of the base candle. A bearish impulse creates the supply version above price. InpMaxZones caps how many boxes each side may keep, while InpLookback limits how far back the scan travels.
Reading the plots
Zones matter more than arrows. The arrow tells you where a move started, and the box tells you the price band that may hold on a return. Fresh boxes carry more weight than boxes price has already sliced through.
Look for the reaction, not the touch. Price entering a green demand box gives you a location and nothing more. Wait for a rejection candle or a structure shift inside the band. Many traders then park stops just beyond the far edge of the rectangle.
Alert channels in this build: popup, push notification, email and sound, one message per closed bar.
Alerts go out by popup, mobile push, email and sound. EnableAlerts gates the block, and EnablePopup, EnablePush, EnableEmail and EnableSound pick the channels. The check runs once per closed bar, and only when that bar formed a fresh zone.
Every Supply and Demand Zones Indicator input
Core settings
| Setting | What it does | Default |
|---|---|---|
InpAtrPeriod |
ATR period (impulse scale). InpAtrPeriod (default 14) sets the Wilder average length that scales both body tests. A shorter value tracks recent volatility more closely. | 14 |
InpImpulseMult |
Impulse body > mult * ATR. InpImpulseMult (default 1.4) is the body-to-range ratio a bar must beat to rank as an impulse. Raise it and only the strongest moves survive. | 1.4 |
InpBaseMaxMult |
Base body < mult * ATR. InpBaseMaxMult (default 0.7) caps how large the base candle body may be. A smaller value demands a tighter base. | 0.7 |
InpLookback |
Bars to scan for zones. InpLookback (default 500) limits how many bars back the zone scan runs, which keeps a long history from slowing the chart. | 500 |
InpMaxZones |
Max zones drawn per side. InpMaxZones (default 14) caps the number of rectangles drawn per side, so the newest zones stay visible. | 14 |
InpExtendBars |
Extend zone right by N bars. InpExtendBars (default 30) stretches each rectangle that many bars to the right of the live candle. | 30 |
Display settings
| Setting | What it does | Default |
|---|---|---|
InpDemandColor |
Demand zone outline. | forest green |
InpSupplyColor |
Supply zone outline. | crimson |
Alert settings
| Setting | What it does | Default |
|---|---|---|
EnableAlerts |
Master alert switch. | on |
EnablePopup |
Popup alert. | on |
EnablePush |
Push notification. | on |
EnableEmail |
Email alert. | off |
EnableSound |
Sound alert. | on |
SoundFile |
Sound file. | alert.wav |

Where it earns its keep
EURUSD on H1 carries the screenshot. Impulse and base pairs form on every liquid symbol, so majors, gold and index CFDs all suit the method. Lower timeframes produce far more zones, and the zone cap then does most of the filtering for you. H1 and H4 give a count that a trader can actually watch through a session.
Its blind spots
Zones do not vanish once price uses them. The build keeps drawing a rectangle while its base bar stays inside the lookback window. A box that price already ran through offers very little. Judge each one by how price behaved right after the impulse.
Volatility averages react slowly to a change of regime. After a quiet stretch the threshold sits low, so ordinary bars pass the impulse test. After a wild week the opposite happens and the chart empties out. Adjust InpImpulseMult rather than waiting for the average to catch up.
Rectangles rebuild on each new bar. The code clears its own objects and redraws the set, so visible zones change as older bars leave the window. Note the price levels you care about somewhere else.
One base candle makes a thin case for a zone. A single quiet bar before a spike often means nothing more than a pause in the order flow. Combine the box with a higher-timeframe level that you drew yourself.
Copy the compiled Supply and Demand Zones Indicator file into your MQL4/Indicators folder, and the MT5 build into MQL5/Indicators, then restart the terminal and drag it onto a chart. The step-by-step guide with screenshots is at how to install MT4 and MT5 indicators.
Related on forexmt4systems.com: Supply and Demand Strategy.
Download the Supply and Demand Zones Indicator for MT4 and MT5
The zip holds the compiled Supply and Demand Zones Indicator build for MT4 and MT5, plus a short README. Compiled files only, no source. Enter your email below and the download link arrives in your inbox.
Download this indicator free
Enter your email and the file is yours. You also get the full MT4 and MT5 library.
FAQ
Why does InpBaseMaxMult reject a base candle I can see?
The test weighs the base body against the volatility reading on that bar, never against the impulse. A candle with long wicks but a wide body therefore fails, even though it looks like a pause. Raise InpBaseMaxMult a little when the chart stays empty on your own symbol.
Where exactly does the Demand Impulse arrow sit on the bar?
Half a volatility unit below the low of the impulse candle. The code takes the current average true range, halves it, then drops the marker that far under the bar. The gap keeps the lime arrow clear of the wick on both quiet and wild charts.
How many supply and demand zones can the chart hold at once?
InpMaxZones caps each side, and the shipped value allows fourteen demand boxes and fourteen supply boxes. InpLookback also limits the scan to five hundred bars. Older zones simply drop off as that window moves forward. Lower both numbers when the chart starts to feel crowded.
Can the popup alert fire twice on the same closed bar?
It cannot. The dispatcher stores the time of the last alerted bar and compares it on every pass. One closed bar therefore produces one message at most. EnableAlerts arms the block, and the code only calls it when the newest closed bar has formed a fresh zone.
Are results guaranteed?
No. Trading involves risk. Results are not guaranteed; past performance is not indicative of future results. Use the Supply and Demand Zones Indicator as one input. Always backtest before trading live.
Category: this is part of our Trend collection. Browse more Trend for MetaTrader, or explore every MT4 indicator and MT5 indicator on the site.
External references
- For background on this concept, see Walk forward optimization on Wikipedia.
- For broader market context, see USD at Investopedia.

About the author
Written by Dominic Walsh, a Forex trader and MT4/MT5 indicator, Expert Advisor and script developer. Every tool on forexmt4systems.com is tested on live charts before release and ships with ready-to-use compiled MT4 (.ex4) and MT5 (.ex5) files. Learn more about the trader and developer behind this site.
How we build, test and correct every tool: Editorial & Testing Policy. Trading carries risk; see the disclaimer.