
A liquidity sweep is a candle that trades through a prior high or low, where stop orders tend to rest, then closes back on the other side of that level. ICT traders read it as a sign that big orders filled against those stops and that price will turn. This guide defines the pattern, separates it from a breakout and answers one question with data: what did price do next? Across 12,707 daily sweeps on 23 forex pairs, the next day went the expected way about half the time.
What a liquidity sweep is
In this context, liquidity means resting orders. Buy stops sit above a clear swing high: stop losses from short sellers and entries from breakout buyers. Sell stops sit below a clear swing low. Our guide to buy-side and sell-side liquidity maps where these pools form, and equal highs and equal lows are the classic spots where stops pile up.
A sweep happens when price runs into a pool and backs off. The wick pokes through the level, but the candle closes back inside. We call a sweep of a high a bear sweep, and a sweep of a low a bull sweep.
Traders also call it a stop run, a raid or a grab. Some split a grab from a sweep by how far price runs past the level, as our page on liquidity grab vs liquidity sweep explains. In this guide, one thing defines a sweep: the close.
How a sweep works: stops, fills and the close
A stop order sits idle until price reaches the stop price. Then it becomes a market order and fills at the next available price. The stop order definition on the SEC’s Investor.gov says so, and warns that fills can land away from the stop in a fast market.
So a level with many stops behind it releases a burst of market orders at once. If no fresh buyers follow a run above a high, sellers absorb the burst and price drops back, leaving a wick.
ICT adds a motive: large traders push price into the pool on purpose to fill their own orders. That is the claim behind stop hunting in forex. A chart shows the wick, but not who caused it.
As a rule, with N bars setting the level, it looks like this:
level      = highest high of the previous N bars
bear sweep = high above level, close below level
up break   = high above level, close at or above level
bull sweep and down break mirror this at the lowest low
The idea predates ICT. Linda Raschke and Larry Connors faded failed breakouts with their Turtle Soup strategy.
Liquidity sweep vs breakout: one close decides
A sweep and a breakout start the same way: price trades through the level. Only the close tells them apart. Close back inside, and it is a sweep. Close beyond, and it is a break, with the stops it ran now fuelling the move.
So while the candle is still running, acting on the wick means guessing the close. Many traders also want a market structure shift after the sweep. That is a separate rule with its own record, so we tested the bare pattern that every version starts with.
How we tested
We ran the count on Capital Point Trading price history from MetaTrader 4, build 1471, read straight from the terminal’s history files. The daily set covers 23 forex pairs from 12 June 2018 to 24 August 2026: AUDCAD, AUDCHF, AUDJPY, AUDNZD, AUDUSD, CADCHF, CADJPY, CHFJPY, EURAUD, EURGBP, EURUSD, GBPAUD, GBPCAD, GBPCHF, GBPJPY, GBPNZD, GBPUSD, NZDCAD, NZDCHF, NZDJPY, USDCAD, USDCHF and USDJPY. The hourly set covers EURUSD, GBPUSD and USDJPY from 22 December 2025, plus gold (XAUUSD) from 1 July 2025, all to August 2026.
For daily bars, the level is the previous day’s high or low. For hourly bars, it is the extreme of the previous 24 bars, which iHighest in the MQL4 documentation finds in MT4 and ta.highest in the Pine Script reference returns on TradingView. A bar that took out both sides counted as neither.
Then we checked the close 1, 3 and 5 bars later on D1, and 1, 4 and 8 bars later on H1. A sweep “followed” if that close sat further in the expected direction than the sweep bar’s close. We scored clean breaks the same way. All figures are before spread, swap and commission.
The chart images come from the TradingView web chart with OANDA data, captured on 15 October 2026, with markers set by the same rule. Our editorial testing policy explains how we pick data and report results.
The parameters that define a liquidity sweep
Each setting below changes what you count.
| Parameter | Our D1 test | Our H1 test | What it changes |
|---|---|---|---|
| Lookback for the level | 1 bar (the previous day) | 24 bars (the last 24 hours) | Longer lookbacks give fewer levels |
| Trigger | High above the level | Same | No minimum distance |
| Confirmation | Close back inside | Same | Separates a sweep from a break |
| Bars that take both sides | Skipped | Skipped | No double signals |
| Horizon | 1, 3 and 5 bars | 1, 4 and 8 bars | Short horizons carry more noise |
| Measure | Later close vs sweep close | Same | Direction only, not a full trade |
| Costs | Not deducted | Not deducted | Spread and swap come off real results |
Note that a sweep by a fraction of a pip counts, since we set no minimum distance.
Reading a liquidity sweep on a chart
On every chart here, the yellow dashed line is the swept level and the numbered marker sits on the sweep bar: red for bear sweeps, teal for bull sweeps.
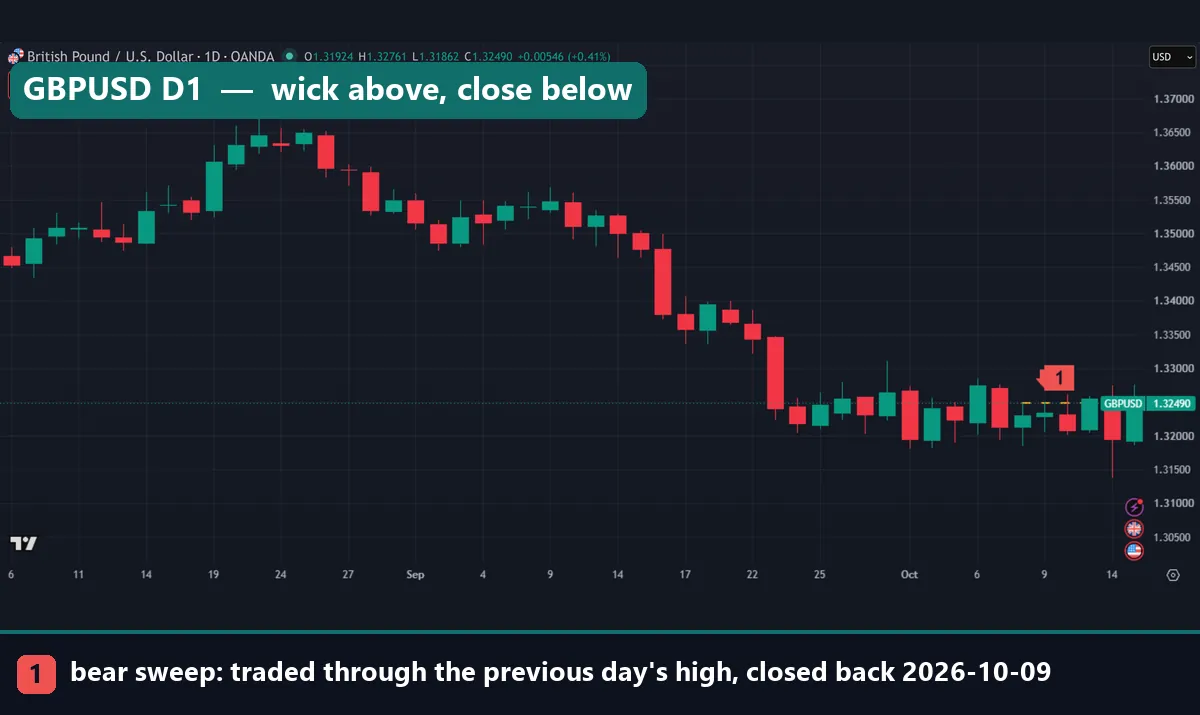
On GBPUSD daily, the 9 October candle reached above the 8 October high of 1.32488 and closed at 1.32340: a wick above the line, a body below it. Yet the two candles before it were bull sweeps of the prior day’s low. Three days gave three sweeps in two directions.
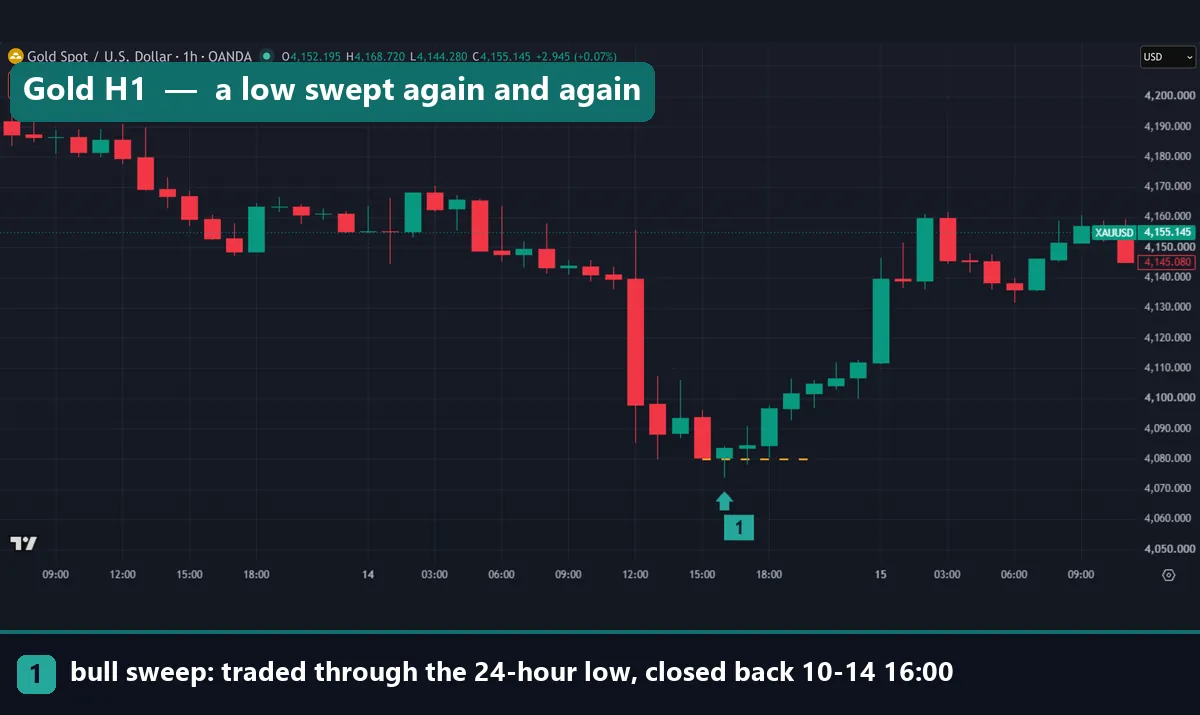
Gold shows lows swept over and over. On 14 October the 15:00 UTC bar dipped four cents under the 13:00 low of 4,079.73 and closed back above it. The 16:00 bar then ran through the new 4,079.69 low and closed at 4,083.62. Three hours later gold closed at 4,101.75. But an 11:00 UTC sweep on the same chart failed: it closed at 4,139.465, and three hours later gold closed at 4,093.56.
Worked example: EURUSD on 9 October 2026
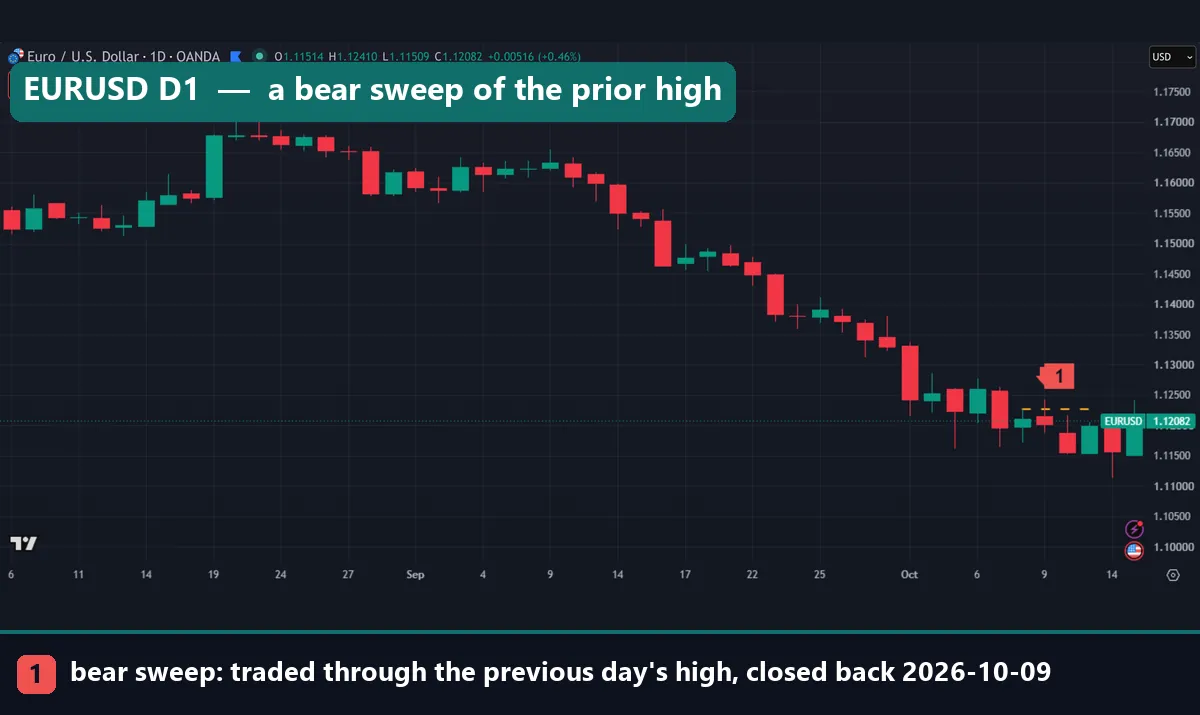
Here is one sweep on the EURUSD daily chart at the top of this page.
Step 1, mark the level. The EURUSD high on 8 October was 1.12269.
Step 2, wait for the close. On 9 October price traded above 1.12269, then closed at 1.12015, about 25 pips under the level. That close makes it a bear sweep.
Step 3, check what followed. Three sessions later, on 14 October, EURUSD closed at 1.11566, roughly 45 pips below the sweep close.
Now take GBPUSD on the same day. It swept the 1.32488 high and closed at 1.32340. Three sessions later it closed at 1.31944, so the three-bar score says it followed. But on 13 October, two sessions after the sweep, it closed at 1.32550, above the swept high. A stop just above the level would have gone before the drop. The horizon and the stop decide the score, so we fixed our horizons before counting.
What 12,707 daily sweeps did next
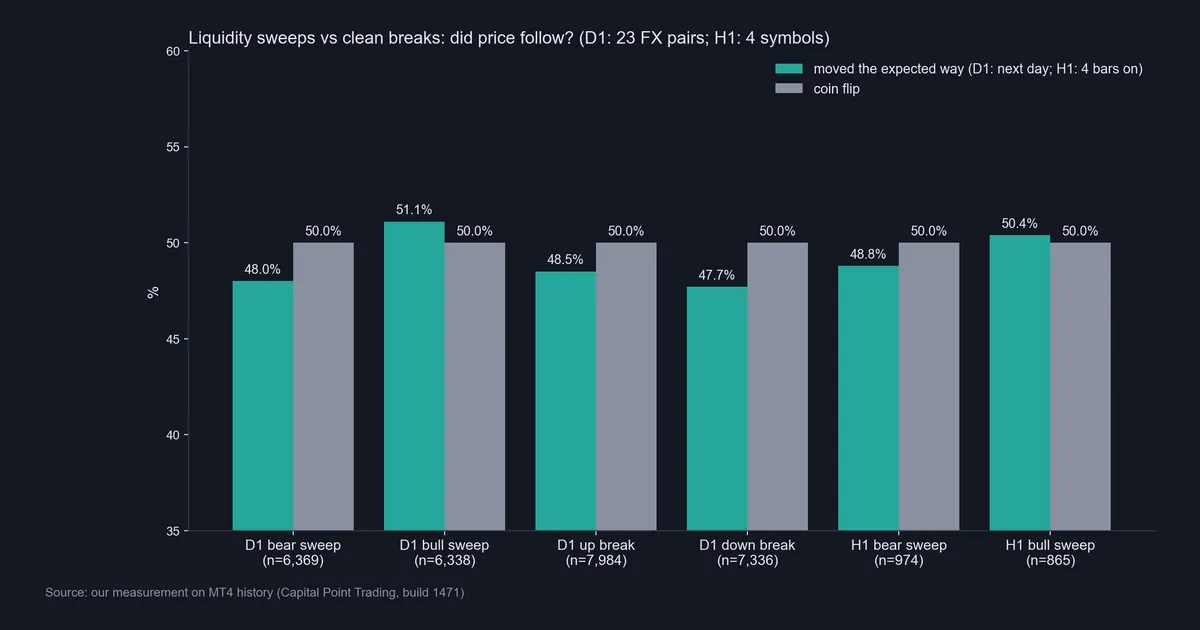
Across the 23 pairs, price swept the previous day’s high 6,369 times and the low 6,338 times. An event that turns up on a typical pair several times a month is not a rare tell.
After a bear sweep, the next day closed lower 48.0% of the time. After a bull sweep, it closed higher 51.1% of the time. Yet 51.0% of all days in the sample closed higher anyway, so a random day closed lower about 49% of the time. That means a bear sweep did slightly worse than a random day, and a bull sweep matched one. Three and five days out, bear sweeps stayed at 48.0% and 48.2%, and bull sweeps at 51.2% and 50.3%.
Clean breaks did no better. After a close above the previous day’s high, the next day closed higher 48.5% of the time. After a close below the low, it closed lower 47.7% of the time. Neither reading of the level told us where the next day would go.
Hourly sweeps: a small tilt that fades
On H1 we found 974 bear sweeps and 865 bull sweeps of the 24-hour range. One bar later, 52.5% and 53.2% had moved the expected way. Four bars later it was 48.8% and 50.4%, and eight bars later 49.9% and 49.8%. With fewer than a thousand events per side, a one-hour tilt that small sits close to chance, and it would have to beat the spread inside a single hour.
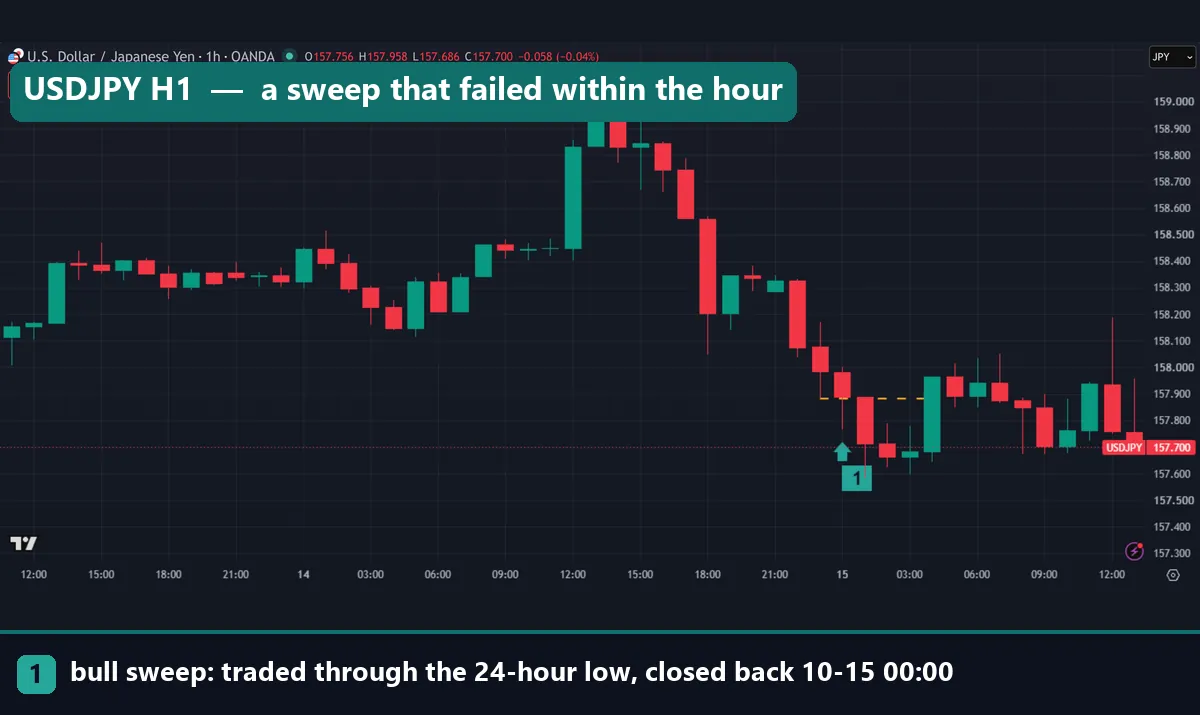
The USDJPY chart shows how fast a sweep can turn. At 00:00 UTC on 15 October the bar dipped under the 24-hour low of 157.881 and closed at 157.889. The next bar fell through the line, and three hours later the close was 157.683, about 21 pips lower.
Download the complete indicator database
Put these concepts on your charts. One email unlocks the full library of 1,380+ indicators with compiled MT4 and MT5 files, plus my TradingView scripts. No paywall, no spam, unsubscribe any time.
Get free access to my indicator database
One email unlocks 1,380+ free MT4, MT5 and TradingView indicators — the complete library. No single-tool download; you get the whole database.
Where it fails
In our data, the bare liquidity sweep carried no directional edge on daily or hourly bars. The method has other limits too.
You cannot see the stops. Spot forex has no central order book. Even the BIS Triennial Survey of FX markets has to collect its turnover data from dealers. The liquidity on your chart is a guess about where stops usually sit.
The level depends on your broker. OANDA’s daily candles on TradingView run from 17:00 to 17:00 New York time. A broker with another server day draws a different previous-day high.
The signal arrives late. A sweep exists only at the close, and by then much of the turn has happened inside the candle.
Costs come off every result. Our figures ignore spread, swap and commission, and a coin-flip pattern has nothing left over to pay them.
We tested direction, not a full plan. A tight stop and a far target could change the payoff. Filters such as session timing need their own tests.
Two sweeps that went the wrong way
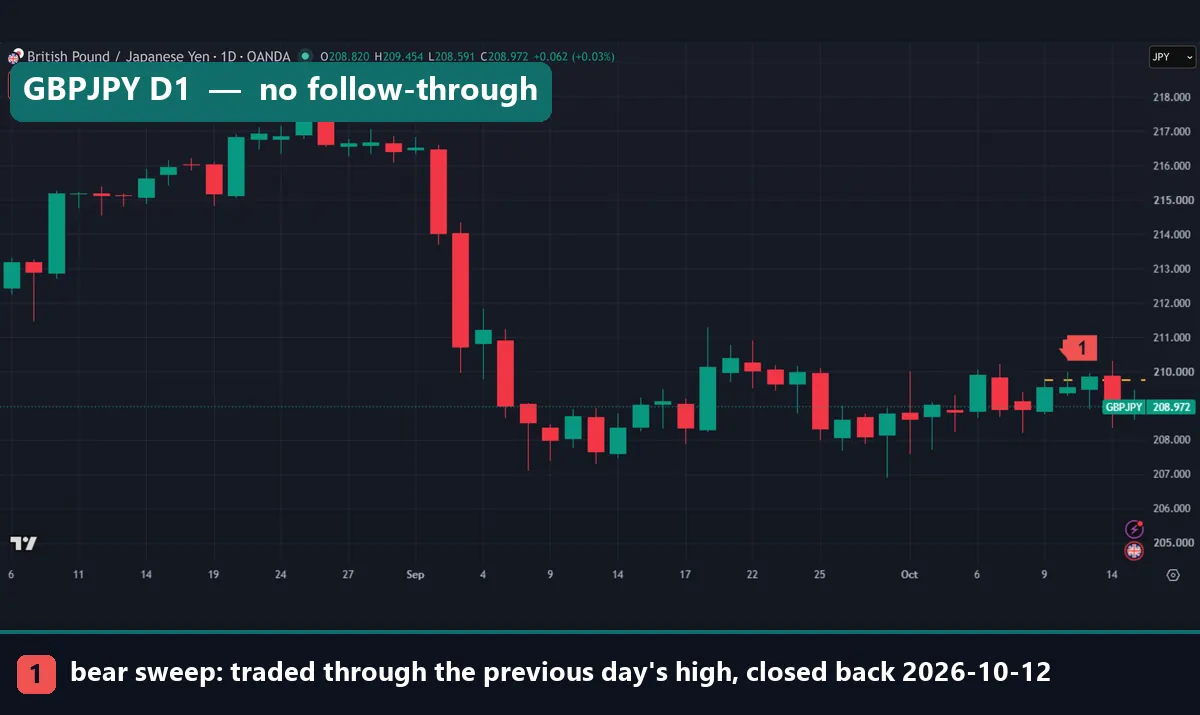
On GBPJPY daily, the 12 October candle swept the 9 October high of 209.747 and closed at 209.538. The next day swept the 12 October low of 209.294 instead and closed at 209.846, back above the line. A seller at the first sweep’s close was behind within one session.
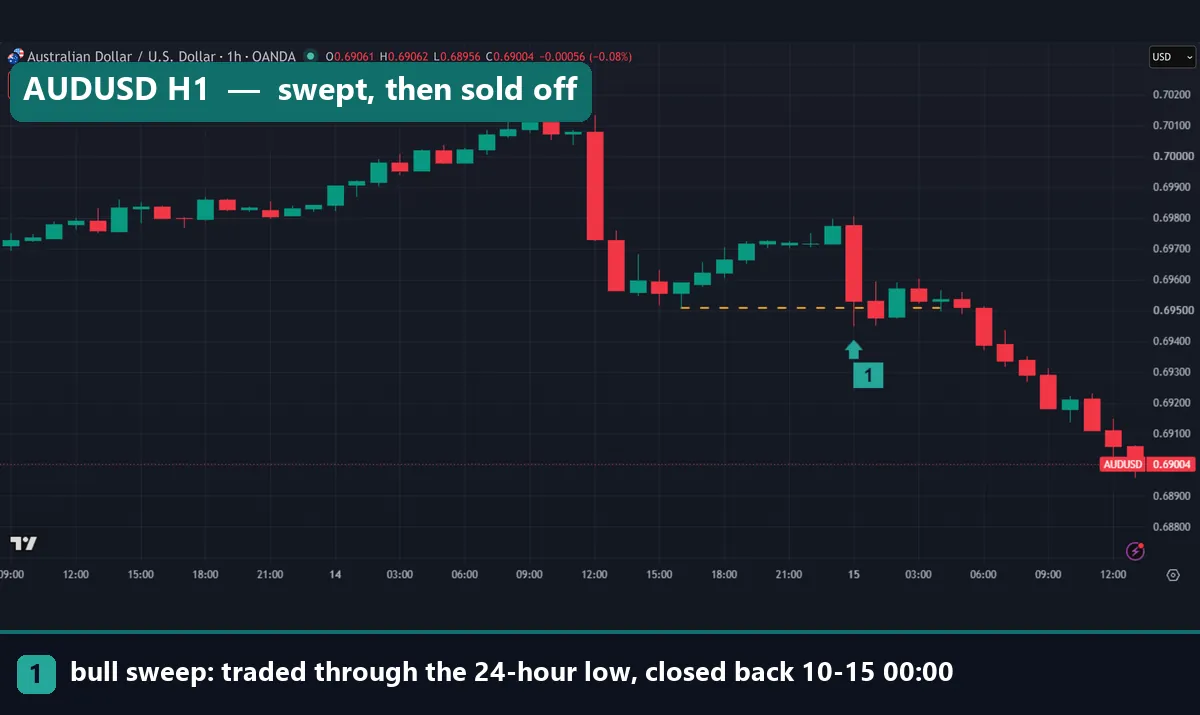
AUDUSD hourly shows the mirror case. At 00:00 UTC on 15 October, price dipped under the 24-hour low of 0.69507 and closed at 0.69531. Three hours later it closed at 0.69530, flat, and then it slid. A second bull sweep at 10:00 UTC, of the 0.69179 low, closed at 0.69212, yet the chart’s last price was 0.69004.
Common liquidity sweep mistakes
1. Calling the sweep before the close. The last EURUSD candle at the top had not closed when we captured it. It had traded up to 1.12410, above the 14 October high of 1.12114, and sat at 1.12082. Until 17:00 New York, nobody knows if it ends as a sweep or a break.
2. Treating every sweep as a reversal signal. Our daily data held 12,707 sweeps, and they did no better than a coin. A sweep marks a place, not a forecast.
3. Parking the stop a hair beyond the wick. On the gold chart, the 16:00 bar ran through the 15:00 low, itself the wick of an earlier sweep. A stop parked just under the 15:00 wick went in the very next sweep. Size stops from volatility instead, as our guide to ATR stop-loss distance shows.
4. Learning from hand-picked charts. Our EURUSD example worked, and most examples online work, because people share winners. Count every sweep under a fixed rule first, as our note on backtest sample size explains.
Where to go next
Start with our guide to liquidity in trading, then read about the draw on liquidity, the target ICT traders expect price to reach after a sweep. Our liquidity sweep example walks through another chart, and the Judas swing applies the same idea to the session open. Before testing a sweep rule, read our notes on backtesting transaction costs.
FAQ: liquidity sweep questions
What is a liquidity sweep in trading?
It is a candle that trades through a prior high or low, where stops likely rest, and then closes back on the other side. The close separates it from a breakout.
Is a liquidity sweep the same as a stop hunt?
They describe the same price action. “Stop hunt” adds a motive: that someone pushed price there on purpose. A chart shows the sweep but not the intent, and in spot forex no one can see the stops.
What is the difference between a liquidity sweep and a liquidity grab?
Many traders treat the words as synonyms. Others use “grab” for a quick wick and “sweep” for a deeper run. Either way, the close back inside is the part you can measure.
Which timeframe works best for liquidity sweeps?
Neither daily nor hourly bars stood out in our test. Daily sweeps on 23 pairs and hourly sweeps on four symbols both went the expected way about half the time. Higher timeframes just give fewer events.
Does a liquidity sweep mean price will reverse?
No. After 6,369 sweeps of the previous day’s high, the next day closed lower 48.0% of the time. After 6,338 sweeps of the low, it closed higher 51.1% of the time, against 51.0% for all days.
How do I mark the previous day’s high correctly?
Use your broker’s daily candle and know when it starts. OANDA’s daily candles on TradingView run from 17:00 to 17:00 New York time. Another server day means a different high.
Can an indicator find liquidity sweeps automatically?
Yes. The rule is mechanical: compare the bar’s high with the highest high of the prior bars, then check the close. But finding sweeps is not the same as predicting what follows.
Can you trade liquidity sweeps profitably?
Our test found no edge in the bare pattern before costs. A full plan with filters, stops and targets might differ, but test it on fresh data with spread and swap included. Even then, results are not guaranteed; past performance is not indicative of future results.
Last updated: 15 October 2026.

About the author
Written by Dominic Walsh, a Forex trader and MT4/MT5 indicator, Expert Advisor and script developer. Every tool on forexmt4systems.com is tested on live charts before release and ships with ready-to-use compiled MT4 (.ex4) and MT5 (.ex5) files. Learn more about the trader and developer behind this site.
How we build, test and correct every tool: Editorial & Testing Policy. Trading carries risk; see the disclaimer.