
A judas swing is a false move at the London open that runs one way, takes out nearby stops, and then reverses into the real move of the day. The term comes from ICT teaching, and many traders treat it as a daily event. This guide settles three things: what the pattern is, how to mark it on a chart, and how often it actually happened. We measured 2,161 trading days across nine symbols. The first London hour went against the rest of the day on about 40% of them. So the judas swing is real, but it is the exception, not the rule.
What a judas swing is
The name borrows from the story of betrayal. Price “betrays” early traders by moving one way, and then it turns. In ICT language, the London session opens, price pushes through the Asian session high or low, and that push grabs the stop orders resting there. After that, price reverses and trends the other way for the rest of the day.
So the pattern has three parts. First, there is a quiet range during the Asian session. Next, a fast move breaks one side of that range near the London open. Finally, price reverses and closes the day on the opposite side. Our glossary of ICT terms files it next to stop runs and liquidity grabs, because the idea is the same. The early break exists to fill large orders, not to start a trend.
The judas swing is also one leg of a bigger ICT idea. In the accumulation, manipulation and distribution model, the Asian range is accumulation, the false break is manipulation, and the real move is distribution. ICT traders often call the same daily shape “power of three”.
That said, the judas swing is a story about intent. A chart only shows that price broke a level and came back. The “trap” is a motive the data cannot confirm.
How the judas swing works, step by step
There is no formula here, only a sequence of time windows and price levels. Here is the logic most teachers use:
- Mark the Asian range. Take the high and low of the overnight session. Stops from earlier trades tend to cluster just beyond those two levels.
- Wait for the London open. Volume rises sharply when London desks start trading. The Bank of England’s London Foreign Exchange Joint Standing Committee page describes how central the London market is for FX.
- Watch for the break. Price trades through the Asian high or low. That move triggers stops and breakout orders.
- Look for the turn. Price returns inside the range, then breaks the opposite side.
- Judge the day. If the day closes on the far side, the early break was the “judas” leg.
The theory explains why the early move might fail. Resting stops act as fuel. A large buyer, for example, gets better fills if price first dips into a pool of sell stops. Our guide to liquidity in trading covers this order-flow side in more detail. Still, the same pool of stops can also push price further in the break direction. Then the early move is the real move, and no reversal comes.
How we tested the first London hour
We turned the idea into a rule that a computer can check. Then we ran it on MetaTrader 4 history from Capital Point Trading, MetaTrader 4, build 1471. The data was M15 bars for nine symbols: AUDCAD, AUDUSD, EURUSD, GBPUSD, NZDCAD, USDCAD, USDCHF, USDJPY and XAUUSD. The window ran from 2 June 2025 to 26 August 2026. Day counts differ by symbol, because the terminal held more history for some symbols than for others.
The rule had four parts:
- The first London hour is 07:00 to 07:59 UTC.
- The day runs from 07:00 to 20:59 UTC.
- “Against” means the first hour closed the opposite way to the whole London-to-New-York day.
- “Broke Asia” means the first hour traded beyond the Asian session high or low in its own direction.
Next, we drew the chart examples on the TradingView web chart with OANDA data, M15, on 9 October 2026. They show 8 October 2026 for six symbols. Every result is before spread, swap and commission. Our editorial testing policy explains how we pick data and why we publish weak results too.
One limit matters up front. This test checks direction only, so it says nothing about entries, stops or targets.
Judas swing settings we used
A judas swing has no inputs like an indicator does. Even so, every chart reading depends on a few choices. The table lists the ones we fixed, so you can copy them or change them.
| Parameter | Our value | Why it matters |
|---|---|---|
| Chart timeframe | M15 | Shows the first hour as four bars without too much noise. |
| Asian range on our charts | 21:00 to 07:00 UTC (22:00 for gold) | Sets the two levels that the early move has to break. |
| London open | 07:00 UTC | Fixed in UTC, so it shifts against London local time in winter. |
| First hour | 07:00 to 07:59 UTC | The window we judge as the possible false move. |
| Day window | 07:00 to 20:59 UTC | Covers London and New York, but not the next Asian session. |
| “Against” test | First-hour close vs day close | Direction only, so size of the move is ignored. |
Session hours vary between brokers and data feeds. Our forex market hours page and the forex time zone converter help you match these UTC times to your own chart clock. On TradingView, you can also draw session windows with code. The Pine Script sessions guide in the TradingView docs shows how session strings work.
Reading the judas swing on a chart
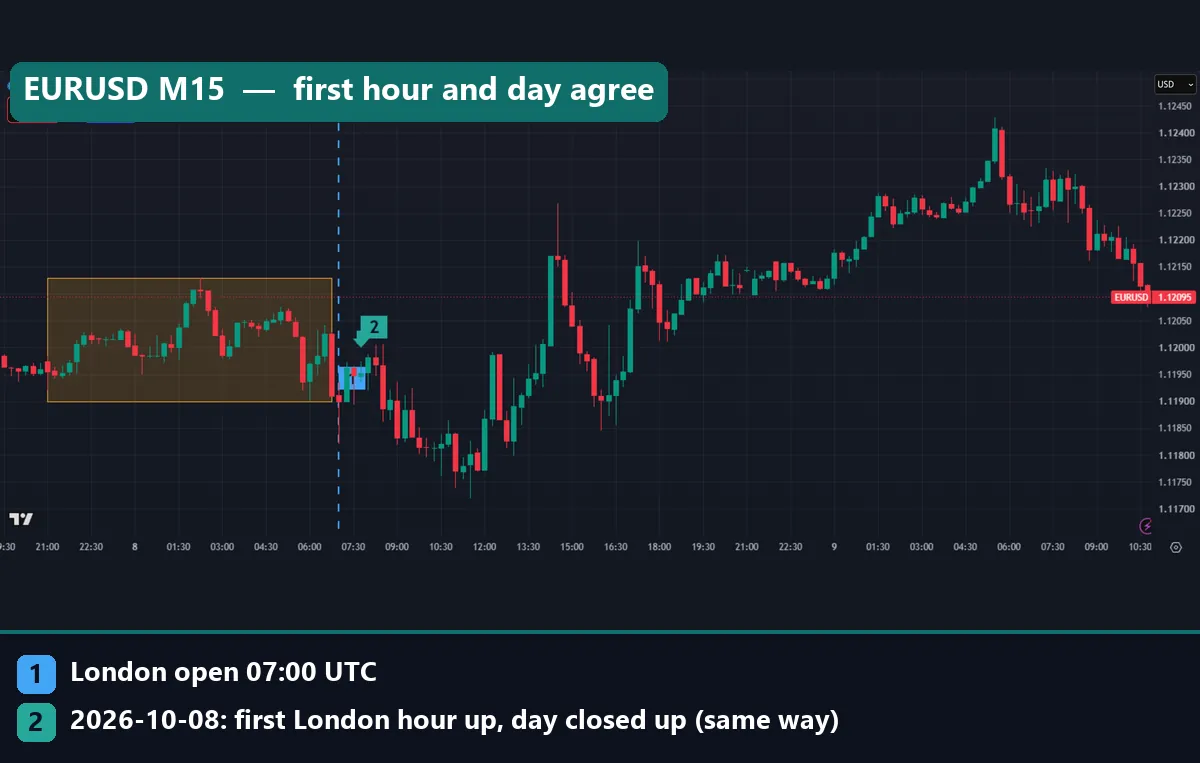
Each of our chart images uses the same three marks. The yellow box is the Asian range. The dashed blue line is the London open at 07:00 UTC. Marker 2 states what the first hour did and what the whole day did.
Start with GBPUSD on 8 October 2026. The Asian range ran from 1.31934 to 1.32225, about 29 pips. The first London hour closed up, and the day also closed up. So by our rule, this was not a judas swing. However, look past the first hour. Price fell well below the Asian low by mid-morning, then turned and rallied above the Asian high in the afternoon.
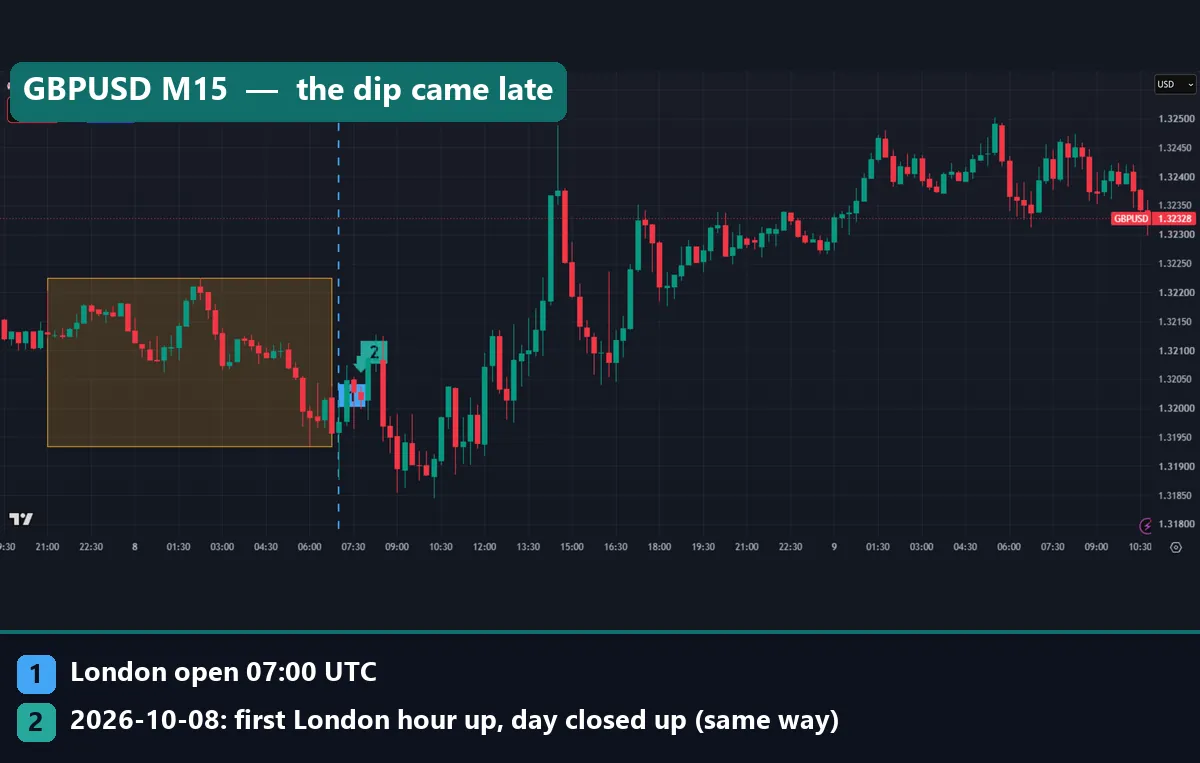
That shape looks like a judas swing to the eye. Yet the false move came around three hours after the open, not in the first hour. This is the first lesson of the pattern. The answer depends on the window you choose, and many traders pick the window after they see the chart.
Gold: against the day, but no break
Gold on the same day tells the opposite story. The XAUUSD Asian range ran from $4,103.45 to $4,143.43, a range of about $40. The first London hour closed down, and the day closed up. So by our rule, the first hour went against the day.
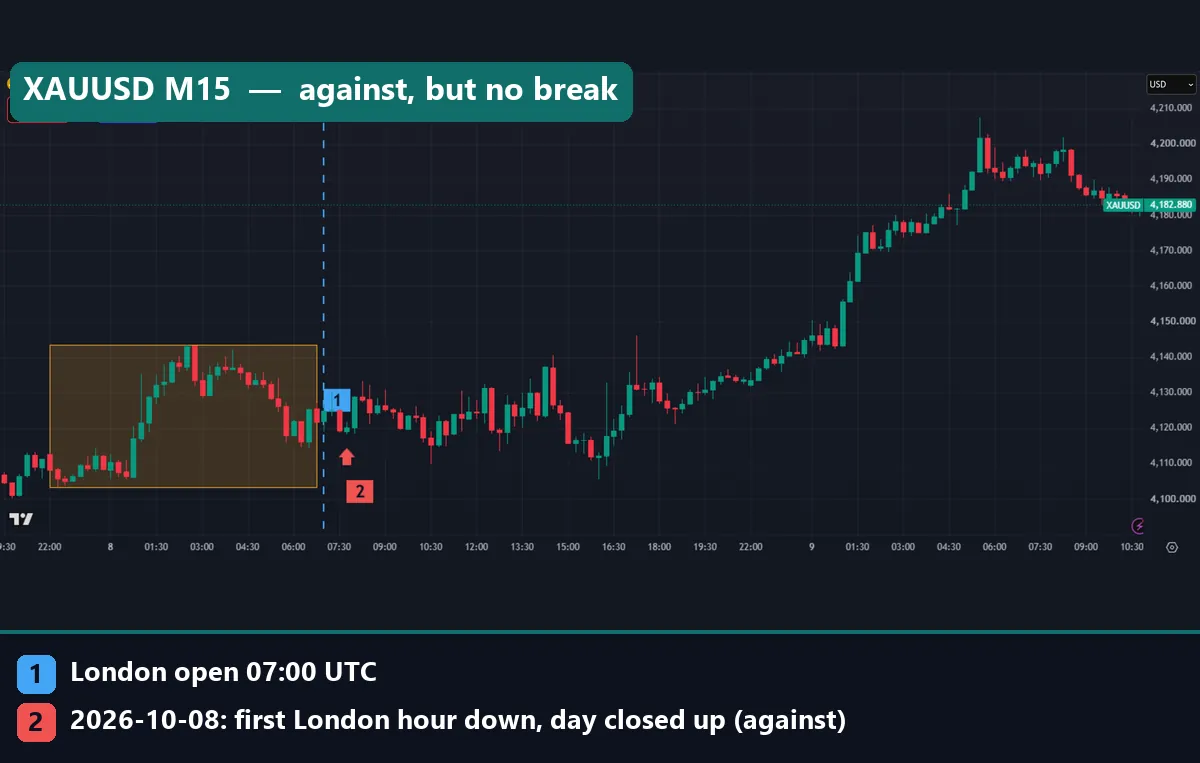
Still, look at where the first hour traded. It stayed inside the yellow box and never broke the Asian low. So the day counts as “against”, but it is not a textbook judas swing. Our ICT Asian range strategy guide treats that break as the core condition.
Worked example: EURUSD on 8 October 2026
Let us walk one day through the rule, using EURUSD from our first image.
First, the Asian range. On our OANDA chart, the box runs from 21:00 UTC on 7 October to 07:00 UTC on 8 October. Its high is 1.1213 and its low is 1.1190. That is a 23-pip range, which is narrow.
Next, the London open. The dashed line sits at 07:00 UTC. The four M15 bars from 07:00 to 07:59 closed higher overall, so the first hour was “up”.
Then, the day. From 07:00 to 20:59 UTC, EURUSD closed up as well. So the first hour and the day agreed. Our rule scores this as “same way”, which is the more common result.
Now look at the middle of the session. After the first hour, price slid below the Asian low. It reached roughly 1.1175 on our chart around 10:30 UTC. After that, it turned and climbed past the Asian high in the afternoon.
Here is the catch. If you had defined the false move as “the first break of the Asian range at any time before noon”, this day would count as a judas swing. Under our first-hour rule, it does not. Both readings use the same bars. As a result, the label says more about the definition than about the market.
What 2,161 days showed
Here is the full count. Across nine symbols, the first London hour went against the day on 864 of 2,161 days, about 40%. By symbol, that share ran from 33% on USDJPY to 43% on XAUUSD. So on roughly six days in ten, the first hour pointed the day’s way.
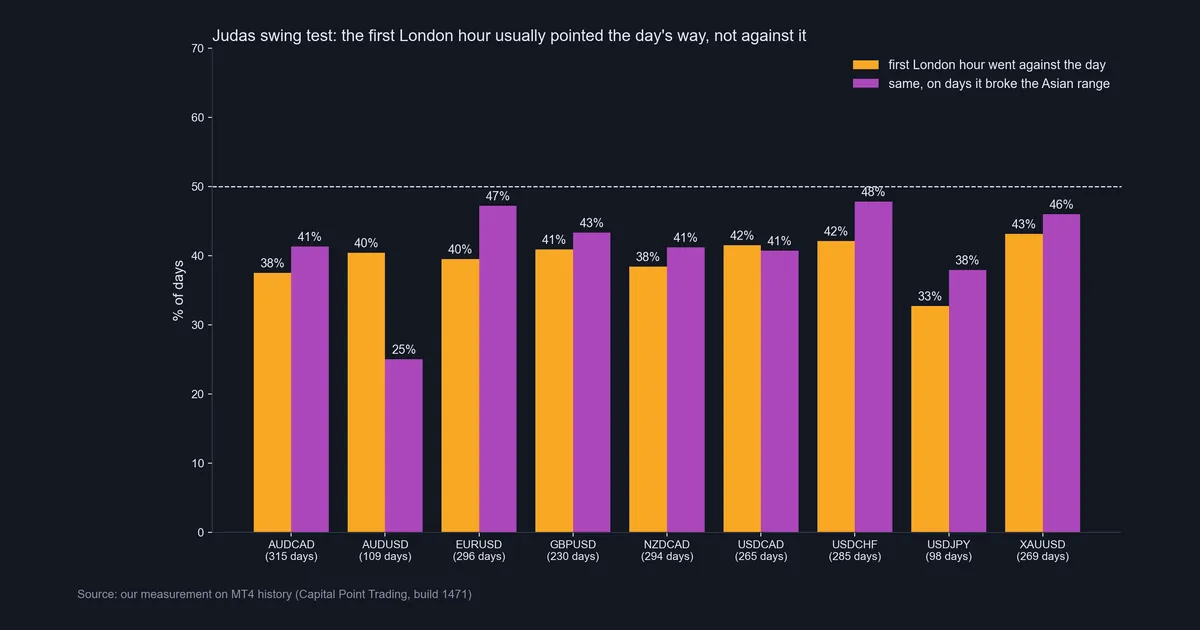
Next, we kept only days when the first hour broke the Asian high or low. That left 621 days, about 29% of the sample. Of those, about 43% went against the day. It peaked at 48% on USDCHF and never crossed 50%. AUDUSD went the other way: only 25% of its 32 break days reversed.
So even on break days, the early break kept going more often than it reversed. That is the reverse of what the judas swing story suggests. The EURUSD chart at the top fits that pattern. So does the 8 October USDJPY chart, with a first hour down and a day down.
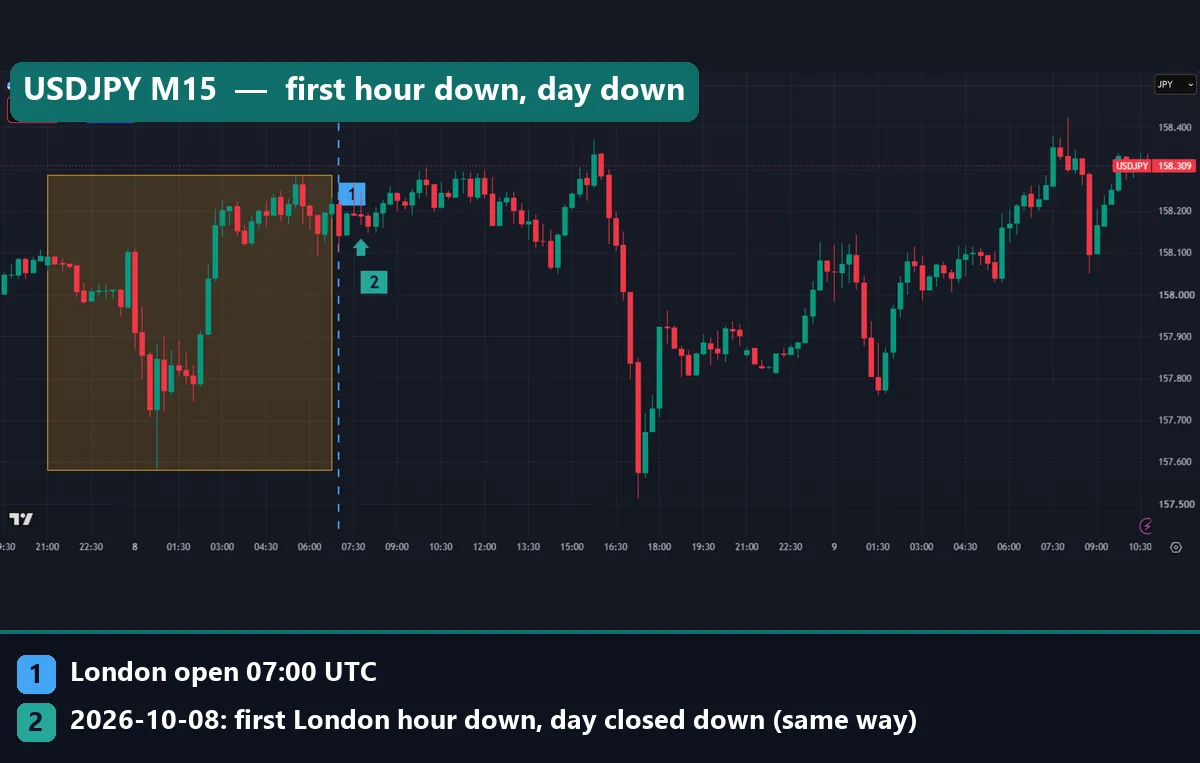
On USDJPY, the Asian range ran from 157.582 to 158.286, about 70 pips. The first hour closed down, and the day closed down. The big drop came in the New York afternoon, not at the London open.
Download the complete indicator database
Put these concepts on your charts. One email unlocks the full library of 1,380+ indicators with compiled MT4 and MT5 files, plus my TradingView scripts. No paywall, no spam, unsubscribe any time.
Get free access to my indicator database
One email unlocks 1,380+ free MT4, MT5 and TradingView indicators — the complete library. No single-tool download; you get the whole database.
Where it fails: limits of the judas swing
The first problem is frequency. A pattern that shows up on four days in ten cannot be your default read of the open. If you fade every London break, you trade against the more common outcome.
Second, the definition is loose. Our charts show false moves at 10:00 or 11:00 UTC, well after the first hour. A trader who allows any time window will find a judas swing on most days in hindsight. That makes it a poor rule for live trading, because you only know which move was false after the day ends.
Third, session times drift. We fixed the open at 07:00 UTC. In British winter time, London opens at 08:00 UTC, so our first hour sits partly before the real open during those months. Other traders use 06:00 or 08:00 UTC, and each choice moves the count.
Fourth, the test ignores size, so a tiny first hour counts the same as a sharp spike.
Finally, the sample is small for some symbols. USDJPY has 98 days and AUDUSD has 109. Every figure here is also before costs, and a strategy that fades early breaks often uses tight stops. With tight stops, spread takes a larger share of each trade.
One judas swing that fits the rule
Most of our examples are ordinary opens. The first chart below is one more, and the second is the pattern itself.
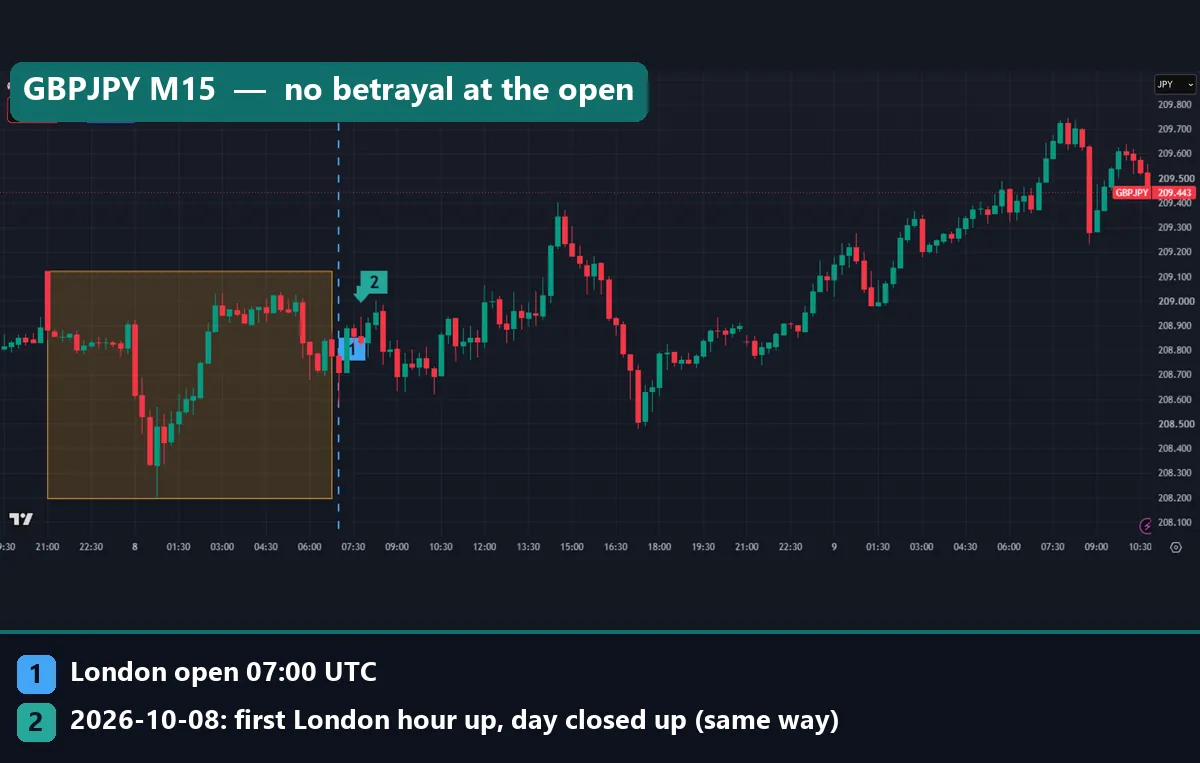
GBPJPY on 8 October shows the plain case. The Asian range ran from 208.198 to 209.124, about 93 pips. The first hour closed up, and the day closed up. There was no betrayal at the open.
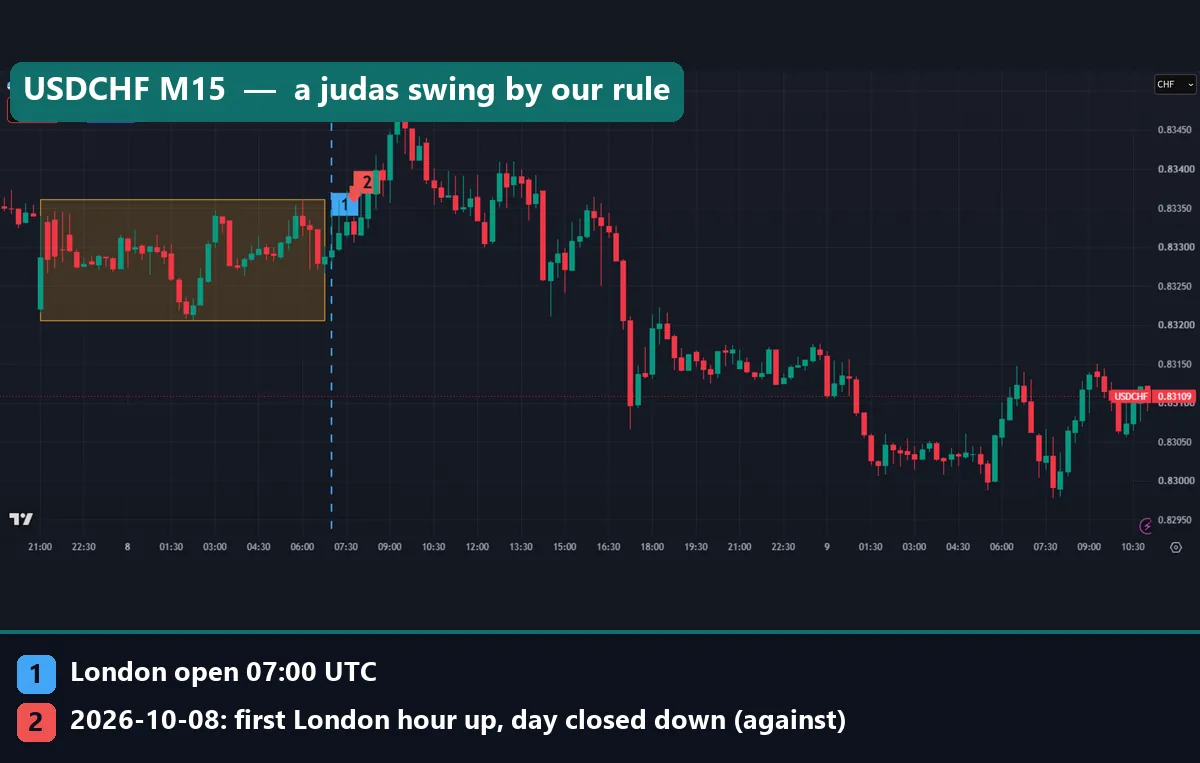
USDCHF on 8 October is the one day in our set that fits the rule. The Asian range ran from 0.83206 to 0.83361, about 15 pips. The first London hour closed up 3 pips and traded above the Asian high. Then the day closed down about 12 pips from the 07:00 open. So the early break went one way, and the day went the other. Note, though, that the biggest push above the range came after 08:00, and the real selling came in the New York afternoon.
Also, one example proves nothing. Across our nine symbols, break days reversed only 25% to 48% of the time, and the first hour went against the day on 33% to 43% of all days. This chart shows what the pattern looks like, not how often it pays.
Common judas swing mistakes
Four errors come up again and again.
- Fading every break. In our sample, early breaks of the Asian range continued more often than they reversed. A rule that sells every break of the high takes the less likely side.
- Labelling after the fact. Any dip before a rally can be called a judas swing once the day is over. Instead, write your time window and your break rule down before the session starts.
- Using the wrong clock. Many charts run on broker server time, not UTC. If your box starts at the wrong hour, every level is wrong. Check your chart offset first.
- Ignoring the bigger bias. A judas swing is supposed to run against the daily direction. Without a view of that direction, you cannot tell the false leg from the real one. Our guide to ICT daily bias covers how traders try to set it.
Where to go next with ICT session ideas
The judas swing sits inside a family of time-based ICT concepts. If you want the full daily picture, read our ICT daily profiles guide. The London kill zone explainer covers the time window most traders watch.
For the stop-order side of the story, our pages on stop hunting in forex and liquidity grabs versus liquidity sweeps explain the terms. Investopedia also has a plain summary of stop hunting at Investopedia.
If you want the Asian box drawn for you, the Asian range indicator marks it on MT4 and MT5. Also, for context on why London matters so much, the BIS Triennial Central Bank Survey of FX turnover at the BIS shows where global FX volume trades.
FAQ: judas swing questions
What is a judas swing in ICT?
It is a false move near the London open that breaks the Asian high or low, takes nearby stops, and then reverses into the day’s real direction.
What time does the judas swing happen?
Most teachers place it in the first hour or two of London, around 07:00 to 09:00 UTC in summer. In our charts, some false moves came later, near 10:00 to 11:00 UTC.
How often does the first London hour reverse?
In our test on 2,161 days and nine symbols, the first London hour went against the day about 40% of the time. The range by symbol ran from 33% to 43%.
Does a break of the Asian range make a reversal more likely?
Only a little. On days when the first hour broke the Asian range, about 43% went against the day. More than half of those breaks kept going.
Which timeframe is best for spotting a judas swing?
We used M15, which shows the first hour as four bars. A lower timeframe shows more detail, but it also shows more noise.
Is the judas swing the same as a stop hunt?
It is a specific kind. A stop hunt can happen at any time, while a judas swing is tied to the session open and the Asian range.
Can I trade the judas swing on gold?
You can mark it the same way. Gold had the highest “against” share in our sample at 43%, but that is still below half, and gold ranges are wide in dollar terms.
Is the judas swing a profitable strategy?
Our test checked direction only and placed no trades, so it shows no edge for fading the open. Treat any setup as a hypothesis to test on your own data; results are not guaranteed; past performance is not indicative of future results.
Last updated: 9 October 2026.

About the author
Written by Dominic Walsh, a Forex trader and MT4/MT5 indicator, Expert Advisor and script developer. Every tool on forexmt4systems.com is tested on live charts before release and ships with ready-to-use compiled MT4 (.ex4) and MT5 (.ex5) files. Learn more about the trader and developer behind this site.
How we build, test and correct every tool: Editorial & Testing Policy. Trading carries risk; see the disclaimer.