
What is M2, and why do traders keep quoting it? M2 is the Federal Reserve’s broad count of US money: cash, bank deposits and retail money market funds. This guide settles what it covers, how it links to prices, and what 813 months of data show. From January 1959 to September 2026 it grew from $0.287tn to a record $23.41tn, or 81.7 times. Its yearly change fell below zero only once. And its link to consumer prices is loose, with a best correlation of 0.50 about 30 months later. So treat M2 as background, not as a trade signal.
What is M2? The Fed’s definition
The Fed publishes M2 in its H.6 release, Money Stock Measures. The H.6 technical Q&As on the Federal Reserve’s site build it from three parts. First comes M1, the narrow measure of money you can spend at once. Next come small time deposits, bank deposits fixed for a set term. Last come balances in retail money market funds. The Fed then takes out IRA and Keogh retirement balances held at banks and at those funds.
In plain words, M2 counts money people can spend now or reach soon. Each value is a monthly average in US dollars, and our series has seasonal swings smoothed out. All of it is fiat money, backed by law rather than by a metal, as our guide to fiat currency explains.
The May 2020 change that moved savings into M1
The definition changed in 2020, and that trips up chart readers. First, the Fed cut reserve requirement ratios to 0 percent, effective 26 March 2020. Then, on 24 April 2020, it deleted the six-per-month transfer limit on savings deposits in its Regulation D. After that, savings deposits worked much like checking accounts. So the Fed now counts them in M1, from the May 2020 data on.
What did not change matters more here. The Fed’s Q&As say the move raised M1 a great deal but left M2 unchanged. Savings deposits sat inside M2 before, and they still do. As a result, M2 has no break at May 2020, while M1 has a large one. That is one reason we use M2.
How M2 links to prices: the formulas
Two formulas do most of the work. The first is the yearly change, which we use all through this guide:
yearly change % = (M2 this month / M2 same month a year earlier - 1) x 100
For example, M2 stood at $15.49tn in February 2020 and $19.64tn in February 2021. That gives (19.64 / 15.49 – 1) x 100 = 26.8%, the fastest growth in the series.
The second is the equation of exchange. The velocity of money entry on Wikipedia writes it as V = PQ / M. M is the money stock, P the price level and Q real output, so PQ is nominal output. Rearranged, it reads M x V = P x Q.
For M2, velocity is nominal GDP over M2. BEA’s guide to what GDP measures defines GDP as the value of the final goods and services produced in the United States, estimated each quarter. Our guide on how GDP affects forex covers that side.
The trader’s logic: if money outgrows output and velocity holds still, prices must rise. But velocity does not hold still.
How we tested
We pulled every series on the TradingView web chart on 6 November 2026. M2 is FRED:M2SL, one value per month from January 1959 to September 2026. Consumer prices come from ECONOMICS:USIRYY, the US CPI change on a year earlier; the chart header names the Bureau of Labor Statistics. Velocity comes from FRED:M2V, one value per quarter from early 1959 to the third quarter of 2026.
For each month from January 1960, we worked out the yearly change in M2. Next, we lined it up with the CPI change 0 to 36 months later, in steps of three, and measured the correlation. We ran that on two windows: 1960 to 2019, and 1960 to September 2026. Our CPI series has no value for October 2025, so that month drops out.
We tested no trades, so spread, swap, financing and commission play no part. Our editorial testing policy explains how we handle data like this. Charts 4 and 5 are our own measurement; the rest are TradingView captures.
The series and settings behind this guide
M2 has no inputs to tune, unlike an indicator. Still, every result below rests on a few choices.
| Setting | What we used |
|---|---|
| Money series | FRED:M2SL, M2 money stock |
| Units | US dollars, monthly average, seasonally adjusted |
| Window | January 1959 to September 2026, 813 months |
| Growth measure | Yearly change: this month vs the same month a year earlier |
| Price series | ECONOMICS:USIRYY, US CPI, % on a year earlier |
| Lags tested | 0 to 36 months, in steps of 3 |
| Test windows | 1960 to 2019, and 1960 to September 2026 |
| Velocity series | FRED:M2V, nominal GDP / M2, quarterly |
| Costs | None: we simulated no trades |
The second window matters, because it shows how much one odd stretch, 2020 to 2023, can move a result.
Reading M2 on a chart
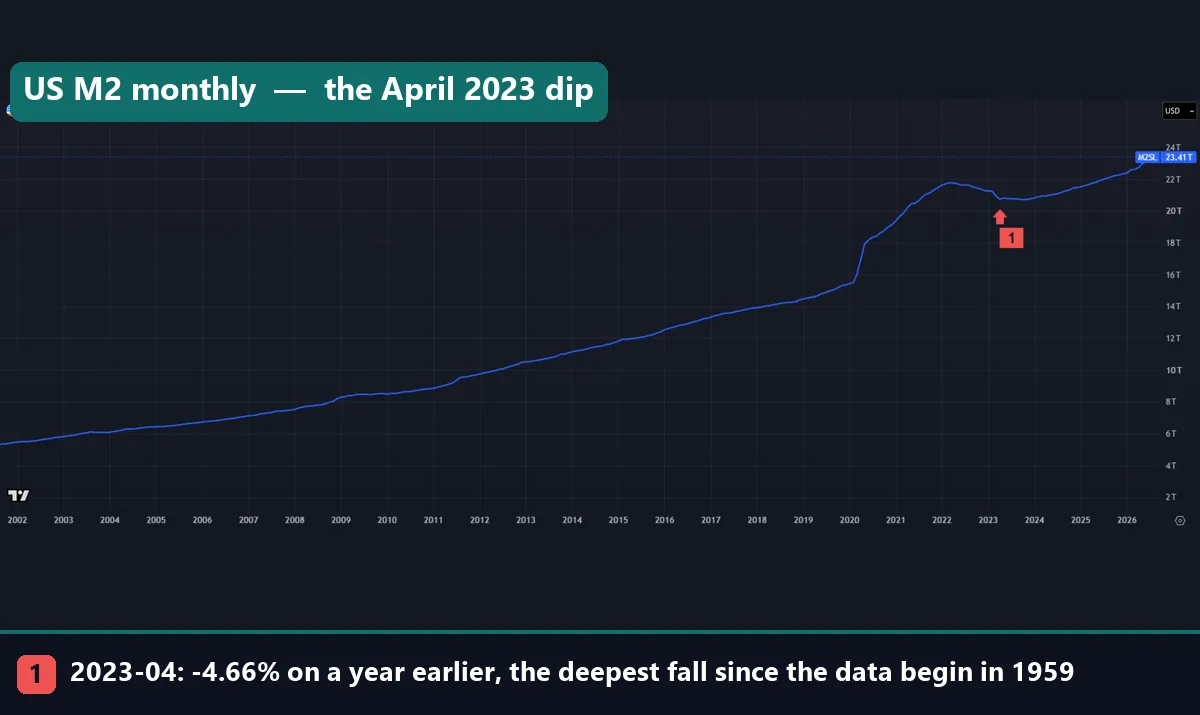
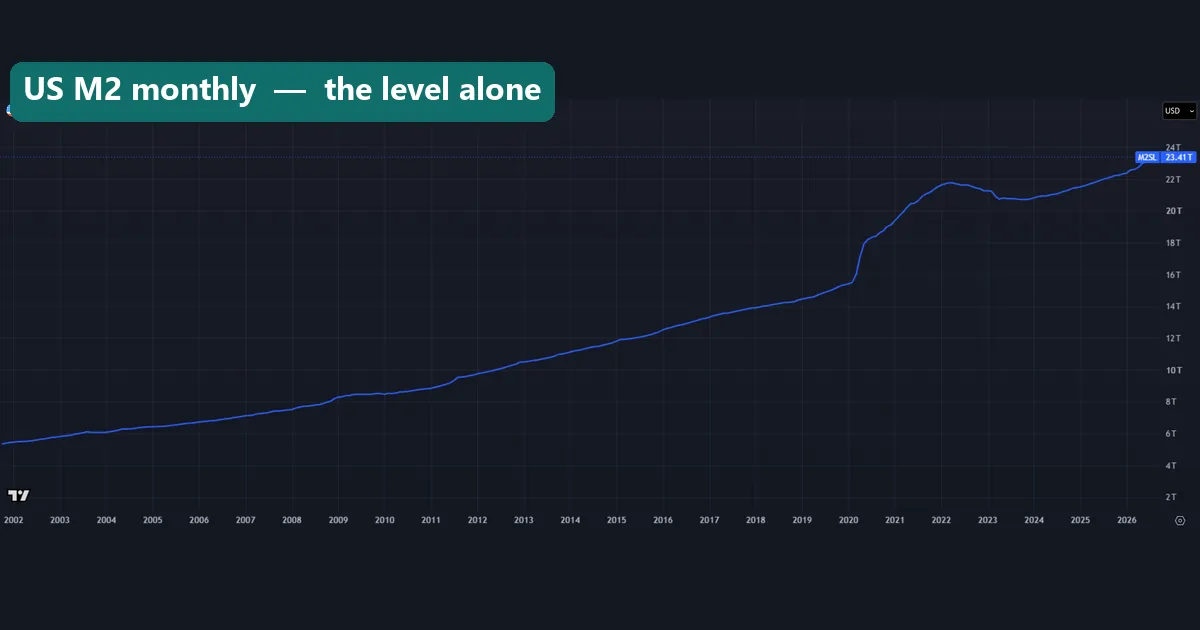
On TradingView, M2 looks like a line that climbs almost without pause. Chart 1 above runs from late 2001 to September 2026. Its marker sits at April 2023, when the yearly change hit -4.66%, the deepest fall since the data begin. On the level line that is only a small dip. So the first lesson is that the level hides the growth rate.
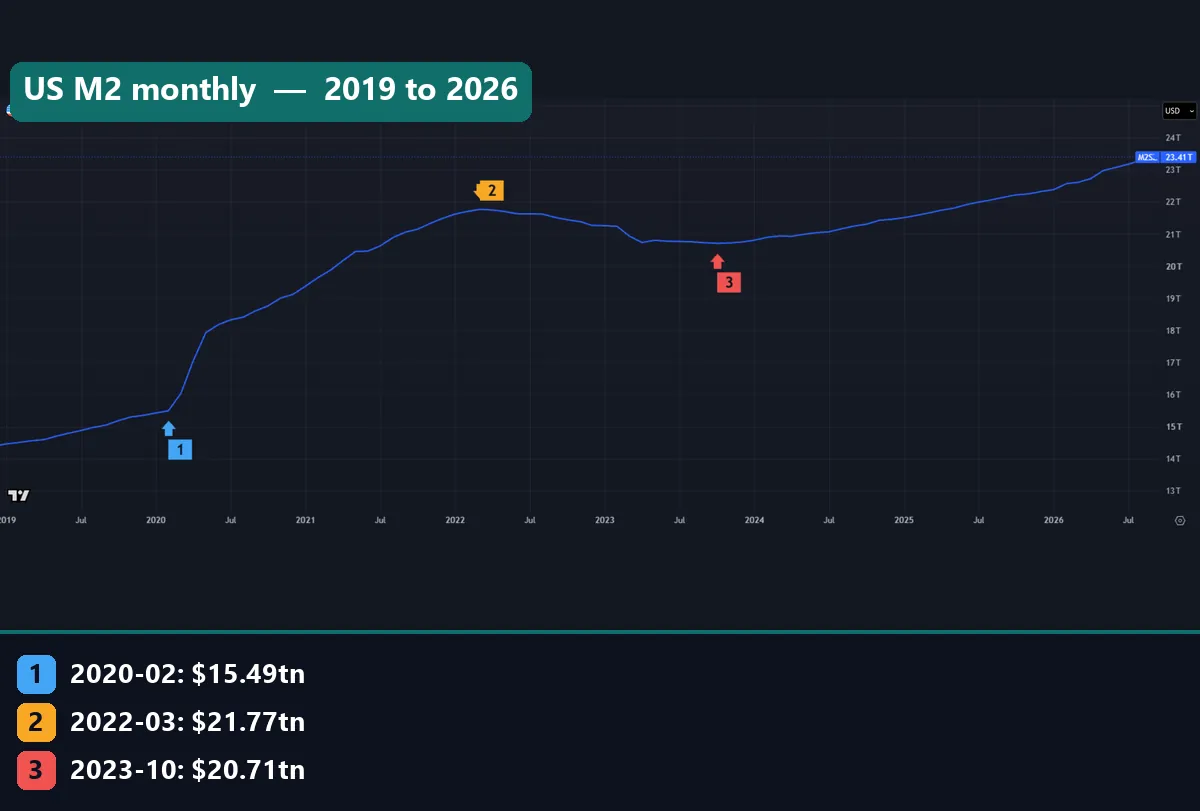
Chart 2 zooms in on early 2019 to September 2026. Marker 1 is February 2020, at $15.49tn, and soon after it the line turns almost vertical. Marker 2 is the peak of $21.77tn in March 2022, and marker 3 the low of $20.71tn in October 2023. From there the line climbs to the $23.41tn record.
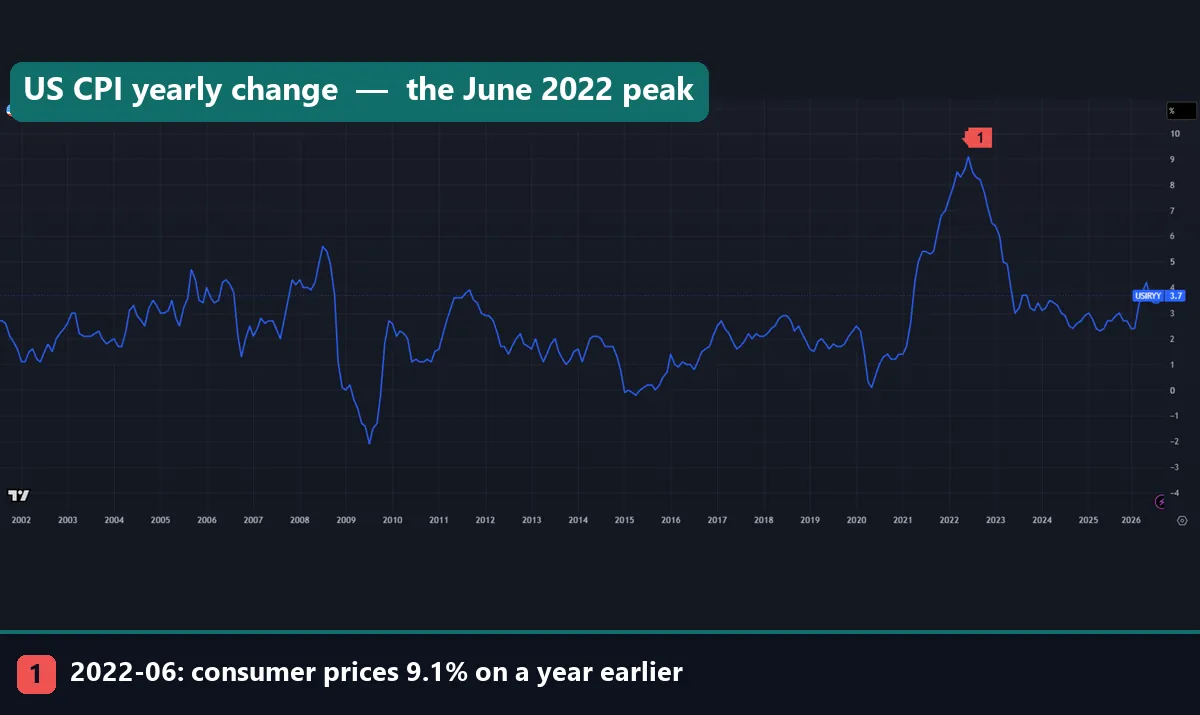
Chart 3 shows consumer prices against a year earlier, from 2002. The marker is June 2022, when CPI ran at 9.1%. The line also dips to -2.1% in July 2009, while M2 was growing 8.63% a year. Our guide to CPI in forex explains how traders read that release. In short, read the two charts side by side.
Worked example: the 2020 to 2023 cycle in numbers
This is the one cycle in the data where M2 both surged and shrank.
- February 2020: M2 is $15.49tn, up 6.8% on a year earlier. CPI runs at 2.3%.
- February 2021: M2 is $19.64tn, up 26.78%, the peak growth rate. That is $4.15tn added in a year, yet CPI is only 1.7%.
- March 2022: the level peaks at $21.77tn. Growth has slowed to 9.54%, while CPI is up to 8.5%.
- June 2022: CPI peaks at 9.1%, 16 months after the M2 growth peak.
- December 2022: the yearly change turns negative, at -1.0%. It bottoms at -4.66% in April 2023, with CPI at 4.9%.
- October 2023: the level bottoms at $20.71tn, $1.06tn or 4.9% under the peak.
- September 2026: M2 is a record $23.41tn, up 5.71%. That is 7.5% above the 2022 peak and 51.1% above February 2020. CPI is 3.7%.
What does it teach? Prices peaked 16 months after money growth did, a loose lag. And M2 shrank against a year earlier for 15 months, December 2022 to February 2024. Yet CPI never fell below 3.0% in that stretch. Prices rose more slowly, but they still rose.
M2 growth and inflation since 1960
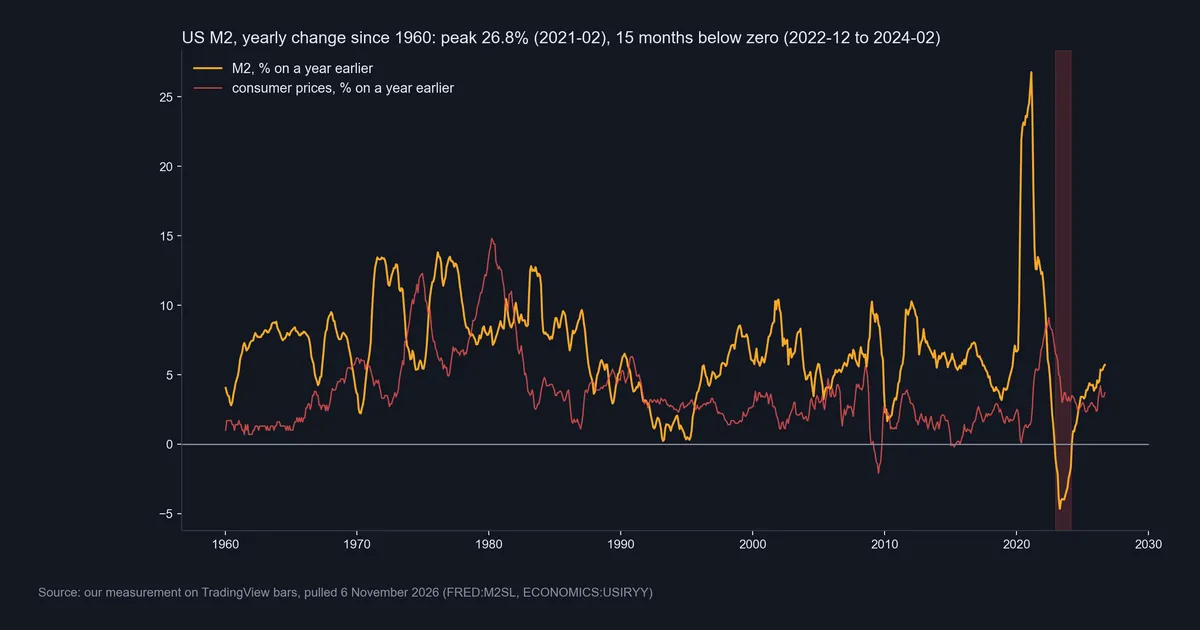
Chart 4 is our measurement of both yearly changes since 1960: M2 in gold, consumer prices in red. A shaded band marks the 15 months below zero. The M2 spike to 26.8% in February 2021 towers over the rest.
Now look at the 1970s. M2 grew at a median 9.8% a year, and CPI peaked at 14.8% in March 1980. In October 1979, the Fed under Paul Volcker shifted its focus to bank reserves to hold back money growth. Federal Reserve History’s essay on the 1979 announcement tells the story, and notes the federal funds rate hit a record 20 percent in late 1980. Our guides to the FOMC meeting and how inflation affects forex pick up from there.
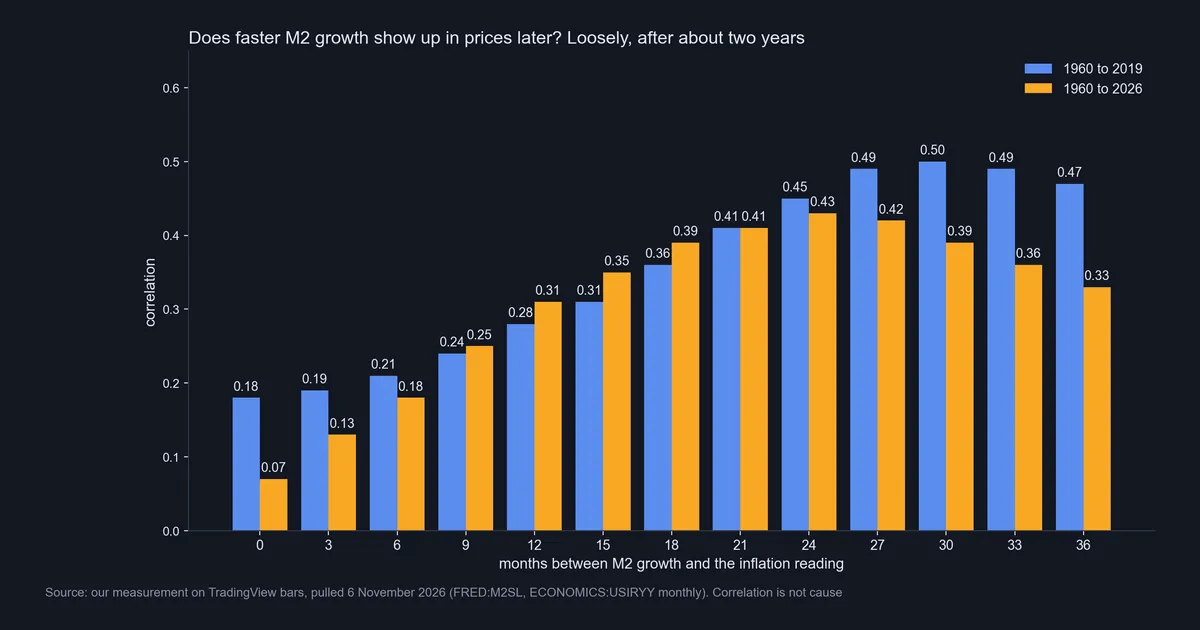
Chart 5 asks the trader’s question: does faster M2 growth show up in prices later? With no lag, the correlation is 0.18 on 1960 to 2019 and 0.07 on all data. It climbs to 0.50 at 30 months on the older window, and 0.43 at 24 months on all data. So faster money growth went with somewhat higher inflation about two years later. Even so, 0.50 explains only about a quarter of the variation (0.50 squared), and correlation is not cause.
M2 growth by decade
Both columns are medians of the monthly yearly changes in our data.
| Decade | M2, median yearly change | CPI, median yearly change |
|---|---|---|
| 1960s | 7.7% | 1.6% |
| 1970s | 9.8% | 6.6% |
| 1980s | 8.3% | 4.2% |
| 1990s | 4.2% | 2.8% |
| 2000s | 6.2% | 2.7% |
| 2010s | 6.0% | 1.8% |
| 2020s (to September 2026) | 4.3% | 3.2% |
The pattern is weak. In the 2010s the M2 median was 6.0%, close to its 6.57% median since 1960, yet the CPI median was only 1.8%. The 2020s hold the 26.78% peak, but the 15 negative months pull their median down to 4.3%. And September 2026’s 5.71% sits below the long-run median, even at a record level.
Download the complete indicator database
Put these concepts on your charts. One email unlocks the full library of 1,380+ indicators with compiled MT4 and MT5 files, plus my TradingView scripts. No paywall, no spam, unsubscribe any time.
Get free access to my indicator database
One email unlocks 1,380+ free MT4, MT5 and TradingView indicators — the complete library. No single-tool download; you get the whole database.
Where it fails as a price signal
The link to prices is loose. Our best correlation was 0.50, and in July 2009 M2 grew 8.63% while CPI was -2.1%.
The lag moves, too. Our best lag was 30 months on the older window and 24 on all data. But in the last cycle, prices peaked 16 months after money growth. A rule built on a fixed lag would have been early or late.
The data are slow. On 6 November 2026, our newest monthly value was still September 2026, and velocity is quarterly. Neither helps time a day trade or a swing trade.
The past can change. The Fed applied the 2020 change back to May 2020 in the data, so old and new M1 downloads differ.
Finally, M2 is a US number. A currency pair has two sides, and we did not test M2 against any pair here. So we make no claim that it moves the dollar.
Velocity: the part of the formula that will not sit still
The equation of exchange only turns money into prices if velocity is steady. It is not.
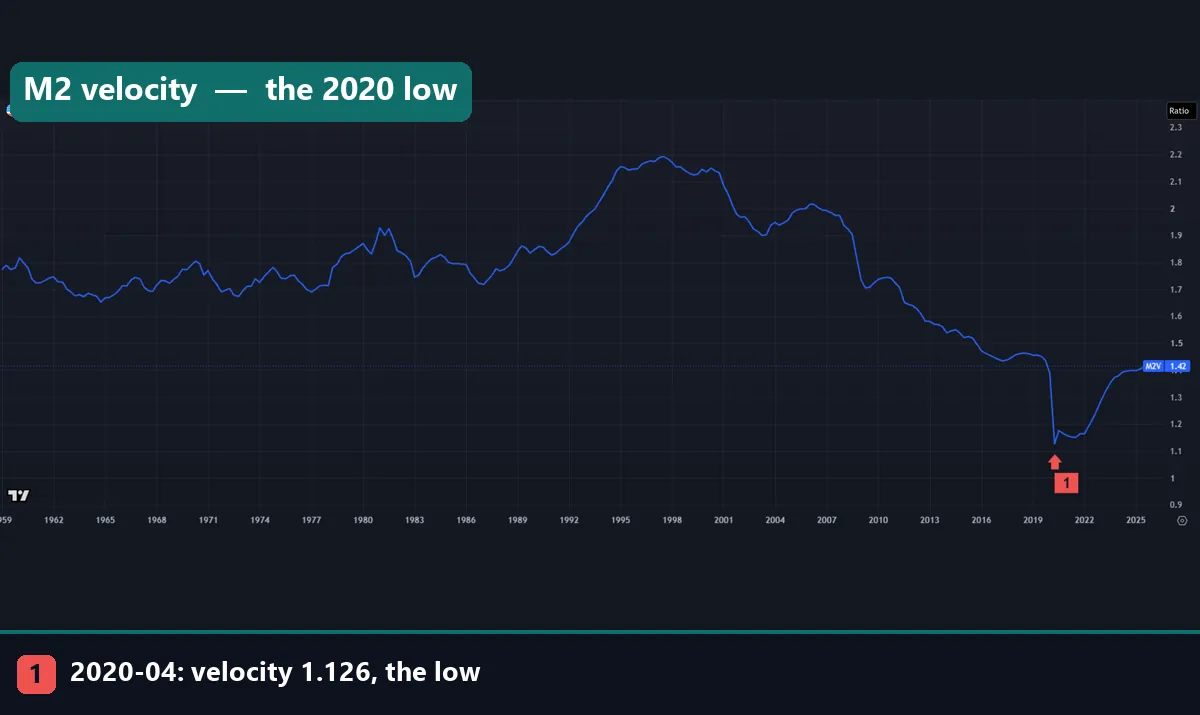
Chart 6 shows M2 velocity, one value per quarter since 1959. It moved mostly between 1.6 and 2.0 until the early 1990s, then climbed to a high of 2.192 in the third quarter of 1997. After that it fell for most of two decades, to the marked low of 1.126 in the second quarter of 2020. The latest value is 1.417, for the third quarter of 2026. In the identity, a falling V lets M grow faster than nominal GDP, and that is what the chart shows for most of the 2010s.
Chart 7, the plain level line, sets up the first mistake below.
Four common mistakes with M2
Mistake 1: reading the level as growth. Chart 7 runs from 2002 to September 2026, and the line sets one record after another. September 2026 is a record at $23.41tn, yet its yearly change of 5.71% is below the 6.57% median. A growing series sits at records most of the time, so a record alone says little.
Mistake 2: treating the link as a rule. At the best lag, a correlation of 0.50 still leaves about three quarters of the variation unexplained. The decade table shows how far the two can drift apart.
Mistake 3: mixing M1 and M2 across May 2020. The M1 jump that month is mostly a relabel of savings deposits. Compare M1 before and after, and you compare two different things.
Mistake 4: trading the release like a news spike. Fast moves around data come from surprises, as our note on forex news spikes covers. M2 moves slowly. It suits a view of policy, like the Fed dot plot, not a trade entry.
What M2 means for forex traders, and where to go next
The path from M2 to a currency runs through prices and then rates. Start with central bank rate decisions, where money growth turns into policy. Then read how interest rates affect forex, what yields are and bond yields in forex.
For the dollar side, see the dollar index in forex. To place M2 among other data, read the business cycle and economic indicators and how to read an economic calendar.
FAQ about M2
What is M2 in simple terms?
It is the Fed’s broad count of US money: M1, plus small time deposits and retail money market funds, minus IRA and Keogh balances.
What is the difference between M1 and M2?
M1 is the narrow measure, and M2 contains all of it. Since the May 2020 data, savings deposits count in M1. The Fed says that raised M1 a great deal but left M2 unchanged.
How big is M2 now?
In September 2026 it was a record $23.41tn, seasonally adjusted. That was 5.71% above a year earlier and 81.7 times the $0.287tn of January 1959.
Has M2 ever shrunk?
Yes, once in this series. The yearly change stayed below zero for 15 months, December 2022 to February 2024, with a low of -4.66% in April 2023. Our data starts in 1959, so we make no claim about earlier years.
Does rising M2 cause inflation?
Our data shows a loose link, not a rule. The correlation is 0.18 with no lag on 1960 to 2019, and 0.50 when CPI is read 30 months later. Correlation is not cause, and velocity shifts the picture.
What is M2 velocity?
It is nominal GDP divided by M2. It peaked at 2.192 in the third quarter of 1997, hit 1.126 in the second quarter of 2020, and stood at 1.417 in the third quarter of 2026.
Where can I see M2 on TradingView?
Search for FRED:M2SL for the monthly series and FRED:M2V for velocity. ECONOMICS:USIRYY gives US CPI on a year earlier. Use a line chart, since each bar is one value.
Can I trade forex on M2 data?
Not directly. M2 is slow and only loosely tied to prices, and we did not test it against any currency pair. Use it to frame the inflation and rate outlook, and keep in mind that results are not guaranteed; past performance is not indicative of future results.
Last updated: 6 November 2026.

About the author
Written by Dominic Walsh, a Forex trader and MT4/MT5 indicator, Expert Advisor and script developer. Every tool on forexmt4systems.com is tested on live charts before release and ships with ready-to-use compiled MT4 (.ex4) and MT5 (.ex5) files. Learn more about the trader and developer behind this site.
How we build, test and correct every tool: Editorial & Testing Policy. Trading carries risk; see the disclaimer.