
Gross national product (GNP) is the value of goods and services made with labor and property that US residents supply, wherever in the world the work takes place. GDP counts what is made inside the country instead. That sounds like a big split, but for the United States the two numbers sit close together. This guide settles three things. First, how the two link, in BEA’s own words. Next, what 318 quarters of US data show about the gap. Last, whether GNP tells a forex trader anything that GDP does not.
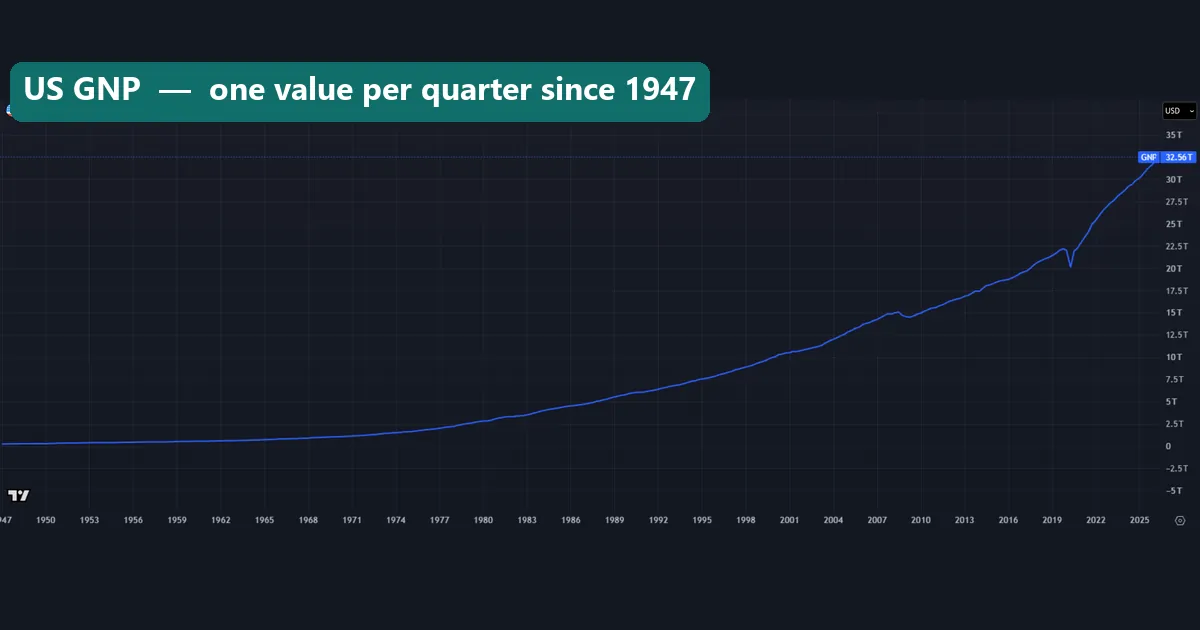
This is the GNP line itself, one value per quarter from 1947 to mid-2026. It climbs for decades, with a dip in 2008 and 2009 and a sharp drop in 2020.
What gross national product actually is
The clearest definition comes from BEA’s August 1991 Survey of Current Business article on GDP and GNP. BEA, the Bureau of Economic Analysis, builds the US national accounts. It says both measures count goods and services, but they draw the border in different places.
GDP covers output from labor and property located in the United States, and the workers or owners can live anywhere. GNP covers output from labor and property that US residents supply. That labor and property can sit at home or abroad.
So picture a US company with a plant in Germany. The profit that plant earns for its US owner counts in US GNP but not in US GDP. Now flip it. A German firm’s profit from a plant in Ohio counts in US GDP but not in US GNP. In short, GDP asks where the work happened, and GNP asks who supplied it.
GNP was the headline US output measure until 1991. That August, BEA said it would feature GDP from its next full revision of the accounts, and it kept publishing GNP. Our guide on how GDP affects forex covers the number that took its place.
GNP and gross national income
Outside the United States you will mostly meet a close cousin, gross national income (GNI). Eurostat’s glossary entry on gross national income calls it the sum of incomes of an economy’s residents. It equals GDP, minus primary income paid to non-residents, plus primary income received from them. That is the same bridge BEA uses for GNP. Still, the two come from different rulebooks, so check each agency’s notes before you compare them.
GNI also has a job of its own. The World Bank Data Help Desk on GNI per capita explains that the Bank sorts countries into income groups by GNI per head. It prefers GNI to GDP because GNI counts what residents earn, and that includes income from assets abroad.
How GNP and GDP connect: the formula
BEA’s 1991 article sets out the bridge in plain steps. To go from GNP to GDP, you subtract income receipts from foreigners and add income payments to them. Turn that around and you get the usual form.
GNP = GDP + income receipts from the rest of the world - income payments to the rest of the world
gap (% of GDP) = (GNP / GDP - 1) x 100
The income in question is factor income. BEA lists three parts: pay of employees, corporate profits and net interest. Profits here include dividends and the earnings of foreign affiliates. So the gap is mostly about who owns what, and where.
The article also explains why the US gap stays small. What US residents own abroad, minus what foreigners own in the United States, has been small next to the whole economy. So a positive gap means residents earned more from abroad than they paid out, and a negative gap means the reverse.
How we tested
We pulled four quarterly series from the TradingView web chart on 6 November 2026: FRED:GNP, FRED:GDP, FRED:GNPC96 and FRED:GDPC1. Each is a FRED copy of BEA data, and the chart header names BEA as the source. GNP runs from Q1 1947 to Q2 2026, which is 318 quarters. GDP runs one quarter further, to Q3 2026.
We drew them as line charts on the monthly setting, so each point is one quarter. TradingView stamps a quarter on its first month, so Q2 2026 sits on April 2026. For every quarter we took GNP divided by GDP, minus 1, times 100. For real growth, we compared each quarter with the same quarter a year earlier, then took the correlation of the two paths.
We placed no trades. These are official statistics as they stood on the pull date, and BEA revises them. Our editorial testing policy explains how we collect and report numbers like these.
The four series and their settings
Here is what each symbol holds, and the units matter.
| Symbol | What it measures | Units | Window in our pull |
|---|---|---|---|
| FRED:GNP | Gross national product, nominal | Dollars, seasonally adjusted annual rate | Q1 1947 to Q2 2026 |
| FRED:GDP | Gross domestic product, nominal | Dollars, seasonally adjusted annual rate | Q1 1947 to Q3 2026 |
| FRED:GNPC96 | Real GNP | Chained 2017 dollars | Q1 1947 to Q2 2026 |
| FRED:GDPC1 | Real GDP | Chained 2017 dollars | Q1 1947 to Q3 2026 |
An annual rate states each quarter as a yearly pace. BEA’s 1991 note says its quarterly estimates rest on seasonally adjusted annual rates. So $32,559.4bn of GNP in Q2 2026 is not the output of those three months. It is the total for a full year if that quarter’s pace held.
Nominal means current dollars, so it mixes real growth with price change, and real series take price change out. Our page on how inflation affects forex covers that price side.
Reading gross national product on a chart
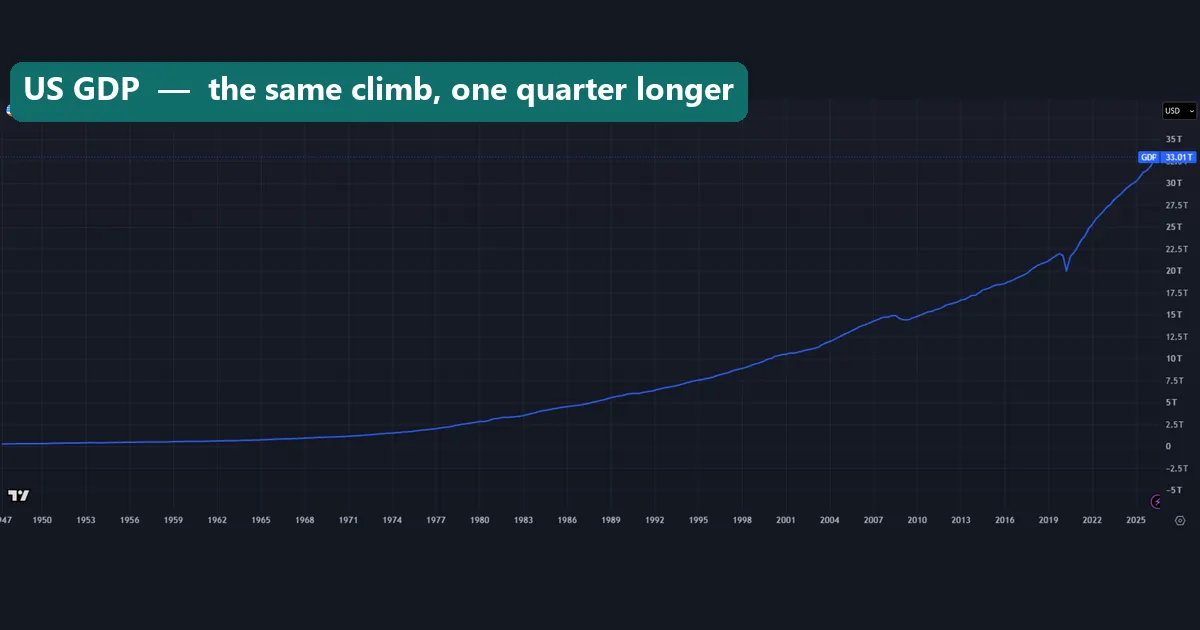
Start with the two long charts. GDP below has the same climb, 2009 dip and 2020 drop as the GNP chart above. At this scale the gap is invisible, which tells you how small it is.
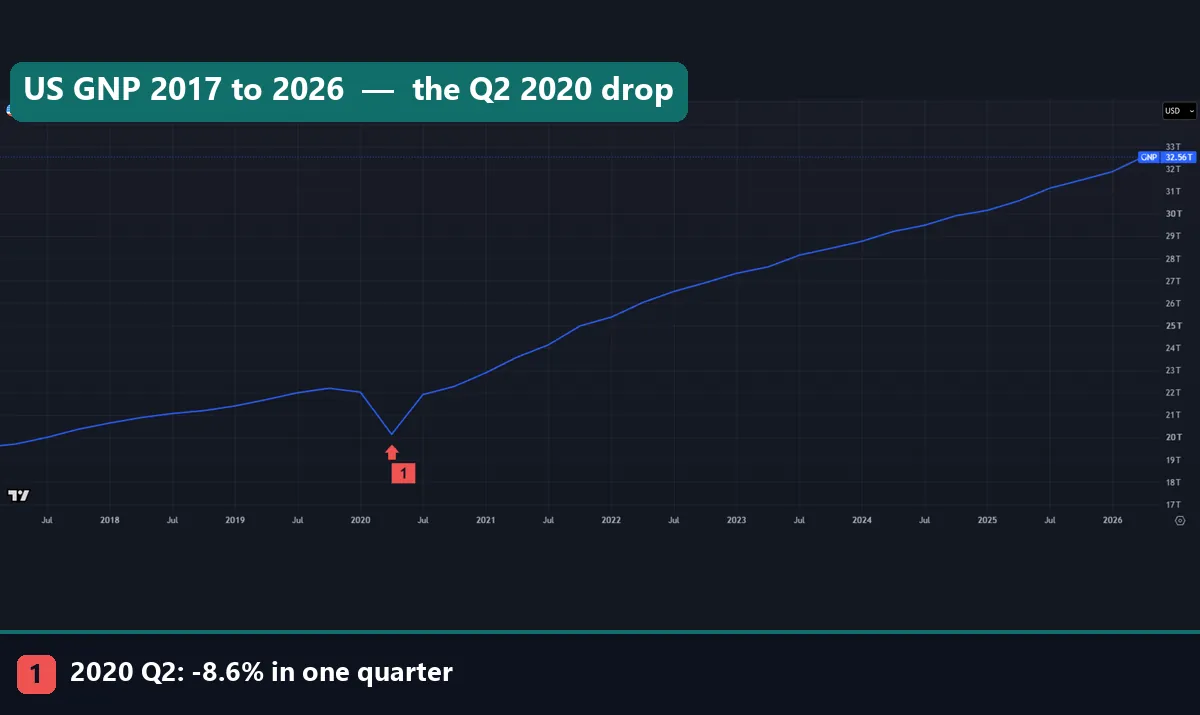
Now zoom in. The next chart shows nominal GNP from 2017 to Q2 2026, and marker 1 sits on Q2 2020. GNP fell 8.6% in that one quarter, from about 22T to about 20T on the price axis. It was back above its late-2019 level by Q4 2020, and it rose in every quarter after that.
Read that drop with care. It is the change in the level from one quarter to the next, not a yearly rate, and it still holds price changes. Also, the line joins quarterly points, so the V shows nothing of the months inside it. The business cycle and economic indicators guide shows how a fall like this fits a wider downturn.
Worked example: the Q2 2026 gap
Take the latest quarter both series share, Q2 2026. GNP was $32,559.4bn and GDP was $32,563.0bn, both at annual rates. So GNP came in $3.7bn below GDP. Divide by GDP and you get -0.01%. In plain words, US residents paid slightly more income to the rest of the world than they got from it.
Now set that next to the extremes. The widest positive gap was +1.64% in Q4 2011. The deepest negative one was -0.28% in Q3 2024. The median of all 318 quarters is +0.62%. So the latest reading is close to zero, even by the standard of this quiet series.
Then run the same check on real growth. In Q2 2026 real GNP was 2.36% above its level a year earlier, and real GDP was 2.19% above. The difference is 0.17 points, against a median of 0.09 points over the whole history. So both say the economy grew a little over 2% in the year to Q2 2026.
The gap since 1947, decade by decade
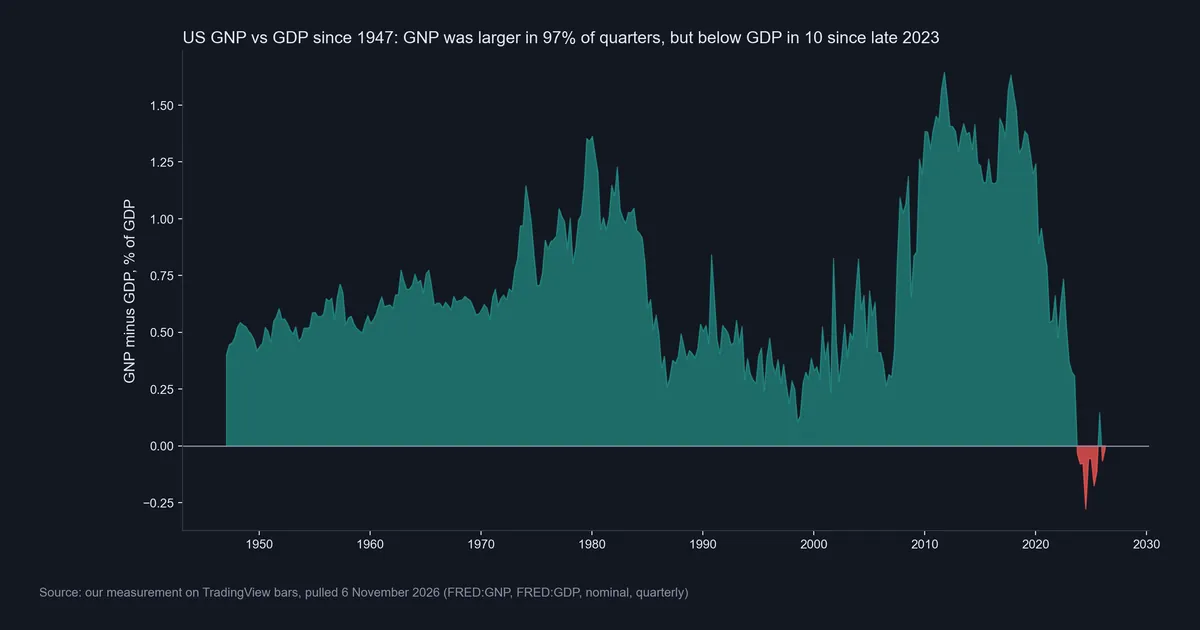
Our first data chart plots the gap for every quarter. GNP sat above GDP in 96.9% of them. The gap rose into the 1970s and early 1980s, shrank in the 1990s, then hit its widest stretch in the 2010s. It turned red in Q4 2023. The decade medians make the pattern easier to read.
| Decade | Median gap, % of GDP |
|---|---|
| 1940s | 0.48 |
| 1950s | 0.54 |
| 1960s | 0.64 |
| 1970s | 0.87 |
| 1980s | 0.72 |
| 1990s | 0.38 |
| 2000s | 0.51 |
| 2010s | 1.38 |
| 2020s | 0.35 |
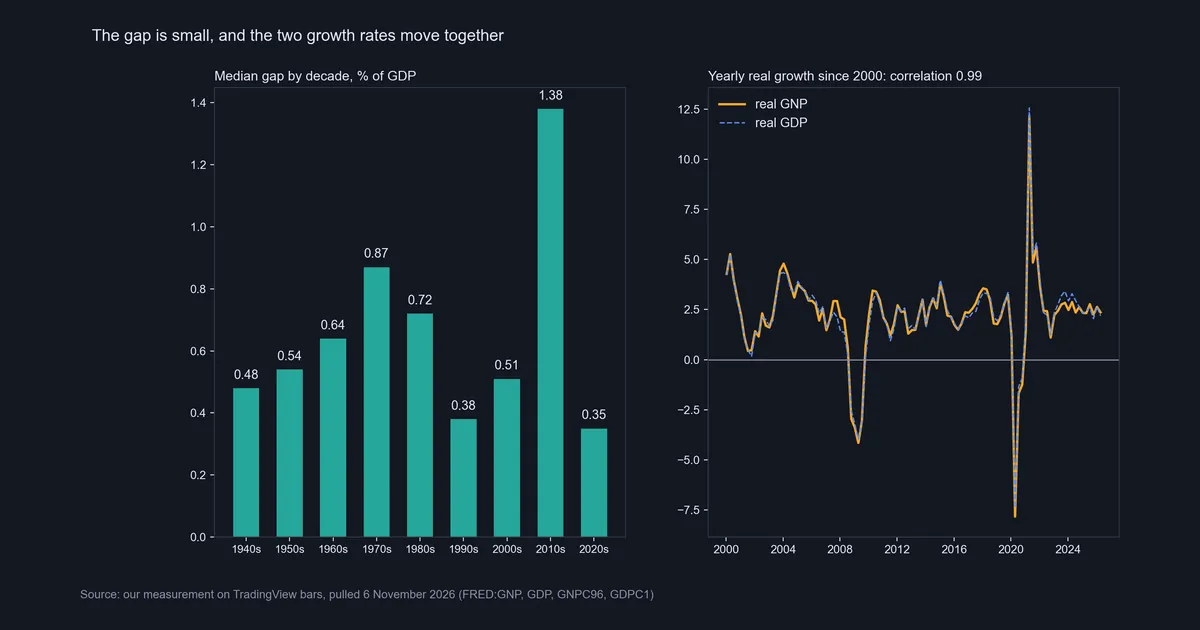
The left panel shows those medians as bars. The right panel plots yearly real growth for both series since 2000, and the two lines sit almost on top of each other. The 1.00 in its title is the correlation over all quarters from 1948 on.
What a negative gap means
BEA’s 1991 article noted that since 1929, US receipts from investments abroad had exceeded payments to foreigners. So GNP stayed above GDP. Our series starts in 1947 and agrees until Q3 2023. From Q4 2023 to Q2 2026, GNP sat below GDP in 10 of the 11 quarters. The one exception was Q4 2025, at +0.15%.
So net income from abroad turned negative. US residents paid more in income to the rest of the world than they earned from it. However, our data cannot say which side moved: receipts, payments or both. BEA’s international accounts carry that detail, and we give no cause we cannot source.
Even the low of -0.28% is a sliver of GDP, and nominal GDP rose in every one of those quarters. Net interest is one of the income lines, and our guide on how interest rates affect forex covers rates from the trading side.
Download the complete indicator database
Put these concepts on your charts. One email unlocks the full library of 1,380+ indicators with compiled MT4 and MT5 files, plus my TradingView scripts. No paywall, no spam, unsubscribe any time.
Get free access to my indicator database
One email unlocks 1,380+ free MT4, MT5 and TradingView indicators — the complete library. No single-tool download; you get the whole database.
Where it fails
It arrives late. In our pull, GDP already has Q3 2026 while GNP stops at Q2 2026. In 1991 BEA wrote that the survey data behind income from abroad were not ready for its first two estimates of each quarter. So by the time a GNP figure lands, the GDP story for that quarter is out.
It gets revised. The 1991 article put the largest US gap at 1.8%, in 1980, and the 1990 gap at 0.8%. Today’s series shows the four 1980 quarters at 0.96% to 1.36%, and 1990 at 0.45% to 0.84%. The widest quarter now falls in 2011. So a figure from an old report may not match the chart you load today.
The estimate needs judgment. BEA said that for early estimates, income from abroad rested on judgment about activity, the dollar and company profits. That was 1991, but it shows how soft this line can be.
It can mislead outside the US. Ireland’s Central Statistics Office page on modified GNI describes GNI*, an indicator designed to measure the size of the Irish economy. It takes GNI and removes depreciation on intellectual property and leased aircraft, plus the net income of redomiciled PLCs, all tied to foreign-owned firms. So for some countries, neither GDP nor GNI is the right number.
It is no timing tool. GNP comes once a quarter, and late. It says nothing about the next day on a chart.
Real GNP vs real GDP: one story for traders
The last two charts take price change out. Real GNP, in chained 2017 dollars, shows the same long climb, with the 2009 dip and the 2020 drop. Its visible axis starts in the early 1950s, though the series goes back to 1947.
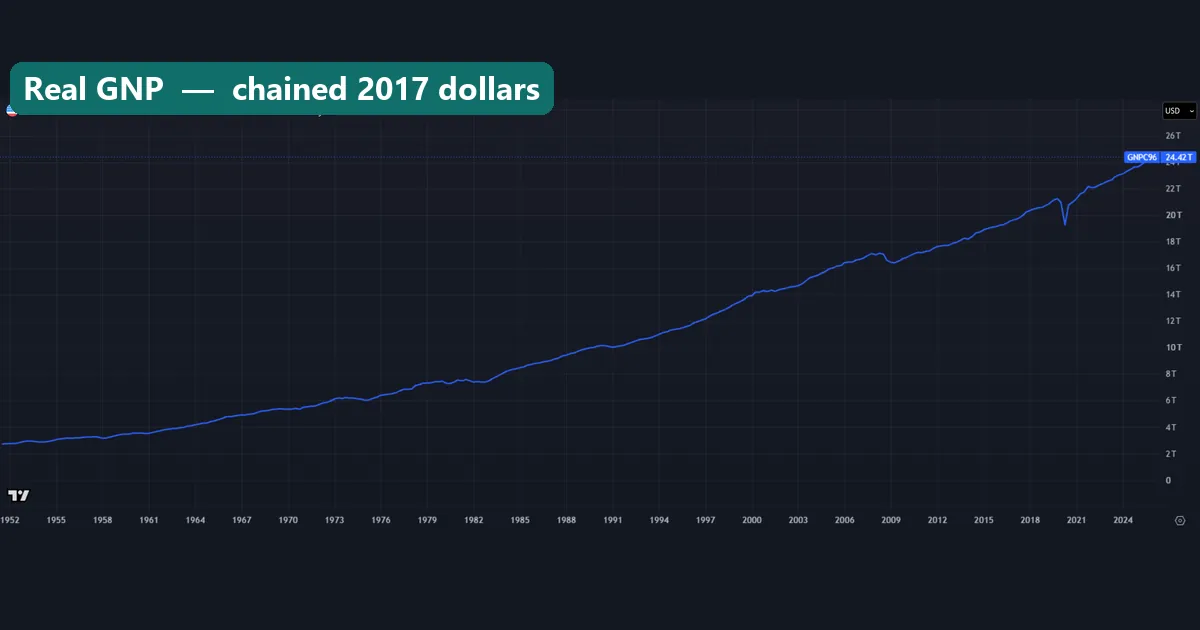
Real GDP from 2017 to Q3 2026 tells the same story at closer range. Now compare early 2022 with the nominal GNP chart above. Nominal GNP kept climbing, while real GDP went flat. Since the GNP and GDP gap is tiny, most of that difference is price change. Our CPI in forex guide tracks the price side.
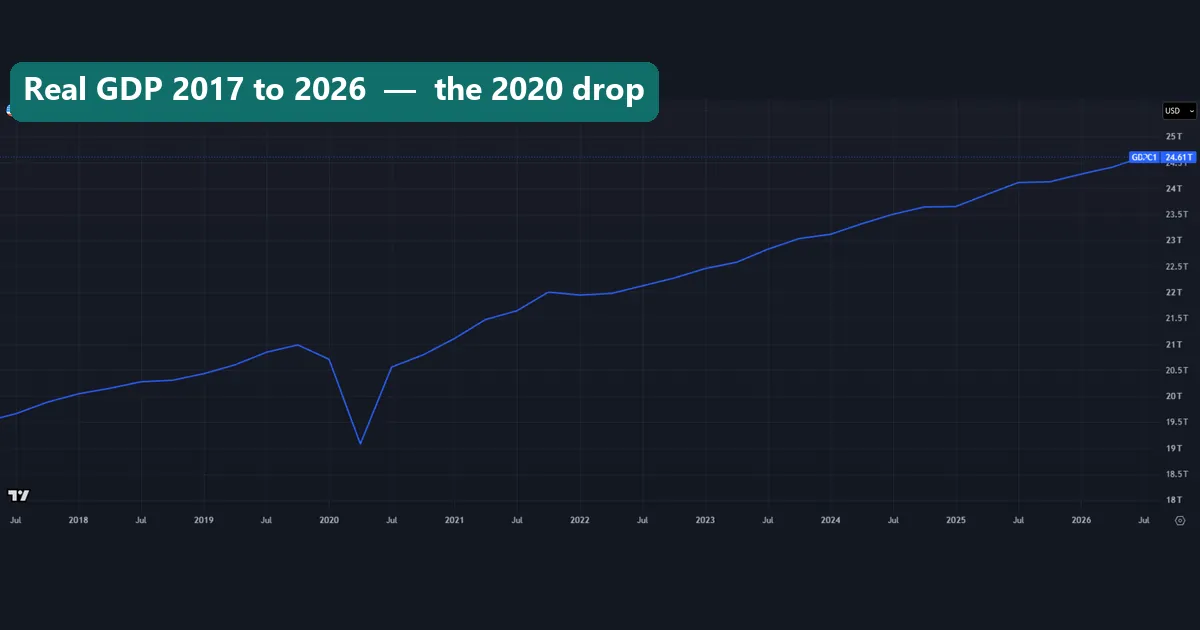
For a trader, that is the key result. Yearly real growth of GNP and GDP correlate at 1.00 in our data, so GNP is not a separate signal. It repeats the GDP story later, with a small twist from income abroad. If you trade the news, the GDP release on your economic calendar comes first. Also, high-impact news such as non-farm payrolls arrives every month, not every quarter.
Common mistakes with GNP data
1. Treating GNP as a fresh signal. It lands after GDP for the same quarter and grows at almost the same rate. So the news is mostly out already.
2. Mixing nominal and real. The 8.6% drop in Q2 2020 is nominal. In early 2022, nominal GNP rose while real GDP stalled. Check which kind of series you hold before you compare it.
3. Reading an annual rate as one quarter’s output. $32,559.4bn is a yearly pace. Also, a change on the prior quarter, a change on the prior year and an annualized change are three different numbers.
4. Reading the sign as a verdict. GNP below GDP does not mean the economy shrank. It means income paid abroad beat income received, by a sliver.
Where to go next
To read release dates and forecasts, see how to read an economic calendar. For what moves rates after the data, read central bank rate decisions and what yields are.
New to macro data? Start with learn fundamental analysis, then weigh it against charts with fundamental vs technical analysis. Of the sources above, the 1991 BEA article is the best single read on GNP.
FAQ: gross national product
What is gross national product in simple terms?
It is the value of goods and services made with labor and property that a country’s residents supply, at home or abroad. GDP, by contrast, counts output inside the borders.
What is the difference between GNP and GDP?
GDP asks where the output happened, and GNP asks who supplied the labor and property. To get GNP, take GDP, add income received from the rest of the world and subtract income paid to it.
Is US GNP bigger than GDP?
Usually, yes. GNP sat above GDP in 96.9% of quarters from 1947 to mid-2026, with a median gap of +0.62% of GDP. But it sat below GDP in 10 of the 11 quarters from Q4 2023 to Q2 2026.
Why did the US switch from GNP to GDP?
BEA’s 1991 article gave three main reasons. GDP matches the coverage of data such as jobs and productivity. It eases comparisons, since most countries and the international guidelines already featured GDP. And the data on income from abroad came late for the early estimates.
Is GNP the same as GNI?
They follow the same bridge: GDP plus income received from abroad minus income paid abroad. Eurostat calls the result GNI, and BEA still publishes a series named GNP. So check each agency’s notes before you treat one as the other.
Does GNP move the forex market?
We did not measure price moves around GNP releases, so we cannot say. We did measure that real GNP and real GDP growth correlate at 1.00, so GNP adds little to the GDP release.
How often is US GNP published?
The series is quarterly, and each value is a seasonally adjusted annual rate. In our pull, GNP ran one quarter behind GDP: GDP had Q3 2026, while GNP stopped at Q2 2026.
Can I trade on GNP numbers?
Use GNP as background on the US economy, not as an entry signal, because it comes late and tracks GDP closely. Any trade on macro data carries risk, and results are not guaranteed; past performance is not indicative of future results.
Last updated: 6 November 2026.

About the author
Written by Dominic Walsh, a Forex trader and MT4/MT5 indicator, Expert Advisor and script developer. Every tool on forexmt4systems.com is tested on live charts before release and ships with ready-to-use compiled MT4 (.ex4) and MT5 (.ex5) files. Learn more about the trader and developer behind this site.
How we build, test and correct every tool: Editorial & Testing Policy. Trading carries risk; see the disclaimer.